A new measurement of antineutrino oscillation with the full detector configuration at Daya Bay
F. P. An
Institute of Modern Physics, East China University of Science and Technology, Shanghai
A. B. Balantekin
University of Wisconsin, Madison, Wisconsin, USA
H. R. Band
Department of Physics, Yale University, New Haven, Connecticut, USA
M. Bishai
Brookhaven National Laboratory, Upton, New York, USA
S. Blyth
Department of Physics, National Taiwan University, Taipei
National United University, Miao-Li
I. Butorov
Joint Institute for Nuclear Research, Dubna, Moscow Region
G. F. Cao
Institute of High Energy Physics, Beijing
J. Cao
Institute of High Energy Physics, Beijing
W. R. Cen
Institute of High Energy Physics, Beijing
Y. L. Chan
Chinese University of Hong Kong, Hong Kong
J. F. Chang
Institute of High Energy Physics, Beijing
L. C. Chang
Institute of Physics, National Chiao-Tung University, Hsinchu
Y. Chang
National United University, Miao-Li
H. S. Chen
Institute of High Energy Physics, Beijing
Q. Y. Chen
Shandong University, Jinan
S. M. Chen
Department of Engineering Physics, Tsinghua University, Beijing
Y. X. Chen
North China Electric Power University, Beijing
Y. Chen
Shenzhen University, Shenzhen
J. H. Cheng
Institute of Physics, National Chiao-Tung University, Hsinchu
J. Cheng
Shandong University, Jinan
Y. P. Cheng
Institute of High Energy Physics, Beijing
J. J. Cherwinka
University of Wisconsin, Madison, Wisconsin, USA
M. C. Chu
Chinese University of Hong Kong, Hong Kong
J. P. Cummings
Siena College, Loudonville, New York, USA
J. de Arcos
Department of Physics, Illinois Institute of Technology, Chicago, Illinois, USA
Z. Y. Deng
Institute of High Energy Physics, Beijing
X. F. Ding
Institute of High Energy Physics, Beijing
Y. Y. Ding
Institute of High Energy Physics, Beijing
M. V. Diwan
Brookhaven National Laboratory, Upton, New York, USA
E. Draeger
Department of Physics, Illinois Institute of Technology, Chicago, Illinois, USA
D. A. Dwyer
Lawrence Berkeley National Laboratory, Berkeley, California, USA
W. R. Edwards
Lawrence Berkeley National Laboratory, Berkeley, California, USA
S. R. Ely
Department of Physics, University of Illinois at Urbana-Champaign, Urbana, Illinois, USA
R. Gill
Brookhaven National Laboratory, Upton, New York, USA
M. Gonchar
Joint Institute for Nuclear Research, Dubna, Moscow Region
G. H. Gong
Department of Engineering Physics, Tsinghua University, Beijing
H. Gong
Department of Engineering Physics, Tsinghua University, Beijing
M. Grassi
Institute of High Energy Physics, Beijing
W. Q. Gu
Shanghai Jiao Tong University, Shanghai
M. Y. Guan
Institute of High Energy Physics, Beijing
L. Guo
Department of Engineering Physics, Tsinghua University, Beijing
X. H. Guo
Beijing Normal University, Beijing
R. W. Hackenburg
Brookhaven National Laboratory, Upton, New York, USA
R. Han
North China Electric Power University, Beijing
S. Hans
Brookhaven National Laboratory, Upton, New York, USA
M. He
Institute of High Energy Physics, Beijing
K. M. Heeger
Department of Physics, Yale University, New Haven, Connecticut, USA
Y. K. Heng
Institute of High Energy Physics, Beijing
A. Higuera
Department of Physics, University of Houston, Houston, Texas, USA
Y. K. Hor
Center for Neutrino Physics, Virginia Tech, Blacksburg, Virginia, USA
Y. B. Hsiung
Department of Physics, National Taiwan University, Taipei
B. Z. Hu
Department of Physics, National Taiwan University, Taipei
L. M. Hu
Brookhaven National Laboratory, Upton, New York, USA
L. J. Hu
Beijing Normal University, Beijing
T. Hu
Institute of High Energy Physics, Beijing
W. Hu
Institute of High Energy Physics, Beijing
E. C. Huang
Department of Physics, University of Illinois at Urbana-Champaign, Urbana, Illinois, USA
H. X. Huang
China Institute of Atomic Energy, Beijing
X. T. Huang
Shandong University, Jinan
P. Huber
Center for Neutrino Physics, Virginia Tech, Blacksburg, Virginia, USA
G. Hussain
Department of Engineering Physics, Tsinghua University, Beijing
D. E. Jaffe
Brookhaven National Laboratory, Upton, New York, USA
P. Jaffke
Center for Neutrino Physics, Virginia Tech, Blacksburg, Virginia, USA
K. L. Jen
Institute of Physics, National Chiao-Tung University, Hsinchu
S. Jetter
Institute of High Energy Physics, Beijing
X. P. Ji
School of Physics, Nankai University, Tianjin
Department of Engineering Physics, Tsinghua University, Beijing
X. L. Ji
Institute of High Energy Physics, Beijing
J. B. Jiao
Shandong University, Jinan
R. A. Johnson
Department of Physics, University of Cincinnati, Cincinnati, Ohio, USA
L. Kang
Dongguan University of Technology, Dongguan
S. H. Kettell
Brookhaven National Laboratory, Upton, New York, USA
M. Kramer
Lawrence Berkeley National Laboratory, Berkeley, California, USA
Department of Physics, University of California, Berkeley, California, USA
K. K. Kwan
Chinese University of Hong Kong, Hong Kong
M. W. Kwok
Chinese University of Hong Kong, Hong Kong
T. Kwok
Department of Physics, The University of Hong Kong, Pokfulam, Hong Kong
T. J. Langford
Department of Physics, Yale University, New Haven, Connecticut, USA
K. Lau
Department of Physics, University of Houston, Houston, Texas, USA
L. Lebanowski
Department of Engineering Physics, Tsinghua University, Beijing
J. Lee
Lawrence Berkeley National Laboratory, Berkeley, California, USA
R. T. Lei
Dongguan University of Technology, Dongguan
R. Leitner
Charles University, Faculty of Mathematics and Physics, Prague
A. Leung
Department of Physics, The University of Hong Kong, Pokfulam, Hong Kong
J. K. C. Leung
Department of Physics, The University of Hong Kong, Pokfulam, Hong Kong
C. A. Lewis
University of Wisconsin, Madison, Wisconsin, USA
D. J. Li
University of Science and Technology of China, Hefei
F. Li
Institute of High Energy Physics, Beijing
G. S. Li
Shanghai Jiao Tong University, Shanghai
Q. J. Li
Institute of High Energy Physics, Beijing
S. C. Li
Department of Physics, The University of Hong Kong, Pokfulam, Hong Kong
W. D. Li
Institute of High Energy Physics, Beijing
X. N. Li
Institute of High Energy Physics, Beijing
X. Q. Li
School of Physics, Nankai University, Tianjin
Y. F. Li
Institute of High Energy Physics, Beijing
Z. B. Li
Sun Yat-Sen (Zhongshan) University, Guangzhou
H. Liang
University of Science and Technology of China, Hefei
C. J. Lin
Lawrence Berkeley National Laboratory, Berkeley, California, USA
G. L. Lin
Institute of Physics, National Chiao-Tung University, Hsinchu
P. Y. Lin
Institute of Physics, National Chiao-Tung University, Hsinchu
S. K. Lin
Department of Physics, University of Houston, Houston, Texas, USA
J. J. Ling
Brookhaven National Laboratory, Upton, New York, USA
Department of Physics, University of Illinois at Urbana-Champaign, Urbana, Illinois, USA
J. M. Link
Center for Neutrino Physics, Virginia Tech, Blacksburg, Virginia, USA
L. Littenberg
Brookhaven National Laboratory, Upton, New York, USA
B. R. Littlejohn
Department of Physics, University of Cincinnati, Cincinnati, Ohio, USA
Department of Physics, Illinois Institute of Technology, Chicago, Illinois, USA
D. W. Liu
Department of Physics, University of Houston, Houston, Texas, USA
H. Liu
Department of Physics, University of Houston, Houston, Texas, USA
J. L. Liu
Shanghai Jiao Tong University, Shanghai
J. C. Liu
Institute of High Energy Physics, Beijing
S. S. Liu
Department of Physics, The University of Hong Kong, Pokfulam, Hong Kong
C. Lu
Joseph Henry Laboratories, Princeton University, Princeton, New Jersey, USA
H. Q. Lu
Institute of High Energy Physics, Beijing
J. S. Lu
Institute of High Energy Physics, Beijing
K. B. Luk
Department of Physics, University of California, Berkeley, California, USA
Lawrence Berkeley National Laboratory, Berkeley, California, USA
Q. M. Ma
Institute of High Energy Physics, Beijing
X. Y. Ma
Institute of High Energy Physics, Beijing
X. B. Ma
North China Electric Power University, Beijing
Y. Q. Ma
Institute of High Energy Physics, Beijing
D. A. Martinez Caicedo
Department of Physics, Illinois Institute of Technology, Chicago, Illinois, USA
K. T. McDonald
Joseph Henry Laboratories, Princeton University, Princeton, New Jersey, USA
R. D. McKeown
California Institute of Technology, Pasadena, California, USA
College of William and Mary, Williamsburg, Virginia, USA
Y. Meng
Center for Neutrino Physics, Virginia Tech, Blacksburg, Virginia, USA
I. Mitchell
Department of Physics, University of Houston, Houston, Texas, USA
J. Monari Kebwaro
Xi’an Jiaotong University, Xi’an
Y. Nakajima
Lawrence Berkeley National Laboratory, Berkeley, California, USA
J. Napolitano
Department of Physics, College of Science and Technology, Temple University, Philadelphia, Pennsylvania, USA
D. Naumov
Joint Institute for Nuclear Research, Dubna, Moscow Region
E. Naumova
Joint Institute for Nuclear Research, Dubna, Moscow Region
H. Y. Ngai
Department of Physics, The University of Hong Kong, Pokfulam, Hong Kong
Z. Ning
Institute of High Energy Physics, Beijing
J. P. Ochoa-Ricoux
Instituto de Física, Pontificia Universidad Católica de Chile, Santiago, Chile
A. Olshevski
Joint Institute for Nuclear Research, Dubna, Moscow Region
J. Park
Center for Neutrino Physics, Virginia Tech, Blacksburg, Virginia, USA
S. Patton
Lawrence Berkeley National Laboratory, Berkeley, California, USA
V. Pec
Charles University, Faculty of Mathematics and Physics, Prague
J. C. Peng
Department of Physics, University of Illinois at Urbana-Champaign, Urbana, Illinois, USA
L. E. Piilonen
Center for Neutrino Physics, Virginia Tech, Blacksburg, Virginia, USA
L. Pinsky
Department of Physics, University of Houston, Houston, Texas, USA
C. S. J. Pun
Department of Physics, The University of Hong Kong, Pokfulam, Hong Kong
F. Z. Qi
Institute of High Energy Physics, Beijing
M. Qi
Nanjing University, Nanjing
X. Qian
Brookhaven National Laboratory, Upton, New York, USA
N. Raper
Department of Physics, Applied Physics, and Astronomy, Rensselaer Polytechnic Institute, Troy, New York, USA
B. Ren
Dongguan University of Technology, Dongguan
J. Ren
China Institute of Atomic Energy, Beijing
R. Rosero
Brookhaven National Laboratory, Upton, New York, USA
B. Roskovec
Charles University, Faculty of Mathematics and Physics, Prague
X. C. Ruan
China Institute of Atomic Energy, Beijing
B. B. Shao
Department of Engineering Physics, Tsinghua University, Beijing
H. Steiner
Department of Physics, University of California, Berkeley, California, USA
Lawrence Berkeley National Laboratory, Berkeley, California, USA
G. X. Sun
Institute of High Energy Physics, Beijing
J. L. Sun
China General Nuclear Power Group
W. Tang
Brookhaven National Laboratory, Upton, New York, USA
D. Taychenachev
Joint Institute for Nuclear Research, Dubna, Moscow Region
H. Themann
Brookhaven National Laboratory, Upton, New York, USA
K. V. Tsang
Lawrence Berkeley National Laboratory, Berkeley, California, USA
C. E. Tull
Lawrence Berkeley National Laboratory, Berkeley, California, USA
Y. C. Tung
Department of Physics, National Taiwan University, Taipei
N. Viaux
Instituto de Física, Pontificia Universidad Católica de Chile, Santiago, Chile
B. Viren
Brookhaven National Laboratory, Upton, New York, USA
V. Vorobel
Charles University, Faculty of Mathematics and Physics, Prague
C. H. Wang
National United University, Miao-Li
M. Wang
Shandong University, Jinan
N. Y. Wang
Beijing Normal University, Beijing
R. G. Wang
Institute of High Energy Physics, Beijing
W. Wang
Sun Yat-Sen (Zhongshan) University, Guangzhou
W. W. Wang
Nanjing University, Nanjing
X. Wang
College of Electronic Science and Engineering, National University of Defense Technology, Changsha
Y. F. Wang
Institute of High Energy Physics, Beijing
Z. Wang
Department of Engineering Physics, Tsinghua University, Beijing
Z. Wang
Institute of High Energy Physics, Beijing
Z. M. Wang
Institute of High Energy Physics, Beijing
H. Y. Wei
Department of Engineering Physics, Tsinghua University, Beijing
L. J. Wen
Institute of High Energy Physics, Beijing
K. Whisnant
Iowa State University, Ames, Iowa, USA
C. G. White
Department of Physics, Illinois Institute of Technology, Chicago, Illinois, USA
L. Whitehead
Department of Physics, University of Houston, Houston, Texas, USA
T. Wise
University of Wisconsin, Madison, Wisconsin, USA
H. L. H. Wong
Department of Physics, University of California, Berkeley, California, USA
Lawrence Berkeley National Laboratory, Berkeley, California, USA
S. C. F. Wong
Chinese University of Hong Kong, Hong Kong
Sun Yat-Sen (Zhongshan) University, Guangzhou
E. Worcester
Brookhaven National Laboratory, Upton, New York, USA
Q. Wu
Shandong University, Jinan
D. M. Xia
Institute of High Energy Physics, Beijing
Chongqing University, Chongqing
J. K. Xia
Institute of High Energy Physics, Beijing
X. Xia
Shandong University, Jinan
Z. Z. Xing
Institute of High Energy Physics, Beijing
J. Y. Xu
Chinese University of Hong Kong, Hong Kong
J. L. Xu
Institute of High Energy Physics, Beijing
J. Xu
Beijing Normal University, Beijing
Y. Xu
School of Physics, Nankai University, Tianjin
T. Xue
Department of Engineering Physics, Tsinghua University, Beijing
J. Yan
Xi’an Jiaotong University, Xi’an
C. G. Yang
Institute of High Energy Physics, Beijing
L. Yang
Dongguan University of Technology, Dongguan
M. S. Yang
Institute of High Energy Physics, Beijing
M. T. Yang
Shandong University, Jinan
M. Ye
Institute of High Energy Physics, Beijing
M. Yeh
Brookhaven National Laboratory, Upton, New York, USA
Y. S. Yeh
Institute of Physics, National Chiao-Tung University, Hsinchu
B. L. Young
Iowa State University, Ames, Iowa, USA
G. Y. Yu
Nanjing University, Nanjing
Z. Y. Yu
Institute of High Energy Physics, Beijing
S. L. Zang
Nanjing University, Nanjing
L. Zhan
Institute of High Energy Physics, Beijing
C. Zhang
Brookhaven National Laboratory, Upton, New York, USA
H. H. Zhang
Sun Yat-Sen (Zhongshan) University, Guangzhou
J. W. Zhang
Institute of High Energy Physics, Beijing
Q. M. Zhang
Xi’an Jiaotong University, Xi’an
Y. M. Zhang
Department of Engineering Physics, Tsinghua University, Beijing
Y. X. Zhang
China General Nuclear Power Group
Y. M. Zhang
Sun Yat-Sen (Zhongshan) University, Guangzhou
Z. J. Zhang
Dongguan University of Technology, Dongguan
Z. Y. Zhang
Institute of High Energy Physics, Beijing
Z. P. Zhang
University of Science and Technology of China, Hefei
J. Zhao
Institute of High Energy Physics, Beijing
Q. W. Zhao
Institute of High Energy Physics, Beijing
Y. F. Zhao
North China Electric Power University, Beijing
Y. B. Zhao
Institute of High Energy Physics, Beijing
L. Zheng
University of Science and Technology of China, Hefei
W. L. Zhong
Institute of High Energy Physics, Beijing
L. Zhou
Institute of High Energy Physics, Beijing
N. Zhou
University of Science and Technology of China, Hefei
H. L. Zhuang
Institute of High Energy Physics, Beijing
J. H. Zou
Institute of High Energy Physics, Beijing
Abstract
We report a new measurement of electron antineutrino
disappearance using the fully-constructed Daya Bay Reactor Neutrino
Experiment. The final two of eight antineutrino detectors were
installed in the summer of 2012. Including the 404 days of data
collected from October 2012 to November 2013 resulted in a total
exposure of 6.9105 GWth-ton-days, a 3.6 times
increase over our previous results. Improvements in energy
calibration limited variations between detectors to 0.2%. Removal of
six 241Am-13C radioactive calibration sources reduced the
background by a factor of two for the detectors in the experimental
hall furthest from the reactors. Direct prediction of the
antineutrino signal in the far detectors based on the measurements in
the near detectors explicitly minimized the dependence of the
measurement on models of reactor antineutrino emission. The
uncertainties in our estimates of and were halved as a result of these improvements. Analysis of
the relative antineutrino rates and energy spectra between detectors
gave and in the three-neutrino
framework.
neutrino oscillation, neutrino mixing, reactor, Daya Bay
pacs:
14.60.Pq, 29.40.Mc, 28.50.Hw, 13.15.+g
Neutrino flavor oscillation due to the mixing angle has
been observed using reactor antineutrinos An et al. (2012a); Ahn et al. (2012); Abe et al. (2014a)
and accelerator neutrinos Abe et al. (2014b); Adamson et al. (2013). The Daya
Bay experiment previously reported the discovery of a non-zero value
of by observing the disappearance of reactor
antineutrinos over kilometer distances An et al. (2012a, 2013, 2014a), and
the first measurement of the effective mass splitting
111 is an effective mass splitting that can be obtained
by replacing with
, where
, and is the difference
between the mass-squares of the mass eigenstates and
.
To estimate the values of and
from the measured value of ,
see the description in Appendix.
via the distortion of the energy
spectrum An et al. (2014b). Here we present new results with
significant improvements in energy calibration and background
reduction. Installation of the final two detectors and a tripling of
operation time provided a total exposure of 6.9105 GWth-ton-days, 3.6 times more than reported in our previous
publication An et al. (2014b). With these improvements the precision
of was enhanced by a factor of two compared to
the world’s previous best estimate. The precision of
was equally enhanced, and is now competitive with
the precision of measured via accelerator
neutrino disappearance Adamson et al. (2014); Abe et al. (2014c).
The Daya Bay experiment started collecting data on 24 December 2011
with six antineutrino detectors (ADs) located in three underground
experimental halls (EHs). Three ADs were positioned in two near halls
at short distances from six nuclear reactor cores, two ADs in EH1 and
one in EH2, and three ADs were positioned in the far hall, EH3. Data
taking was paused on 28 July 2012 while two new ADs were installed,
one in EH2 and the other in EH3. During the installation, a broad set
of calibration sources were deployed into the two ADs of EH1 using
automated calibration units Liu et al. (2014) and a manual
calibration system Huang et al. (2013). Operation of the full
experiment with all eight ADs started on 19 October 2012. This Letter
presents results based on 404 days of data acquired in the 8-AD period
combined with all 217 days of data acquired in the 6-AD period. A
blind analysis strategy was implemented by concealing the baselines
and target masses of the two new ADs, as well as the operational data
of all reactor cores for the new data period.
Each of the three Daya Bay experimental halls hosts functionally
identical ADs inside a muon detector system. The latter consists of a
two-zone pure water Cherenkov detector, referred to as the inner and
outer water shields (IWS and OWS), covered on top by an array of
resistive plate chambers (RPCs). Each AD consists of three nested
cylindrical vessels. The inner vessel is filled with 0.1%
gadolinium-doped liquid scintillator (Gd-LS), which constitutes the
primary antineutrino target. The vessel surrounding the target is
filled with undoped LS, increasing the efficiency of detecting gamma
rays produced in the target. The outermost vessel is filled with
mineral oil. A total of 192 20-cm photomultiplier tubes (PMTs) are
radially positioned in the mineral-oil region of each AD. Further
details on the experimental setup are contained in
Refs. An et al. (2012b, 2015); Daya Bay Collaboration ; An et al.. Reactor
antineutrinos are detected via the inverse -decay (IBD)
reaction, . The gamma rays
(totalling MeV) generated from the neutron capture on Gd
with a mean capture time of 30 form a delayed
signal and enable powerful background suppression. The light from the
gives an estimate of the incident energy,
MeV,
where is the prompt energy including the positron kinetic
and annihilation energy, and is the average neutron
recoil energy (10 keV).
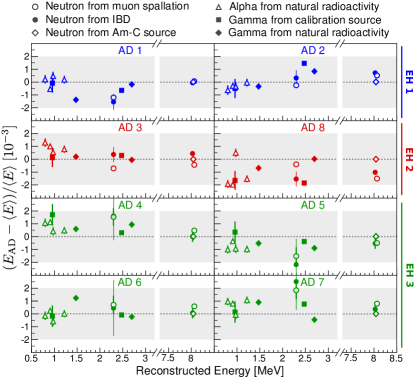
Figure 1: Comparison of the reconstructed energy between antineutrino
detectors for a variety of calibration references. is
the reconstructed energy determined using each AD, and is the 8-detector average. Error bars are
statistical only, and systematic variations between detectors for
all calibration references were 0.2%. The 8 MeV n-Gd
capture gamma peaks from Am-C sources were used to define the energy
scale of each detector, and hence show zero deviation.
Differences in energy response between detectors directly impacted the
estimation of . PMT gains were calibrated
continuously using uncorrelated single electrons emitted by the
photocathode. The signals of 0.3% of the PMTs were discarded due to
abnormal hit rates or charge distributions. The detector energy scale
was calibrated using Am-C neutron sources Liu et al. deployed at
the detector center, with the 8 MeV peaks from neutrons captured
on Gd aligned across all eight detectors. The time variation and the
position dependence of the energy scale was corrected using the
2.506 MeV gamma-ray peak from 60Co calibration sources. The
reconstructed energies of various calibration reference points in
different ADs are compared in Fig. 1. The spatial
distribution of each calibration reference varies, incorporating
deviations in spatial response between detectors. Figure 1 presents measurements of 68Ge,
60Co and Am-C calibration sources when placed at the center of
each detector. Neutrons from IBD and muon spallation that were
captured on gadolinium, were distributed nearly uniformly throughout the Gd-LS region.
Those neutrons that were captured on 1H,
intrinsic particles from polonium and radon decays,
and gammas from 40K and 208Tl decays,
were distributed inside and outside of the target volume.
All of these events were selected within the Gd-LS region based on their reconstructed vertices.
The uncorrelated relative uncertainty of the energy scale
is thus determined to be . This reduction of 43% compared to
the previous publication An et al. (2014b) was enabled by improvements
in the correction of position and time dependence, and enhanced the
precision of by 9%. The reduction was confirmed
by an alternative method which used the n-Gd capture of muon-induced
spallation neutrons to calibrate the scale, time dependence, and
spatial dependence of the detector energy response.
Nonlinearity in the energy response of an AD originated from two
dominant sources: particle-dependent nonlinear light yield of the
scintillator and charge-dependent nonlinearity in the PMT readout
electronics. Each effect was at the level of 10%. We constructed a
semi-empirical model that predicted the reconstructed energy for a
particle assuming a specific energy deposited in the scintillator. The
model contained four parameters: Birks’ constant, the relative
contribution to the total light yield from Cherenkov radiation, and
the amplitude and scale of an exponential correction describing the
non-linear electronics response.
This exponential form of the electronics response was motivated by MC
and confirmed with an independent FADC measurement.
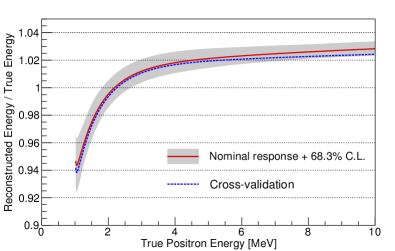
Figure 2: Estimated energy response of the detectors to positrons,
including both kinetic and annihilation gamma energy (red solid
curve). The prominent nonlinearity below 4 MeV was attributed to
scintillator light yield (from ionization quenching and Cherenkov
light production) and the charge response of the electronics. Gamma
rays from both deployed and intrinsic sources as well as spallation
12B decay determined the model, and provided an
envelope of curves consistent with the data within a 68.3%
C.L. (grey band). An independent estimate using the beta+gamma
energy spectra from 212Bi, 214Bi, 208Tl, as well as
the 53-MeV edge in the Michel electron spectrum gave a similar
result (blue dashed line), albeit with larger systematic
uncertainties.
The nominal parameter values were obtained from an unconstrained
-fit to various AD calibration datasets, comprising twelve
gamma lines from both deployed and naturally occurring sources as well
as the continuous -decay spectrum of 12B produced by muon
spallation inside the Gd-LS volumes. The nominal positron response
derived from the best fit parameters is shown in
Fig. 2. The depicted uncertainty band represents
other response functions consistent with the fitted calibration data
within a 68.3% C.L. This -based approach to obtain the energy
response resulted in 1% uncertainties of the absolute energy
scale above 2 MeV. The uncertainties of the positron response were
validated using the 53 MeV cutoff in the Michel electron spectrum from
muon decay at rest and the continuous + spectra from
natural bismuth and thallium decays. These improvements added
confidence in the characterization of the absolute energy response of
the detectors, although they resulted in negligible changes to the
measured mixing parameters.
IBD candidates were selected using the same criteria discussed in
Ref. An et al. (2012a). Noise introduced by PMT light emission in the voltage
divider, called flashing, was efficiently removed using the
techniques of Ref. An et al. (2013). We required 0.7 MeV
12.0 MeV, 6.0 MeV 12.0 MeV, and 1 s 200 s, where is the delayed energy and
was the time difference between the
prompt and delayed signals. In order to suppress cosmogenic products,
candidates were rejected if their delayed signal occurred (i) within a
(, ) time-window with respect to an IWS
or OWS trigger with a PMT multiplicity 12, (ii) within a
(, ) time-window with respect to
triggers in the same AD with reconstructed energy 20 MeV, or (iii)
within a (, ) time-window with respect to
triggers in the same AD with reconstructed energy 2.5 GeV. To
select only definite signal pairs, we required the signal to have a
multiplicity of 2: no other 0.7 MeV signal occurred within a
() time-window.
Estimates for the five major sources of background for the new data
sample are improved with respect to Ref. An et al. (2014b). The
background produced by the three Am-C neutron sources inside the
automated calibration units contributed significantly to the total
systematic uncertainty of the correlated backgrounds in the 6-AD
period. Because of this, two of the three Am-C sources in each AD in
EH3 were removed during the 2012 summer installation period. As a
result, the average correlated Am-C background rate in the far hall
decreased by a factor of 4 in the 8-AD period. As in previous
publications An et al. (2012a, 2014b), this rate was determined by
monitoring the single neutron production rate from the Am-C
sources. Removal of these Am-C sources had negligible consequences for
our calibration.
Energetic, or fast, neutrons of cosmogenic origin produced a
correlated background for this study. Relaxing the prompt-energy
selection to (0.7-100) MeV revealed the fast-neutron background
spectrum above 12 MeV. Previously we deduced the rate and spectrum of
this background using a linear extrapolation into the IBD prompt
signal region. Here we used a background-enhanced dataset to improve
the estimate. We found 6043 fast neutron candidates with prompt
energy from 0.7 to 100 MeV in the 200 s following cosmogenic
signals only detected by the OWS or RPC. The energy spectrum of these
veto-tagged signals was consistent with the spectrum of IBD-like
candidate signals above 12 MeV, and was used to estimate the rate and
energy spectrum for the fast neutron background from 0.7 to 12 MeV.
The systematic uncertainty was estimated from the difference between
this new analysis and the extrapolation method previously employed,
and was determined to be half of the estimate reported in
Ref. An et al. (2013).
The methods used in Refs. An et al. (2012a, 2013) to estimate the backgrounds
from the uncorrelated prompt-delayed pairs (i.e. accidentals),
the correlated - decays from cosmogenic 9Li and 8He,
and the 13C(,n)16O reaction, were extended to the
current 6+8 AD data sample. The decrease in the single-neutron rate
from the Am-C sources reduced the average rate of accidentals in the
far hall by a factor of 2.7. As a result, the total backgrounds amount
to about 3% (2%) of the IBD candidate sample in the far (near)
hall(s). The systematic uncertainties in the
13C(,n)16O cross section and in the transportation
of the particles were reassessed through a comparison of
experimental results and simulation packages,
respectively J. Zhao, Z. Y. Yu, J. L. Liu, X. B. Li, F. H. Zhang
and D. M. Xia (2014). The estimation of 9Li/8He now
dominated the background uncertainty in both the near and far
halls. The estimated signal and background rates, as well as the
efficiencies of the muon veto, , and multiplicity
selection, , are summarized in Table 1.
EH1
EH2
EH3
AD1
AD2
AD3
AD8
AD4
AD5
AD6
AD7
IBD candidates
304459
309354
287098
190046
40956
41203
40677
27419
DAQ live time(days)
565.436
565.436
568.03
378.407
562.451
562.451
562.451
372.685
0.8248
0.8218
0.8575
0.8577
0.9811
0.9811
0.9808
0.9811
0.9744
0.9748
0.9758
0.9756
0.9756
0.9754
0.9751
0.9758
Accidentals(per day)
Fast neutron(per AD per day)
9Li/8He(per AD per day)
Am-C correlated 6-AD(per day)
Am-C correlated 8-AD(per day)
13C(, n)16O(per day)
IBD rate(per day)
Table 1: Summary of signal and backgrounds. Rates are corrected for
the muon veto and multiplicity selection efficiencies
. The measured ratio of
the IBD rates in AD1 and AD2 (AD3 and AD8 in the 8-AD period) was
0.9810.004 (1.0190.004) while the expected ratio was
0.982 (1.012).
A detailed treatment of the absolute and relative efficiencies using
the first six ADs was reported in Refs. An et al. (2012b, 2013). The
uncertainties of the absolute efficiencies are correlated among the
ADs and thus play a negligible role in the relative measurement of
disappearance. The performance of the two new
ADs was found to be consistent with the other detectors. Estimates of
two prominent uncorrelated uncertainties, the delayed-energy selection
efficiency and the fraction of neutrons captured on Gd, were confirmed
for all eight ADs using improved energy reconstruction and increased
statistics.
Oscillation was measured using the -dependent disappearance of
, as given by the survival probability
(1)
Here is the energy in MeV of the , is the distance in
meters from its production point, is the solar mixing
angle, and is the mass-squared
difference of the first two neutrino mass eigenstates in eV2.
Recent precise measurements of the IBD positron energy spectrum
disagree with models of reactor
emission Abe et al. (2014a); Zhong ; Seo ; Dwyer and Langford (2015).
The characteristics of the signals in this energy range are consistent with reactor antineutrino emission, and disfavor background or detector response as possible origins for the discrepancy. A separate manuscript, in preparation, will present the evidence in detail and provide the necessary data to allow detailed comparison of our measurement with existing and future models. Given these discrepancies between measurements and models,
here we present a technique for predicting the signal in the far hall
based on measurements obtained in the near halls, with minimal
dependence on models of the reactor antineutrinos. In our previous
measurements An et al. (2014b), model-dependence was limited by
allowing variation of the predicted flux within
model uncertainties, while the technique here provides an explicit
demonstration of the negligible model dependence. A was
defined as
(2)
where is the observed number of events after background
subtraction in the -th bin of reconstructed positron energy
. The superscript denotes a far (near)
detector. The symbol represents a covariance matrix that includes
known systematic and statistical uncertainties. The quantity is
a weight that accounts for the differences between near and far
measurements. For the case of a single reactor, the weight can
be simply calculated from the ratios of detector mass, distance to the
reactor, efficiency, and antineutrino oscillation probability, as
given by the relation:
(3)
Here is the number of target protons, is the
efficiency, and is the distance to the reactor for a given
detector. is the oscillation probability for the -th
reconstructed energy bin and the reactor antineutrino flux
(which cancels from ). With calculated in reconstructed
positron energy, the detector response introduces small ( 0.2%
above 2 MeV) calculable deviations from Eq. 1.
For multiple reactor cores, the weight was modified:
(4)
The probability distribution
accounts for the
energy transfer from the to the and imperfections in
the detector energy response (loss in non-active elements,
non-linearity, and resolution). The extrapolation factor was
calculated as
(5)
where is given by Eq. 1, is the distance
between a far (near) detector and core , and is the
predicted antineutrino flux from core for the -th true energy
bin. In the single-reactor core case, the antineutrino flux
cancels in the expression for and Eq. 4 reduces to
Eq. 3. Although the cancellation is not exact for
multiple cores, the impact of the uncertainty in reactor antineutrino
flux was found to be 0.1%.
The covariance matrix element was the sum of a statistical
term, calculated analytically, and a systematic term determined by
Monte-Carlo calculation using
(6)
Here, is the number of simulated experiments generated with energy
spectra , including systematic variations of detector response,
flux, and background. The choice of reactor antineutrino
model Dwyer and Langford (2015); K. Schreckenbach, G. Colvin, W. Gelletly, and F. von
Feilitzsch (1985); Hahn et al. (1989); von Feilitzsch et al. (1982); Vogel et al. (1981); Huber (2011); Mueller et al. (2011) in
calculating the covariance had negligible (0.2%) impact on the determination
of the oscillation parameters.
Without loss of sensitivity, we summed the IBD signal candidates of
the ADs within the same hall, accounting for small differences of
target mass, detection efficiency, background and baseline. We
considered the 6-AD and 8-AD periods separately in order to properly
handle correlations in reactor antineutrino flux, detector exposure,
and background. This means that and in the above equations ran
over the 37 reconstructed energy bins for the two near/far
combinations and for the two periods considered
(). More details of this method are described
in Ref. Nakajima et al..
Using this method, we found and
,
with (see the Supplemental Material 222See Supplemental Material at [URL] for a table of
as a function of (, )). While we use and from
Ref. Beringer et al. (2012), our result was largely independent of these
values. Consistent results were obtained when our previous methods
An et al. (2012a, 2014b) were applied to this larger dataset. Under the
normal (inverted) hierarchy assumption,
yields (). This result was
consistent with and of comparable precision to measurements obtained
from accelerator and
disappearance Adamson et al. (2014); Abe et al. (2014c). Using only the
relative rates between the detectors and from
Ref. Adamson et al. (2014) we found
, with .
The reconstructed positron energy spectrum observed in the far site is
compared in Fig. 3 with the expectation based on
the near-site measurements. The , and
C.L. allowed regions in the - plane are shown in
Fig. 4. The spectral shape from all experimental
halls is compared in Fig. 5 to the electron antineutrino
survival probability assuming our best estimates of the oscillation
parameters. The total uncertainties of both
and are dominated by statistics. The
most significant systematic uncertainties for are
due to the relative detector efficiency, reactor power, relative
energy scale and 9Li/8He background. The systematic
uncertainty in is dominated by
uncertainty in the relative energy scale.
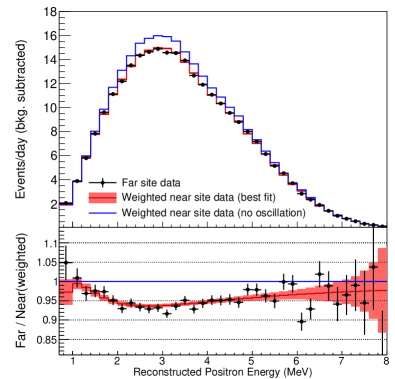
Figure 3: Upper: Background-subtracted reconstructed positron energy
spectrum observed in the far site (black points), as well as the
expectation derived from the near sites excluding (blue line) or
including (red line) our best estimate of oscillation. The spectra
were efficiency-corrected and normalized to one day of
livetime. Lower: Ratio of the spectra to the no-oscillation
case. The error bars show the statistical uncertainty of the far
site data. The shaded area includes the systematic and statistical
uncertainties from the near site measurements.
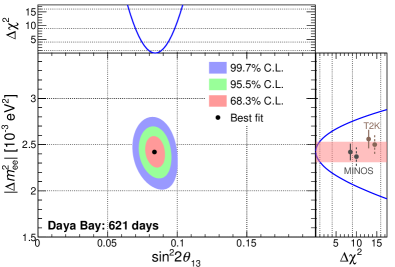
Figure 4: Regions in the - plane allowed at the
, and confidence levels by the near-far
comparison of rate and energy spectra. The best
estimates were and (black
point). The adjoining panels show the dependence of on (top) and (right). The
allowed region (shaded band, C.L.) was consistent with
measurements of using muon disappearance by the
MINOS Adamson et al. (2014) and T2K Abe et al. (2014c) experiments,
converted to assuming the normal
(solid) and inverted (dashed) mass hierarchy.Figure 5: Electron antineutrino survival probability versus effective
propagation distance divided by the average
antineutrino energy . The data points
represent the ratios of the observed antineutrino spectra to the
expectation assuming no oscillation. The solid line represents the
expectation using the best estimates of and
. The error bars are statistical only. was calculated for each bin using the estimated
detector response, and was obtained by equating
the actual flux to an effective antineutrino flux using a single
baseline.
In summary, enhanced measurements of and have been obtained by studying the energy-dependent
disappearance of the electron antineutrino interactions recorded in a
6.9105 GWth-ton-days exposure. Improvements in
calibration, background estimation, as well as increased statistics
allow this study to provide the most precise estimates to date of the
neutrino mass and mixing parameters and
.
Daya Bay is supported in part by the Ministry of Science and
Technology of China, the U.S. Department of Energy, the Chinese
Academy of Sciences, the CAS Center for Excellence in Particle
Physics, the National Natural Science Foundation of China, the
Guangdong provincial government, the Shenzhen municipal government,
the China General Nuclear Power Group, Key Laboratory of Particle and
Radiation Imaging (Tsinghua University), the Ministry of Education,
Key Laboratory of Particle Physics and Particle Irradiation (Shandong
University), the Ministry of Education, Shanghai Laboratory for
Particle Physics and Cosmology, the Research Grants Council of the
Hong Kong Special Administrative Region of China, the University
Development Fund of The University of Hong Kong, the MOE program for
Research of Excellence at National Taiwan University, National
Chiao-Tung University, and NSC fund support from Taiwan, the
U.S. National Science Foundation, the Alfred P. Sloan Foundation, the
Ministry of Education, Youth, and Sports of the Czech Republic, the
Joint Institute of Nuclear Research in Dubna, Russia, the NSFC-RFBR
joint research program, the National Commission of Scientific and
Technological Research of Chile, and the Tsinghua University
Initiative Scientific Research Program. We acknowledge Yellow River
Engineering Consulting Co., Ltd., and China Railway 15th Bureau Group
Co., Ltd., for building the underground laboratory. We are grateful
for the ongoing cooperation from the China General Nuclear Power Group
and China Light and Power Company.
Appendix A Appendix: Why is used by Daya Bay
This section describes the advantages of reporting the Daya Bay
measurement of electron antineutrino disappearance in terms of an
effective mass-squared difference , which is
independent of the unknown ordering of neutrino masses and future
improvements in our knowledge of the solar oscillation parameters.
A.1 Introduction
In the three-flavor framework, the survival probability of electron antineutrino
is given by
(7)
where . The three
mass-squared differences are subject to the constraint where
“”(“”) is for the normal(inverted) mass ordering (or
hierarchy). Therefore, determination of
(or ) depends on knowledge of the mass
ordering and solar oscillation parameters.
The Daya Bay experiment reports a precise measurement of the
effective mass splitting , which is independent of
our knowledge of the ordering and solar parameters. In this
approach, we approximate the survival probability using
(8)
Despite the advantage of using for the
measurement, it has the disadvantage of not being a fundamental
parameter. Therefore, we must determine a relation between
and given knowledge of the mass
ordering and solar oscillation parameters.
In the following sections, we are going to address the following two questions:
•
Is Eq. A.1 good enough at the current experimental precision?
•
How can we estimate the value of once the
value of is obtained?
where , ,
and .
The last term of the above formula is the so-called “solar term”
that governs the reactor antineutrino oscillation at O(100) km.
For the L/E range covered by Daya Bay, .
Thus, Eq. A.2 can be approximated as,
(10)
By comparing Eq. A.2 with Eq. A.1, we obtain
the expression relating to (or )
(11)
(12)
where .
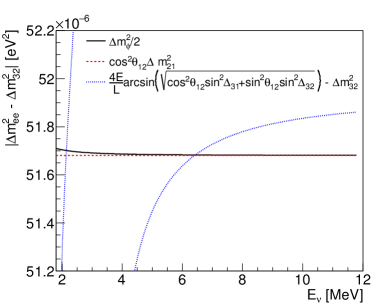
A.3 Numerical evaluation
By definition, is a function of
L/E. Using the current values of
and Beringer et al. (2012),
Fig. 6 shows the value of
as a function of energy for L = 1.6 km.
We find that
is essentially a constant in our L/E region, and numerically identical to
cos.
Thus, this definition of is similar to the definition
introduced in Ref. Nunokawa et al. (2005):
(13)
(14)
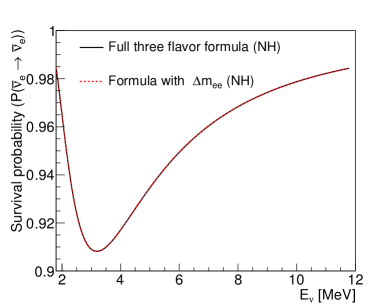
Figure 7 is a comparison of the approximated formula with
,
(15)
to the three-flavor formula, Eq. A.1.
In this comparison, L = 1.6 km, ,
, and
normal mass hierarchy are the inputs.
The agreement between the two, better than , is excellent and exceeds the
achievable experimental precision.
Figure 6: Values of (black solid line) at L = 1.6 km as a function of the neutrino
energy, with
and Beringer et al. (2012).
For comparison, calculations based on other definitions of
,
(red dashed line) and
(blue dotted line)
are also shown.
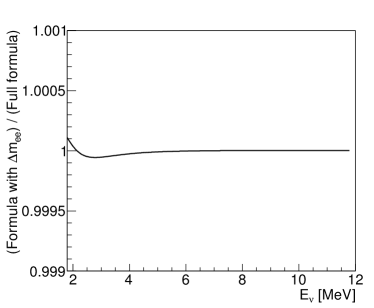
Figure 7: Comparison of the survival probability
at L = 1.6 km between the
approximated formula with
and the exact
three-flavor formula (Eq. A.1).
The oscillation parameters used in this comparison are
and under the
normal mass hierarchy assumption.
The top panel shows the survival probabilities calculated with the two formulae, and
the bottom panel shows the ratio of the two.
This study demonstrates that, once we obtain the value of using Eq. A.1,
we can reliably deduce the values of and using Eqs. 11 and 12 with
(16)
Using the current values of and ,
, and
(.
It is important to point out that the exact solution of
was never used to extract
the value of or from the measured
in Daya Bay.
References
An et al. (2012a)F. P. An et al. (Daya Bay Collaboration), Phys. Rev. Lett. 108, 171803 (2012a).
Ahn et al. (2012)J. Ahn et al. (RENO Collaboration), Phys. Rev. Lett. 108, 191802 (2012).
Abe et al. (2014a)Y. Abe et al. (Double Chooz
Collaboration), JHEP 1410, 86 (2014a).
Note (1) is an effective mass splitting that can be
obtained by replacing with , where ,
and is the difference between the mass-squares of the
mass eigenstates and . To estimate the values of and from the measured value of , see the description in Appendix.
An et al. (2014b)F. P. An et al. (Daya Bay Collaboration), Phys. Rev. Lett. 112, 061801 (2014b).
Liu et al. (2014)J. L. Liu, B. Cai, R. Carr, D. A. Dwyer, W. Q. Gu, G. S. Li, X. Qian, R. D. McKeown, R. H. M. Tsang, W. Wang, et al., Nucl. Instr. Meth. A 750, 19 (2014).
Huang et al. (2013)H. X. Huang, X. C. Ruan,
J. Ren, C. J. Fan, Y. N. Chen, Y. L. Lv, Z. H. Wang, Z. Y. Zhou,
L. Hou, B. Xin, et al., JINST 8, P09013
(2013).
An et al. (2012b)F. P. An et al. (Daya Bay Collaboration), Nucl. Instr. Meth.
A 685, 78 (2012b).
(18)J. L. Liu, R. Carr, D. A. Dwyer, W. Q. Gu, G. S. Li, R. D. McKeown, X. Qian, R. H. M. Tsang,
F. F. Wu, and C. Zhang, arXiv:1504.07911 (2015)
.
J. Zhao, Z. Y. Yu, J. L. Liu, X. B. Li, F. H. Zhang
and D. M. Xia (2014)J. Zhao, Z. Y. Yu,
J. L. Liu, X. B. Li, F. H. Zhang and D. M. Xia, Chin. Phys. C 38, 116201 (2014).
K. Schreckenbach, G. Colvin, W. Gelletly, and F. von
Feilitzsch (1985)K. Schreckenbach, G.
Colvin, W. Gelletly, and F. von Feilitzsch, Phys. Lett. B 160, 325 (1985).
Hahn et al. (1989)A. Hahn et al., Phys. Lett. B 218, 365 (1989).
von Feilitzsch et al. (1982)F. von
Feilitzsch, A. Hahn, and K. Schreckenbach, Phys. Lett. B 118, 162 (1982).