Early-type galaxies in the Antlia Cluster:
A deep look into scaling relations
Abstract
We present the first large-scale study of the photometric and structural relations followed by early-type galaxies (ETGs) in the Antlia cluster. Antlia is the third nearest populous galaxy cluster after Fornax and Virgo (d Mpc). A photographic catalog of its galaxy content was built by Ferguson & Sandage in 1990 (FS90). Afterwards, we performed further analysis of the ETG population located at the cluster centre. Now, we extend our study covering an area four times larger, calculating new total magnitudes and colours, instead of isophotal photometry, as well as structural parameters obtained through Sérsic model fits extrapolated to infinity. Our present work involves a total of 177 ETGs, out of them 56 per cent have been cataloged by FS90 while the rest (77 galaxies) are newly discovered ones.
Medium-resolution GEMINI and VLT spectra are used to confirm membership when available. Including radial velocities from the literature, 59 ETGs are confirmed as Antlia members.
Antlia scaling relations mainly support the existence of unique functions (linear and curved) that join bright and dwarf ETGs, excluding compact ellipticals (cEs). Lenticular galaxies are outliers only with respect to the curved relation derived for effective surface brightness versus absolute magnitude. The small number of bright ellipticals and cEs present in Antlia, prevents us from testing if the same data can be fitted with two different linear sequences, for bright and dwarf ETGs. However, adding data from other clusters and groups, the existence of such sequences is also noticeable in the same scaling relations.
keywords:
galaxies: clusters: general – galaxies: clusters: individual: Antlia – galaxies: fundamental parameters – galaxies: dwarf – galaxies: elliptical and lenticular, cD1 Introduction
Dwarf elliptical (dE) galaxies have been studied extensively from low-density (Karachentseva et al., 2010; Schroyen et al., 2011; Leaman et al., 2013) to highly populated environments (Grebel et al., 2003; Sánchez-Janssen et al., 2008; De Rijcke et al., 2009; Penny et al., 2011). The fact that they are the most abundant morphological galaxy type in clusters and groups (Binggeli et al., 1988; Andreon, 1998), allows statistically significant results to be obtained from a thorough analysis of the early-type population within a given environment.
According to current structure formation models, dwarfs may be the descendants of building blocks of larger systems (White & Rees, 1978). We are particularly interested in the formation and evolution discussion (Janz & Lisker, 2009; Kormendy et al., 2009; Kormendy & Bender, 2012; Graham, 2013; Penny et al., 2014), one of whose main points regards whether there is a link between dwarf (dEs and dSphs) and more luminous elliptical (E) galaxies.
Different scenarios have been proposed to account for the formation of early-type galaxies: (i) the monolithic collapse (Eggen et al., 1962) in which there was an early major star-formation burst as a result of the collapse of primordial gas, producing the most massive galaxies in short periods of time, and the smallest ones as the universe evolved; (ii) the hierarchical merger scenario, stating that the minor structures merged to build up the larger ones. It was proposed by Toomre (1977) that current massive elliptical galaxies are the result from mergers of disk galaxies. The mechanism that allows this transformation could be heating and sweeping out of the galactic gas by supernova-driven winds and a series of star formation episodes (Yoshii & Arimoto, 1987; Davies & Phillipps, 1988; Faber et al., 2007; Naab & Ostriker, 2009). Environmental effects, on the other hand, are invoked as a means to transform late-type into early-type galaxies. Among these effects, we can consider starvation (Larson et al., 1980), galaxy harassment, ram-pressure stripping, and tidal effects (Mayer et al., 2001). In this sense, the galaxy harassment model proposed by Moore et al. (1999) predicts that massive spirals may turn into lenticular (S0) galaxies due to the loss of their gas, while low-mass spirals become the current dE through gas loss and kinematic heating of their stellar disks (Conselice et al., 2001). There is an important amount of observational evidence that shows similarities between disk galaxies and dEs, thus supporting this scenario (Barazza et al., 2002; De Rijcke et al., 2003; Lisker et al., 2006; Toloba et al., 2011).
The study of scaling relations followed by galaxies with different morphologies is a way to explore the evolutionary history of these systems (Conselice, 2008; Schombert, 2013, and references therein). While there is overall consensus that both Es and dEs (but not compact ellipticals, cE) follow the same relation between luminosity and surface-brightness profile shape (the latter quantified by the Sérsic index ; see Jerjen & Binggeli, 1997), other scale relations (e.g., the Kormendy relation; Kormendy, 1985) have originally been interpreted as evidencing a strict dichotomy between dE and E galaxies, thus suggesting different origins for them (e.g.: Kormendy & Bender, 2012, and references therein). In opposition, some works have attempted to show a continuity in scaling relations, which would imply a continuity of physical properties along the dE – E sequence as a signature of a common origin (Graham & Guzmán, 2003).
Scaling relations are constructed using either global (effective radius, ; effective surface brightness, ) or central (central surface brightness, ) parameters. Kormendy et al. (2009) argued that the different trends in scaling relations between Es and dEs are not due to cores or extra light in their inner regions. These features contribute a small percent to total galaxy luminosity and are excluded from the Sérsic () fits, which globally match the surface brightness profiles of early-type galaxies. On the other hand, it would seem that the E–dE dichotomy vanishes when is measured as the central extrapolation of the surface brightness profile, as shown by Graham & Guzmán (2003). This alternative way to understand the relation between dEs and Es has been developed by Graham (2011) using two linear relations observed in clusters ( versus , and versus ) to derive curved relations between luminosity and effective parameters, thus turning the (apparent) dichotomies into continuous relations.
The present work addresses this subject, with the aim of exploring scaling relations for early-type galaxies in the Antlia Cluster, in this respect a still mostly unstudied environment. One main advantage is the homogeneous CCD photometry of every object in the sample. Galaxy profile fits using Sérsic models have been performed in order to obtain the effective and shape parameters (, , ) of the galaxies in the cluster centre and surrounding areas. In the following, we adopt a distance modulus mag for Antlia (Dirsch et al., 2003).
We carried out previous CCD studies of the Antlia early–type galaxies (ETGs) (Smith Castelli et al., 2008, 2012), focused on those located at the cluster centre. The photometric techniques used in those papers were the following: SExtractor automatic measures (for the majority of low to intermediate luminosity galaxies), and isophote fits using the ellipse task within IRAF111IRAF is distributed by the National Optical Astronomy Observatories, which are operated by the Association of Universities for Research in Astronomy, Inc., under cooperative agreement with the National Science Foundation. (for the brightest objects). In both cases, magnitudes and colours were measured up to a fixed isophotal radius.
In the present paper, we extend the study of the Antlia ETGs including adjacent regions, covering an area four times larger and performing a new total photometry, extrapolating Sérsic models to infinity. We want to remark that Antlia has a particular structure, with two dominant galaxies (NGC 3258 and NGC 3268), which has been interpreted by means of X–ray data as a galaxy cluster in an intermediate merger stage (Hawley et al., 2011; Pedersen et al., 1997; Nakazawa et al., 2000). It thus provides us with the opportunity to test scaling relations in an environment where significant pre-processing should have taken place. We also aim at positioning the Antlia cluster scaling relations in the current picture along with already studied groups and clusters.
This work is organized as follows. In Section 2 we describe the data and summarize the reduction processes. Section 3 addresses the galaxy selection. A discussion is given in Section 4, including the scaling relations obtained with photometric and structural parameters as well as a comparison with other systems. Finally, the conclusions are given in Section 6.
| Field | Observation | Filter | Exposure | Airmass | FWHM | |||
|---|---|---|---|---|---|---|---|---|
| date | [seconds] | [″] | ||||||
| 0 | April 2002 | 10:29:22 | 35:27:54 | 5 | 600 | 1.059 | 1.0 | |
| 7 | 600 | 1.037 | 1.1 | |||||
| 1 | March 2004 | 10:28:59 | 34:57:40 | 5 | 600 | 1.588 | 1.0 | |
| 7 | 1000 | 1.076 | 1.0 | |||||
| 2 | March 2004 | 10:31:09 | 34:55:59 | 5 | 600 | 1.056 | 1.0 | |
| 7 | 900 | 1.016 | 1.2 | |||||
| 3 | March 2004 | 10:31:35 | 35:30:42 | 5 | 600 | 1.269 | 0.9 | |
| 7 | 900 | 1.030 | 0.8 |
2 Observations and Surface photometry
2.1 Data
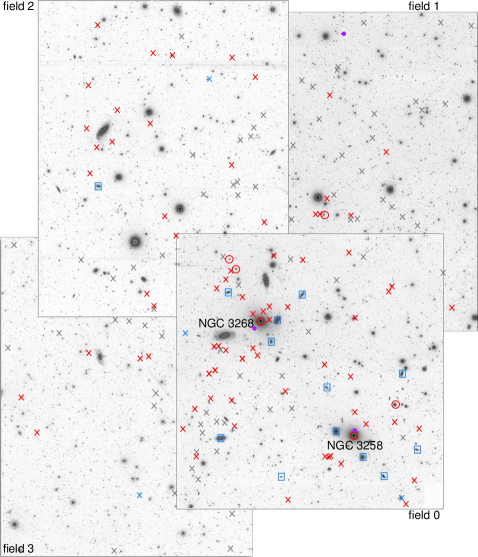
We perform a photometric study with images of the Antlia cluster from two observing runs, obtained with the MOSAIC II wide-field camera mounted at the 4-m Blanco telescope of the Cerro Tololo Inter-American Observatory (CTIO, Chile). During the first run (April 2002) we observed the cluster centre (hereafter field 0), while in the second run (March 2004) we observed three adjoining fields located at the N, NE and E of the central one (hereafter fields 1, 2 and 3, respectively). Each MOSAIC II field covers 36 arcmin 36 arcmin, that corresponds to about kpc2 according to the adopted Antlia distance. Field 0 includes the two giant elliptical galaxies (gEs) located at the cluster centre (NGC 3258 and NGC 3268). Within our Antlia Cluster Project, this central field has been used to study the globular cluster systems of these two galaxies (Dirsch et al., 2003), to perform the first CCD analysis of the ETG population at the cluster centre (Smith Castelli et al., 2008, 2012), as well as to investigate the ultracompact dwarfs (UCDs, Caso et al., 2013, 2014). In addition to this central field, the three adjacent fields are used for the present study. Fig. 1 shows a composition of the four fields. They overlap with each other in order to obtain a homogeneus photometry.
We used the Kron-Cousins and Washington filters, and the instrumental magnitudes were later transformed into those corresponding to the genuine Washington and bands. The MOSAIC II images were reduced using the mscred package within IRAF. Each image was processed using ccdproc, applying the overscan, bias level and flat field corrections. The individual MOSAIC extensions were then combined into a single FITS image using the msccmatch, mscimage and mscimatch tasks, which were used to scale to a common flux level, match coordinates and adjust WCS (World Coordinate System), and also the cosmic ray correction was performed. We next subtracted a second order polynomial surface from the background using mscskysub (when necessary) to remove any residual large-scale gradients. In each filter, the images were aligned and a single stacked image was created using mscstack with ccdclip pixel rejection. More details on the images’ reduction will be given in a forthcoming data paper (Calderón et al., in preparation).
Table 1 gives the observing log, including the dates, position of the field centres, filter, number of exposures () that have been averaged to obtain the final image for each field, exposures, mean airmass, and seeing for these final images.
Regarding the calibration to the standard system, we used the transformation equations for the central field (0) given by Dirsch et al. (2003). For the three adjoining fields (1, 2 and 3), we obtained the following relations between instrumental and standard magnitudes based on standard stars fields from the list of Geisler (1996),
| (1) | |||||
where the coefficients and their errors are given in Table 2, , are the instrumental magnitudes and , the respective airmasses. All the magnitudes and colours presented in the figures of this paper have been corrected for Galactic absorption and reddening. The colour excess was provided by Schlafly & Finkbeiner (2011), and we used the relations (Harris & Canterna, 1977) and (Rieke & Lebofsky, 1985) to obtain the absorption and reddening in the Washington system.
As a consequence of using images taken in two different runs (two years apart) in combination with the large size of the MOSAIC II field, differences in the zero point magnitudes, for each filter and between the four fields, are expected. In order to estimate such offsets, we calculated and magnitudes of the point-sources that lie in the overlapping areas and computed the respective mean differences between fields 1, 2, and 3 with respect to the central (0) one. Finally, we applied the zero point offsets, and referred all and magnitudes to the central field. The offsets are higher in the band ( mag), while in -band are between y mag.
In addition to the MOSAIC II images, we have medium-resolution spectra obtained with GEMINI-GMOS (programmes GS-2011A-Q-35 and GS-2013A-Q-37) and VIMOS-VLT (programme 79.B-0480), all of them in multi-object mode. A description of the observations, reduction, and radial velocity measurement corresponding to the GMOS spectra are given by Caso et al. (2014; a paper dealing with UCDs and bright GCs of NGC 3268), while those to the VIMOS spectra are given by Caso et al. (in preparation; a global kinematic study of the Antlia cluster).
2.2 Surface photometry
We used the ellipse task within the isophote IRAF’s package, to obtain the observed surface brightness profiles (surface brightness versus equivalent radius, being , where is the isophote semi-major axis and its ellipticity) of all ETGs in the sample. In every case, we set off to test the elliptical fits without fixing the geometric parameters, such as ellipticity, position angle, centre coordinates, etc. In some cases, a completely free parameter model could not be fitted due to different reasons like images defects, extremely weak objects, nearby saturated stars. Then, we improved the fits as much as possible, fixing some of the parameters and/or changing the fitting step. For every galaxy, we also built bad-pixels masks to flag-out pixels from the fits and avoid contaminating background or foreground objetcs.
| Coeff. | 0.608 | 0.0184 | 0.111 | |||
| Error | 0.003 | 0.0020 | 0.005 |
Due to the large MOSAIC II field, we preferred to estimate the background (sky level) for each galaxy independently, instead of setting the same background level for the whole image. We first calculated an initial value taking the mode from several positions, free of other sources, around the galaxy. Afterwards, we applied an iterative process until the outer part of the integrated flux profile, i.e. for large galactocentric distances, became as flat as possible. The details of the background estimation will be given in the future data paper.
Regarding the SN ratio, we followed McDonald et al. (2011) and calculated the signal-to-noise ratio at the magnitude arcsec-2 isophote for both bands. For the faintest objects ( mag) the S/N spans a range from to in the filter; while in the filter the range is from to . Note that, despite the lower S/N, the magnitude arcsec-2 isophote corresponds to a larger physical radius in than in , so the galaxies are more clearly detected in .
In order to test the ellipse output, we varied the geometric parameters over a small range to confirm if the final observed profile converged to a unique solution. In addition, we used different steps for each galaxy to check how to obtain the best observed profile.
Then, we fitted the Sérsic model (Sersic, 1968) to every observed galaxy surface brightness and profiles using,
| (2) |
where is the effective radius, is the effective surface brightness, and is the Sérsic shape index that is a measure of the concentration of the light profile. The function depends on the shape parameter and we applied a numerical method to obtain it by solving the equation (Ciotti, 1991),
| (3) |
where is the complete gamma function and the incomplete gamma function.
The Sérsic model is integrated to infinity to obtain total magnitudes and colours. The integrated magnitude results,
The profile fits were carried out with the nfit1d task within IRAF, that performs a residual minimisation using the Levenberg-Marquardt algorithm. The inner 1 arcsec of the profiles was not included in the fits to avoid seeing effects. Anyway, we will show in the data paper that the seeing does not affect the profile fits for galaxies with index .
In most cases, we were able to fit the ETG profiles with only one Sérsic model with residuals below 0.2 mag arcsec-2. We want to make clear that the parameters used for the scaling relations were derived without attempting any bulge-disk decomposition. This may seem particularly inappropriate for S0 galaxies, but note that also cEs and gEs, along with a significant fraction of (bright) dEs, do show two-component profiles even when a clear bulge-disk distinction cannot be made. Our approach thus traces the overall morphology of the ETGs, including both components, when two are present. For example, a decomposition analysis of Virgo early-type dwarf galaxies has been performed by McDonald et al. (2011) and Janz et al. (2014).
3 Sample selection
In this section we describe how the galaxy sample was formed. The original source was the Ferguson & Sandage (1990, hereafter FS90) Antlia catalogue. We used their coordinates to identify all the catalogued galaxies on our MOSAIC II fields. Also, we added the galaxies discovered in our previous study of the central field (Smith Castelli et al., 2012), and now we include new candidates located in the four fields that have not been catalogued before.
3.1 Original sample
The first large-scale study of the galaxy population of the Antlia cluster is the FS90 photographic catalogue, with a limiting magnitude (). On the basis of morphological criteria they give a membership status (1: ‘definite’ member, 2: ‘likely’ member, and 3: ‘possible’ member) for each galaxy. There are 375 galaxies (of all types) located over the whole cluster area in this catalogue. Out of them, 36.5 per cent have membership status 1, i.e. the highest membership probability, 26.5 per cent status 2, and the rest (37 per cent) status 3. Only 6 per cent had measured radial velocities at that time. In successive papers, we obtained IMACS, GMOS, and VIMOS spectra that, including the velocities published in NED222This research has made use of the NASA/IPAC Extragalactic Database (NED) which is operated by the Jet Propulsion Laboratory, California Institute of Technology, under contract with the National Aeronautics and Space Administration., let us confirm now per cent of the FS90 ETG galaxies as cluster members. We recall that to be a confirmed Antlia member, the radial velocity should lie in the range km s-1 (Smith Castelli et al., 2008).
In particular, considering the galaxies with membership status 1 assigned by FS90 (‘definite’ members) that have measured radial velocities from VIMOS spectra, we can confirm that per cent of them are in fact members of the cluster. The high reliability of the FS90 membership classification has already been pointed out in previous works (e.g. Smith Castelli et al., 2012, and references therein). Thus, we will consider the FS90 ETGs with membership 1 as true members. In that way, all ETGs confirmed with radial velocities plus those from FS90 with membership 1 will be considered in the rest of this paper as ‘Antlia members’.
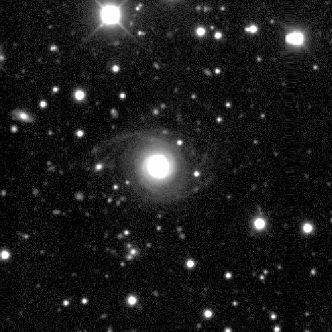
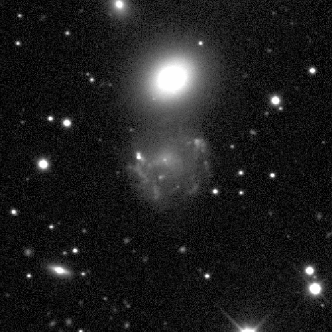
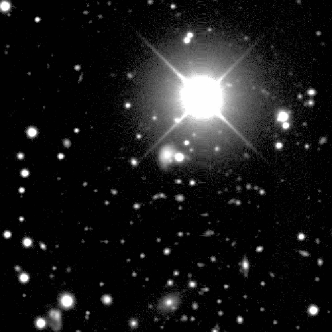
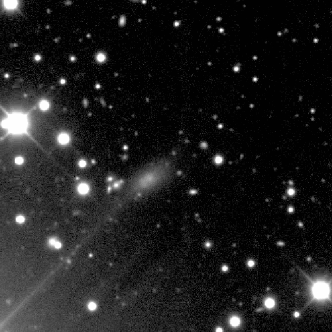
According to this selection, we have obtained surface brightness profiles in and for 100 ETGs. Out of them, 53 are spectroscopically confirmed members. Among the FS90 galaxies, we were unable to obtain several profiles because the galaxies are very faint or superimposed on image defects or gaps. All objects with evident background morphology and/or central bars were also excluded from the present study as well as irregular or other star-forming galaxies, e.g. blue compact dwarfs (BCDs, Vaduvescu et al., 2014). Fig. 2 shows a few examples of galaxies excluded from the present sample.
3.2 Final sample
After a careful visual inspection of and images of the four MOSAIC II fields, we discovered 77 new ETG candidates that have not been catalogued before. The preliminary selection was performed according to the following criteria:
-
a.
The galaxy is not affected by bleeding or diffraction due to a saturated nearby star, or any cosmetic image defects.
-
b.
It preserves isophotal shape and compatible ellipse outputs in both filters.
-
c.
The ellipse output attains a reasonable S/N ratio out to the mag arcsec-2 (–band) isophote. There are no objects to mask near the centre of the target galaxy.
-
d.
The residuals of the best Sérsic fit(s) show no sign of spiral structure.
-
e.
The fit is stable even when performing small changes in the initial geometric parameters or the sky level.
-
f.
We only include in the sample objects with arcsec, thus preventing spurious detections.
-
g.
The new objects have to be identified in both bands, R and C, to be added to the sample (and our catalogue).
The fraction of all galaxies detected only on the R images is less than 5 percent, while no galaxies were detected only on the C images. This is a consequence of the fact that, for a given surface brightness level, the S/N is better in the C band, but the size of the corresponding isophote is larger in the R. The colour bias against the faint red galaxies should then not be highly relevant.
The newly identified ETG candidates are in the faint magnitude regime and correspond mainly to morphologies in accordance with dE (nucleated and non-nucleated) as well as dSph galaxies. For these faint galaxies the probability of lying in the background is obviously higher than for the brighter ones, so only part of them may be real cluster members. As we lack spectra for them, we neither can identify those that —even being Antlia members— should be classified as late-type instead of ETGs. As a consequence, adding all these new galaxy candidates would lead to blur the scaling relations that are the goal of this paper. Thus, we decided to keep those that have higher chances of being ETG members, on the basis of the colour–magnitude relation (CMR) followed by the ETG ‘members’.
It is known that the CMR of ETGs in galaxy clusters is a well defined correlation (e.g. Penny & Conselice, 2008; Jaffé et al., 2011; Mei et al., 2012). Moreover, this CMR (also called ‘red sequence’) is a universal relation with very small scatter, that carries information about the formation of the clusters themselves. The slope of the CMR has been understood as a mass–metallicity relation, while the effect of the (slightly) different ages at each stellar mass is most likely causing the small scatter about the CMR. Such small scatter can be used as an additional constraint, besides morphology, to identify probable cluster members in the cases where no spectroscopy is available. In previous papers we have shown that this scatter does not increase towards fainter magnitudes, remaining almost constant along the whole CMR (Smith Castelli et al., 2008, 2012).
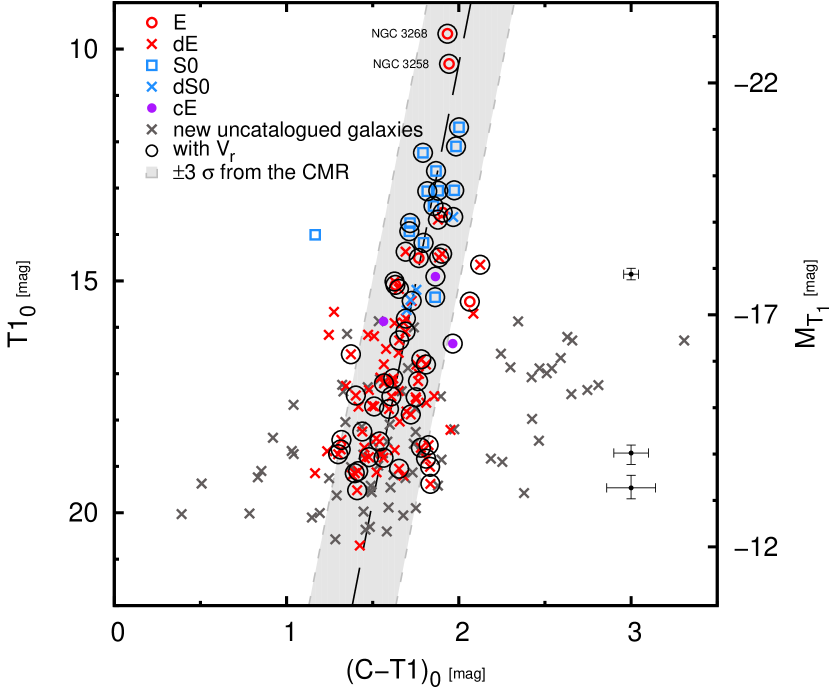
Fig. 3 shows the CMR followed by the Antlia ETG ‘members’. The new uncatalogued galaxies, plotted as grey crosses, have no radial velocity and cover the fainter half of the diagram, towards bluer and redder colours with respect to the CMR. The real nature of these objects is doubtful (the reddest ones are most probably background objects). We decided to add to the final ETG sample only the new galaxies located within of the CMR, that is indicated in the plot as the shaded band. The dispersion is calculated with respect to both variables, colour and magnitude. We stick to the limit because it is supported by the fact that member galaxies confirmed with radial velocity fall within such limits in the CMD (or are located very close).
Seven of these new galaxies have VIMOS spectra (Caso et al., in preparation) and their radial velocities are in the range corresponding to the confirmed members, as explained in Sec. 3.1. Thus, they will be included in the ‘members’ sample. Their basic data are presented in Table 3, i.e. coordinates and Washington photometry. They are named like previously discovered new members (Smith Castelli et al., 2012), with the acronym ANTL followed by the J2000 coordinates333http://cdsweb.u-strasbg.fr/vizier/Dic/iau-spec.htx.
| ID | ||||
|---|---|---|---|---|
| ANTL J103046.7353918.0 | 10:30:46.7 | :39:18.0 | 18.24 | 1.43 |
| ANTL J103036.4353047.2 | 10:30:36.4 | :30:47.2 | 17.87 | 1.72 |
| ANTL J103033.1352638.4 | 10:30:33.1 | :26:38.4 | 18.73 | 1.29 |
| ANTL J103037.4352708.3 | 10:30:37.4 | :27:08.3 | 19.10 | 1.41 |
| ANTL J103021.4353105.2 | 10:30:21.4 | :31:05.2 | 15.01 | 1.62 |
| ANTL J103022.0353805.3 | 10:30:22.0 | :38:05.3 | 17.46 | 1.40 |
| ANTL J103013.7352458.6 | 10:30:13.7 | :24:58.6 | 19.37 | 1.83 |
From now on, we will identify as ‘final sample’ the group comprised of the 107 ‘member’ ETGs plus 31 galaxies from the new ETG sample that lie within of the CMR. That is, the final sample contains 138 galaxies.
4 Results
We will address in the following the scaling relations obtained with the final sample of ETGs in the Antlia cluster. In Section 3.2 we have already introduced the CMR of ETGs and how it has been used to select the most probable early-type members among the newly identified galaxies. We will come back first to the CMR for a more detailed analysis, and will continue with the scaling relations that involve global structural parameters of the final sample.
4.1 The Colour–Magnitude Relation
As said above, Fig. 3 shows the colour–magnitude diagram of the ETGs in the final sample, with the corresponding morphological types indicated in the plot. The dashed black line shows the CMR calculated through a least squares fit of the ETG ‘members’, taking into account errors in both axes, that gives:
| (5) |
where the standard deviation is 1.59. Almost all galaxies that are spectroscopically confirmed members, identified in Fig. 3 with black open circles, fall within from such CMR. This gives support to our selection of new galaxies within such colour limits.
In particular, the existence of a ’break’ (in the sense of slope change) of the bright end of the CMR with respect to the linear fit performed on all the ETGs was not so evident in our previous work on the Antlia cluster (Smith Castelli et al., 2008, 2012). Small differences in the colours of the brightest galaxies are probably responsible of this ‘break’ at mag. In fact, the colours of these brightest galaxies are bluer in the present paper ( mag, 5 galaxies), where magnitudes are not just isophotal but total. It seems that, as a consequence of integrating the fitted Sérsic law to infinity, a slight break can be perceived for the first time, at the bright end of the CMR (Fig. 3). As the Antlia cluster has mainly bright lenticulars and few bright ellipticals, this effect is shown by just a small number of galaxies.
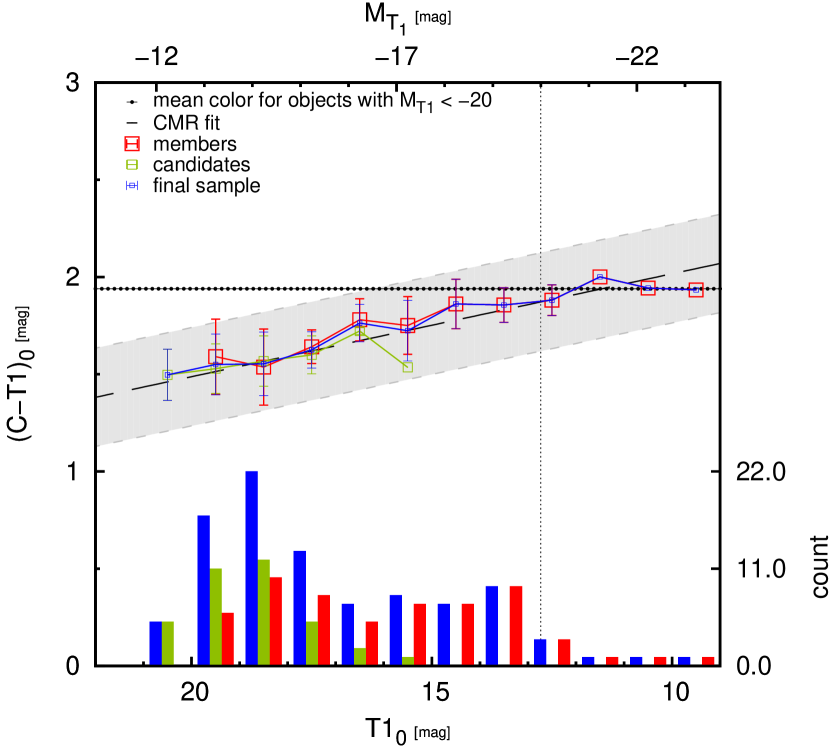
Fig. 4 shows an alternative display of the CMR followed by all the galaxies of the ‘final sample’, i.e. the ‘members’ and the new galaxies that lie within of the CMR. The dashed line is the same fit to the CMR for confirmed members, over the full range of magnitudes. The horizontal dotted line represents the mean colour for the brighter end of the relation (i.e. with mag). The connected points represent the mean colour of the magnitude bins. It can be seen that for the brighter end, the colour remains fixed at . At the bottom, we present a histogram of the number of galaxies in each magnitude bin.
4.2 Scaling relations involving structural parameters
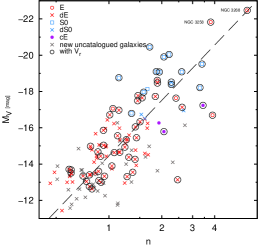
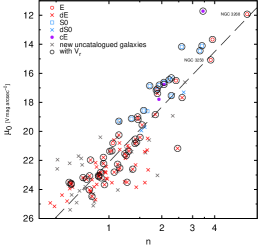
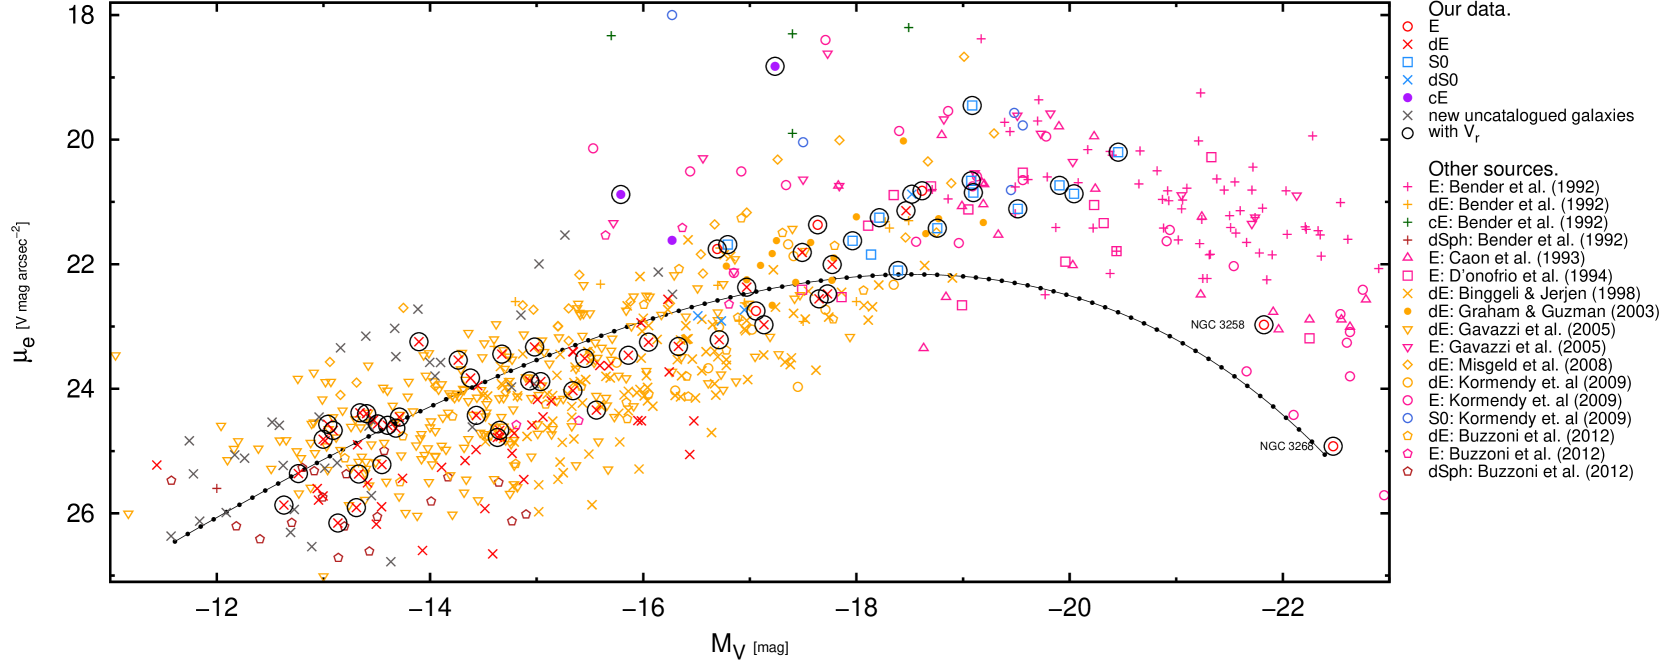
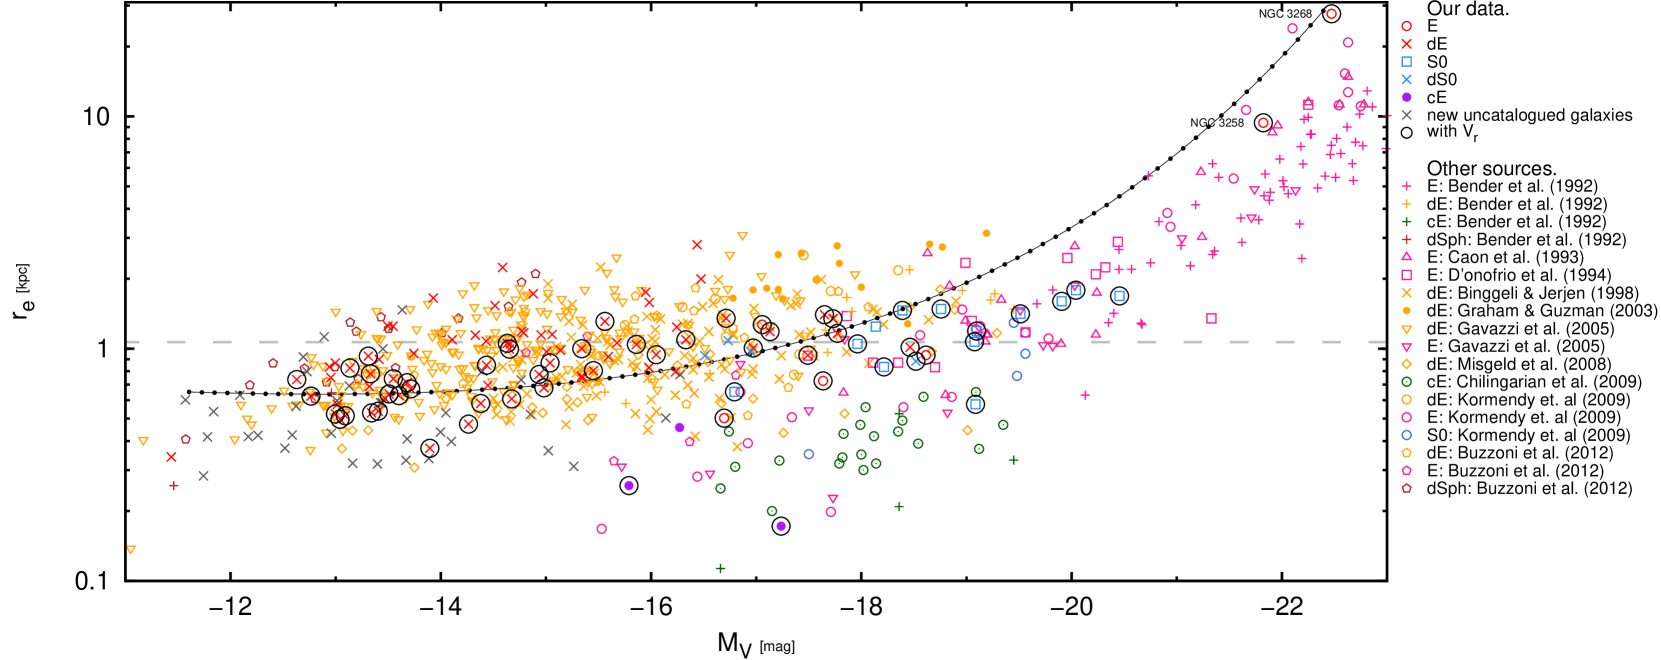
Fig. 5 shows five scaling relations for our ‘final sample’ of Antlia ETGs, namely panel (a) versus absolute magnitude , panel (b) versus Sérsic index , and panel (c) versus at the top row; panel (d) versus , and panel (e) versus at the bottom row. The different symbols are explained within each plot, identifying morphological types, new uncatalogued galaxies within of the CMR, and members confirmed with radial velocities. In order to provide an easy comparison with results for other clusters, the parameters in Washington -band have been transformed into the -band through the equations given by Fukugita et al. (1995) and the relation (Geisler, 1996).
The procedure outlined by Graham (2013) was followed with the aim of obtaining the expressions for the different relations. The plots presented in Figs. 5(a) and 5(b) roughly show linear relations followed by all the ETGs except the two confirmed cEs. They extend from the gEs at the bright end to the dSph candidates at the faint end, covering more than 10 mag in . The linear fits presented in these figures were performed taking into account numerical errors in both axes and excluding cE galaxies. The following expressions are the respective least-square linear fits, which are shown with dashed lines.
| (6) |
| (7) |
Equivalent equations are presented by Graham (2013, and references therein) for the data set compiled by Graham & Guzmán (2003), in the -band: and (we adopted for E galaxies, Fukugita et al. 1995).
A linear relation between and is easily obtained combining the two previous expressions,
| (8) |
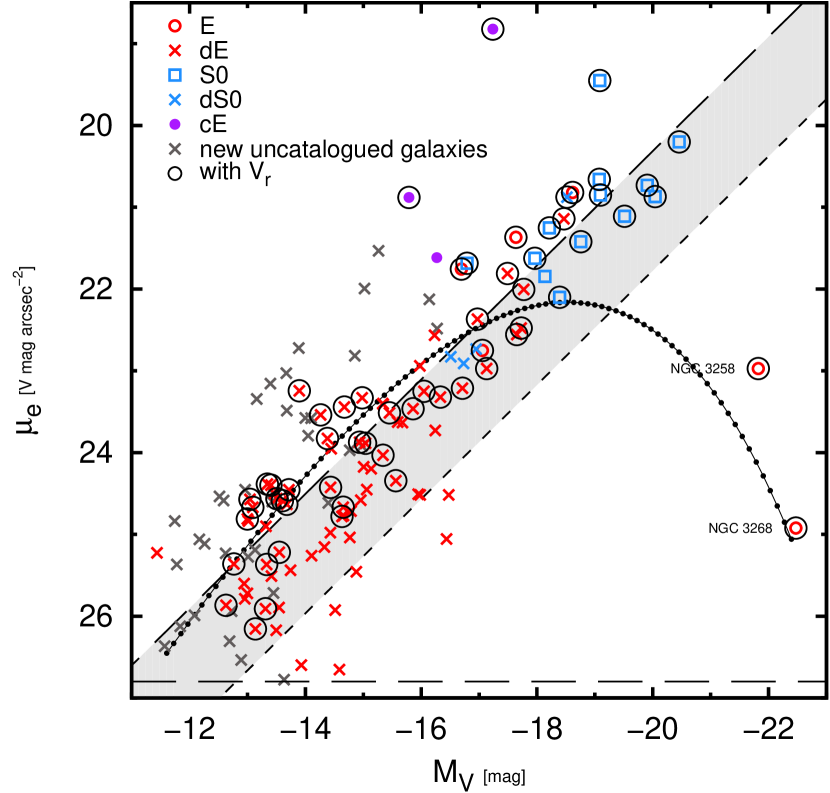
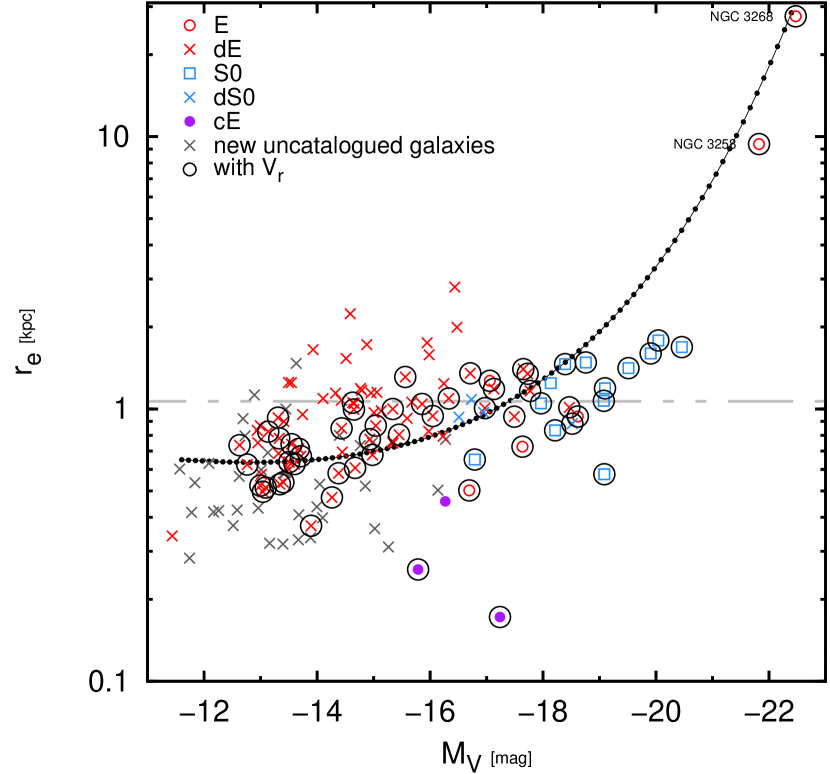
which is presented in Fig. 5(c) and provides a good match to the whole set of Antlia data. This is expected as and are coupled variables in the Sérsic model. The linear correlation coefficients calculated for the relations depicted in panels 5(a) and 5(b) give 0.9 and , respectively, which indicates that the linear correlations provide good fits for all of them. Linear correlations and are evident in the plots presented in Figs. 5(d) and 5(e), followed by all the ETGs with the exception of four confirmed members: the two dominant gEs (NGC 3258 and NGC 3268) and the two cE or M32-type galaxies (FS90 110 and FS90 192, Smith Castelli et al., 2012). Lastly, a different way of fitting these two latter relations is through the curved functions shown in Figs. 5(d) and 5(e) with dotted lines. It should be noted that they follow from the empirical linear correlations obtained before. Additionally, we have tested that small changes in those linear equations lead to large variations in the curved function in Fig. 5(d) and small ones in Fig. 5(e).
In the next Section we will include a discussion relating the different fits that can be performed to the scaling relations and how they can be understood.
4.3 The Kormendy relation
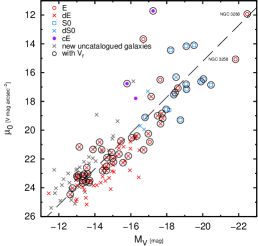
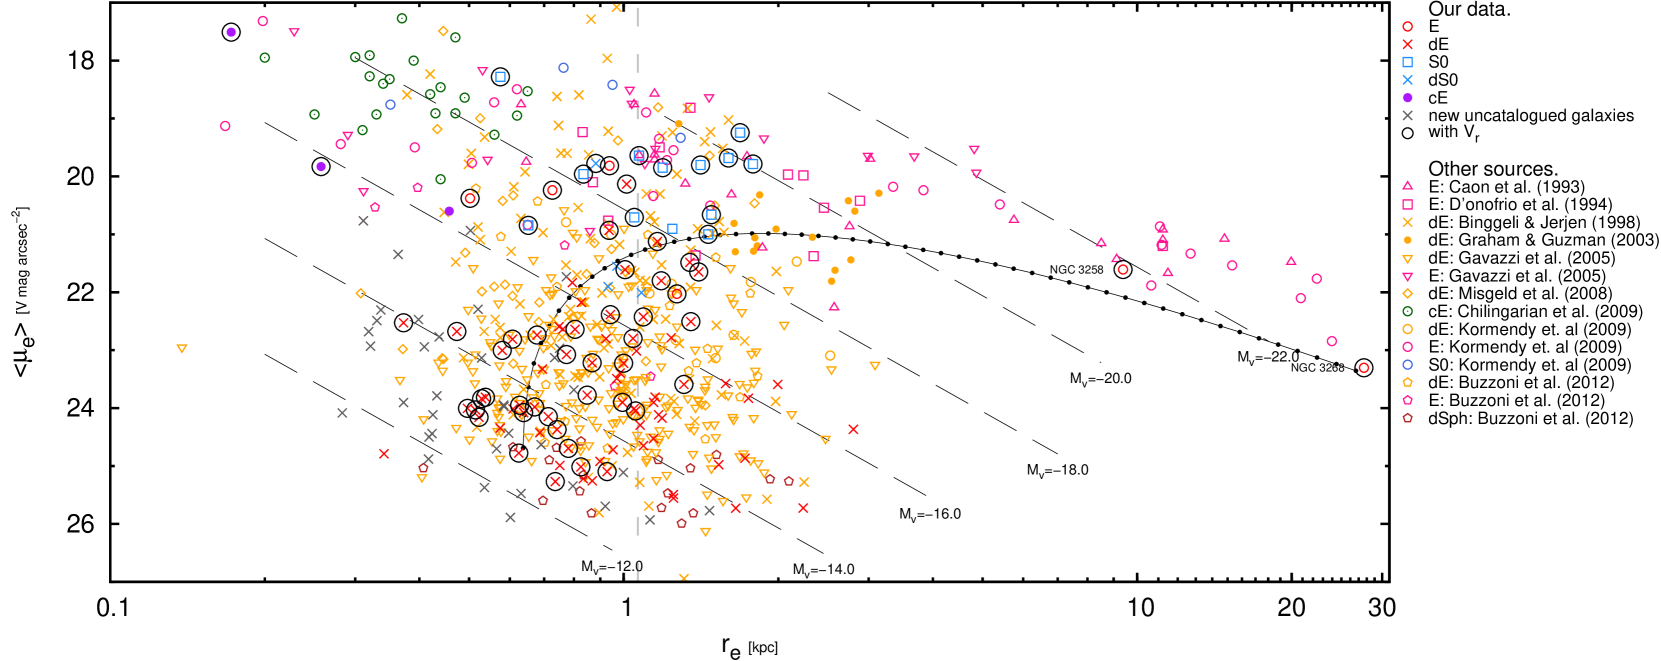
The Kormendy relation (KR) is the correlation between mean effective surface brightness and radius (Kormendy, 1985), more precisely versus , which has proven to be a useful tool to study the formation of ETGs.
Fig. 6 presents the KR for the Antlia galaxies. Once more, bright and dwarf ETGs show different behaviours on this plane. The bright ones follow a linear relation with the gEs and cEs at opposite ends, while the dwarfs present a more disperse distribution hard to disentangle. On one hand, it has been proposed that the distribution of dwarfs agree with the direction of the lines of constant absolute magnitude, that are included in the plot. On the other hand, we have seen that most dwarfs have a mean close to 1 kpc. This latter property is reflected by the curved relation versus obtained by Graham (2011). In our case, this curved relation, shown in Fig. 6, was calculated using the Antlia data by means of the linear relations depicted in Figs. 5(a) and 5(c) excluding cE galaxies. Our dwarf ETGs roughly follow this 1 kpc mean value, although the dispersion is quite high.
4.4 Completeness
It is important to clearly assess the completeness of the sample, particularly when dealing with observations of faint objects. Since the main results of this paper are the numerical fits to scaling relations shown by a sample of low surface brightness objects, completeness thereof directly affects the fits and their dispersions.
The detection of the objects in the sample was performed visually, which means that the images were inspected in detail, and all extended objects displaying an elliptical morphology were identified. For this reason, an automatic method to determine the completeness cannot be applied. Following the procedure described by Lieder et al. (2012, and references therein), we used the effective surface brightness-luminosity relation (Figure 5(d)) for the final sample to estimate its completeness limit. We performed a linear fit of this relation and, in order to avoid any incompleteness effect, we excluded from such fit all objects with mag, obtaining:
| (9) |
with a standard deviation . On the other hand, taking into account the sample’s selection criteria (Section 3), we estimated the effective surface brightness () for an object with Sérsic index and effective radius kpc (typical for dEs), which would show an isophotal radius arcsec at the mag arcsec-2 isophote. The value obtained is mag arcsec-2, which corresponds to mag arcsec-2 in the band.
The long-dashed line in Figure 5(d) shows the fit (from Eq. 9) and the short-dashed line shows (shaded band), which defines a 96% confidence (or completeness). The line corresponding to the fainter limit intersects with that representing mag arcsec-2 at mag. This means that, supposing that the standard deviation remains constant along the whole luminosity range, we have lost only of the faintest galaxies at mag.
5 Discussion
The discussion on the photometric and structural scaling relations, that have been constructed for the final sample of the Antlia cluster, as well as a comparison with results for other clusters, will be given in this Section.
5.1 On the photometric relations
The Antlia CMR of ETGs (Fig. 3) is a tight correlation; along with similar relations in other clusters or groups, it has been attributed mainly to a mass-metallicity relation (Terlevich et al., 1999; Smith Castelli et al., 2012, and references therein). CMRs turned out to be an interesting property to study both from observational and numerical simulations perspectives. From an observational point of view, CMRs have been studied in many groups and clusters (Binggeli et al., 1988; Secker et al., 1997; Khosroshahi et al., 2004). The ‘universality’ of this relation for ETGs has been suggested since the first studies, and many authors reported a similar linear behaviour in different clusters (Mieske et al., 2007; Lisker et al., 2008; Misgeld et al., 2008; Smith Castelli et al., 2008; Misgeld et al., 2009), although the possible existence of nonlinear trends has been analysed too (Ferrarese et al., 2006; Janz & Lisker, 2009).
For instance, the existence of a break of the bright end of the CMR, with respect to the linear fit performed on all the ETGs, has already been discussed for about a decade (e.g. Bernardi et al., 2007, 2011; Graham, 2008, 2011). Jiménez et al. (2011) studied the bright end of the CMR of galaxy clusters through a combination of cosmological N-body simulations of clusters of galaxies and a semi-analytic model of galaxy formation (Lagos et al., 2008). In these simulations, this break of the bright end of the CMR appears clearly as a consequence of galaxy evolution. The same effect can be noticed in CMRs of observed ETGs, for instance at the Hydra I cluster (Misgeld et al., 2008), the Virgo cluster (Ferrarese et al., 2006; Janz & Lisker, 2009), or a compilation from the SDSS (Skelton et al., 2009). As noted by Graham (2011), it was already detectable in the study of the Shapley 8 galaxy cluster by Metcalfe et al. (1994). In all of them there is a ‘break’ at the brighter magnitudes so that more massive ETGs show almost constant colours, though different authors give different interpretations. Jiménez et al. (2011) explain this behaviour as a consequence of the evolution of these bright galaxies since redshift being dominated by dry mergers, both minor and major. In this case, galaxies would move towards brighter magnitudes as they gain mass, while without gas no further star formation (and enrichment) is expected, so their colours remain almost invariable.
The absolute magnitude of this break for the Antlia cluster ( mag, see Fig. 3) is in agreement with the value obtained by Jiménez et al. (2011) for the simulated CMR in the same photometric system, displayed in their fig. 1. In the same figure it can also be seen that the CMR is composed by galaxies of increasing metallicity from the faint end to the bright end of the relation. This latter result also supports the idea that metallicity is the main responsible of the slope of the CMR.
Regarding the small scatter of the CMR (Bower et al., 1992; Terlevich et al., 2001; Smith Castelli et al., 2008), it is the consequence of the scatter in both variables: age and metallicity, being the age of the stellar population the prevailing one (e.g. Gallazzi et al., 2006). On the one hand, this suggests that the stellar population of ETGs has evolved passively since early times. On the other hand, as another possible explanation, the scatter measured with observations can be accounted for with models that predict a continuous migration of late–type galaxies to the CMR, due to different processes that stop their star formation (Ruhland et al., 2009).
5.2 On the structural relations
If we turn to the structural relations (Fig. 5, panels (a) to (e)), the two gE galaxies (NGC 3258 and NGC 3268) deserve a brief explanation in order to understand their loci in such plots. They are both classified as ‘core’ profile E galaxies (e.g. see Capetti & Balmaverde, 2005; Kharb et al., 2012, and references therein). Their profiles are characterized by a shallow inner cusp, which is attributed to a central deficit in luminosity with respect to the inward extrapolation of the best-fitting global Sérsic model. We cannot detect the cores because they extend up to the inner 1 arcsec and we fitted the surface brightness profiles excluding the inner 1 arcsec. Anyway, we take into account the fact that the two gE galaxies are in fact ‘core’ ones. These ‘core’ galaxies share other properties, like slow rotation and boxy isophotes, in contrast to the fainter Es with ‘power-law’ profiles. Thus, if the central surface brightness of a ‘core’ E galaxy is taken from the cusp, it will have a lower (fainter) value relative to the relation shown in panel (c) of Fig. 5 and will fall well below it. However, Jerjen & Binggeli (1997) and Graham & Guzmán (2003) noted that if is taken from the inner extrapolation of the global Sérsic model, it will share the same linear relation with the other ETGs. According to this, as the of the two Antlia gEs have been calculated in this latter way, they should not be outliers of these previous linear relations, within the scatter present in the data.
It was indicated above that the data depicted in panels 5(d) and 5(e) follow linear correlations, excepting four members: the two central gEs and the two cEs. Regarding these four outliers, several authors have argued about the existence of a dichotomy between ‘normal’ and dwarf ETGs in similar plots, meaning that data are placed along two different sequences (or linear relations) separated by a gap at (e.g. Kormendy et al., 2009; Kormendy & Bender, 2012, and references therein). According to this picture, gE and cE galaxies are located at the opposite ends of a sequence defined by the ‘normal’ elliptical galaxies, being the cEs at the position of the brightest and smallest , while the other sequence is mostly traced by the dEs. As reported in the Introduction, the existence of these two ‘branches’ is understood as an evidence that they are distinct species.
In our plots at the bottom row of Fig. 5, it is difficult to establish the existence of separate sequences for non–dwarf ETGs, mainly because in this magnitude range Antlia has S0 galaxies and very few ‘normal’ or bright Es. The gEs are clearly apart from the rest of ETGs, but an alternative scenario is suggested by Graham (2013, and references therein). Graham et al. show that mathematical links between the Sérsic parameters as well as the empirical linear relations at Figs. 5(a) and 5(b), can be used to derive curved relations for versus and versus , that extend from dwarfs to gEs (e.g., fig. 12 in Graham & Guzmán 2003, and fig. 2.8 in Graham 2013), without considering the cEs. Such curved relations are shown in Figs. 5(d) and 5(e) with dotted lines. In both plots, the loci of the two Antlia gEs are in very good agreement with the respective curved relations, while at the opposite side the curved relations match well with dEs. Both scaling relations seem to connect dwarf and giant ellipticals and, according to this latter approach, dwarfs appear to be the low-mass end of those sequences that unify the E galaxies. In this way, Es have a continuous range of concentrations, measured by the Sérsic shape index (Caon et al., 1993). On the other side, these curved functions do not seem to fit properly neither the lenticular (particularly for panel (d)), nor the cE galaxies. Galaxies of these two types were not included in the analysis of scaling relations performed by Graham (2013). However, Antlia S0s seem to fit nicely when data from other systems are included (see below).
It must be taken into account that we are fitting the brightness profiles of S0s and cEs with single Sérsic models. Furthermore, due to the few cEs and bright Es present in the Antlia cluster, we are unable to test the Kormendy et al. (2009) scenario with our present data.
It is interesting to note that the faintest Antlia galaxies, those that look alike the dSph ones in the Local Group, seem to extend almost all the scaling relations outlined in Fig. 5, towards lower luminosities and following the same trend as dEs. The only exception is the size, as can be seen in Fig. 5(e), where dSph candidates present smaller effective radii than the mean kpc ( kpc). This average was calculated for the dE galaxies () in the final sample. That dSphs have smaller radii than dEs has already been pointed out by Smith Castelli et al. (2012) for fewer faint Antlia galaxies and explained as a consequence of the limitations of the isophotal photometry. In this paper, we calculate ‘total’ integrated magnitudes and surface brightnesses for all galaxies, although some incompleteness is expected for galaxies fainter than mag. Anyway, smaller effective radii are expected for faint dwarfs, since any galaxy with an integrated magnitude will necessarily have a small ( kpc) effecive radius, unless its surface brightness be extremely (unphysically?) low. On the other hand, selection effects would prevent against the detection of any such galaxies; it can be shown that their isophotal radii would fall below our limiting radius (see Sect. 4.4).
A similar effect has been found for non-Antlia galaxies. For instance, using a data compilation of a variety of stellar systems, Graham (2013) presents a global analysis of sizes against stellar masses. It is visible in his fig. 2.1 that dE galaxies have half–light radii about 1 kpc, while dSphs show a decline in the sense that they have smaller radii as the stellar mass diminishes. A quite similar figure has recently been presented by Norris et al. (2014, their figs. 11 and 16). Another example of such a different trend between the sizes of dEs and dSphs is given by Forbes et al. (2008), in their fig 7 that shows half–light radius versus absolute magnitude for a different data set.
That dE galaxies seem to have an almost constant radius has already been pointed out for several clusters and groups (e.g. Smith Castelli et al., 2008, and references therein). Our is in agreement, among others, with that obtained by Misgeld et al. (2008) for the Hydra cluster, selecting galaxies fainter than . This tendency is followed by the curved relation shown in Fig. 5(e), as the effective radius tends to a constant value close to 1 kpc at the faint end.
De Rijcke et al. (2009) show the scaling relations of an ETG sample in different environments, including data of the Antlia cluster from our first study (Smith Castelli et al., 2008). Their and diagrams extend along a larger range in magnitude ( mag). The fits obtained in this paper for both correlations (Figures 5(a) and 5(b), Equations 6 and 7) reasonably agree within the magnitude range common to both samples. De Rijcke et al. remark that these scaling relations show a change of slope at mag, that may be due to different physical processes dominating the evolution of dEs and dSphs but, due to our completeness limit, we cannot refer to such low-luminosity range.
5.3 Comparison with other galaxy clusters
We took into consideration data from other galaxy clusters to better understand the two scaling relations depicted at the bottom row of Fig. 5, i.e. those that according to Graham (2013) can be represented with curved functions, and according to Kormendy et al. (2009) by two linear sequences with different slopes. In the seek of clarity, both graphs have been reproduced and enlarged in Fig. 7, adding the corresponding parameters of ETGs from several groups and clusters, like Fornax, Virgo, Coma, Hydra, and the NGC 5044 group. Symbols and the corresponding sources are identified in each panel. The curved relations are the ones obtained in the previous section using the Antlia data (Figs. 5(d) and 5(e)).
Fig. 7(a) shows that the Antlia ETG data follow the same trend as those from other systems, preserving a similar dispersion and in good agreement with the fainter end of the curved relation. The Antlia cEs share the same locus as other cEs and, as expected, they all have higher than ETGs of similar luminosities. The two Antlia gEs are located close to the bright end of the curved relation, as in fact it was calculated for Antlia, but most bright Es () from other systems have brighter and form a kind of parallel sequence above the curved function. On the one hand, the ETGs seem to be distributed in this plot along a single sequence that joins dwarfs, S0s, and normal/bright ellipticals, being the cEs the only ones that depart from it. On the other hand, the dispersion is quite different for ETGs brighter and fainter than and the existence of two different linear sequences cannot be discarded, particularly owing to the locus of the cE galaxies.
Due to the links between the different parameters derived from Sérsic models, a similar analysis applies to the size–luminosity relation presented in Fig. 7(b). Antlia ETGs share the same locus as equivalent galaxies from other clusters. The Antlia curved relation is roughly applicable to part of the ETGs, leaving out the cEs, which have smaller radii than ETGs of similar luminosity. The brightest Es at the large–size extreme and the dSphs at the opposite end, also fall below the curved relation. Once more, no ‘gaps’ are visible in this size–luminosity relation, but the existence of two linear sequences with different slopes cannot be dismissed now. In comparison with the plot in panel (a), more cEs have available data to be included in this graph (Chilingarian et al., 2009) and it looks much more likely that giant Es and cEs may fall on the same sequence, while the other sequence involves mainly the dEs.
Janz & Lisker (2008) performed a study of Virgo ETGs with homogeneus data from the Sloan Digital Sky Survey (SDSS) and concluded that giants and dwarfs do not form one single sequence in the size–luminosity relation. On the other side, Ferrarese et al. (2006) carried out an analysis of Virgo ETGs with homogeneus data obtained with the Advanced Camera for Surveys of the Hubble Space Telescope (ACS–HST) and gave support to the alternative scheme, though they suggested that dEs may be a diverse population with different origin and evolution.
With the aim of comparison and to fill empty regions in the KR diagram, we have added in Fig. 6 data from other clusters and groups, like in Fig. 7(b). The KR can be physically understood as a projection, on the surface photometry plane, of the fundamental plane (FP) of ETGs (Djorgovski & Davis, 1987). The FP links , , and , being the central velocity dispersion. It was originally derived for bright early-type galaxies, i.e. those with , but there seems to be no unique KR for bright and dwarf ETGs. For instance, D’Onofrio et al. (2008) studied the FP of a sample of more than 1500 ETGs and concluded that the coefficients of the FP, and accordingly those of the KR, depend on the absolute magnitude range of the galaxy sample. On the basis of ETGs in 16 nearby groups, Khosroshahi et al. (2004) show that the KRs followed by bright and dwarf ETGs are offset and have different slopes. It can be seen in their fig. 6 that the KR outlined by the dwarfs is aligned with the lines of constant absolute magnitude. De Rijcke et al. (2005) also show, through a kinematical study of a sample of dEs in groups and clusters, some structural differences between bright and dwarf ETGs considering different projections of the FP. For example, in the log Re - log Ie relation (their fig. 1d) different slopes can be seen for bright ellipticals and for dEs. The dE galaxies have Re close to 1 kpc, with a large scatter, while bright and intermediate luminosity Es show a linear relation with quite a different slope, in a similar way as the KR we have obtained. The authors note that the correlations the dEs follow (as the KR) are not as tight as in the case of the bright ellipticals, probably due to the higher sensitivity of the low-mass galaxies to internal and external procceses (supernova explosions, feedback efficiency, galactic winds, tidal stripping, ram-pressure stripping of gas, etc). In particular, the low-mass galaxies (dEs and dShps) lie above the FP defined by the bright elliptical galaxies of their sample.
Graham (2013) explains the original KR for just bright ETGs as: ‘a tangent to the bright arm of what is actually a curved distribution’. He also sustains that the different trend of the dwarfs in this relation, that maintain an almost constant radius, does not imply that different physical mechanisms are at work in bright and dwarf ETGs, but that they follow a continuous structural variation that depends on the shape of the brightness profiles with luminosity.
We are again faced to this dualism. The results deduced from the Antlia data seem to be more coincident with the Graham (2013, and references therein) proposal, i.e. the existence of unique relations with a continuous variation from bright to dwarf ETGs, but excluding the cEs. When we add data from other systems the situation is not clear. If the cEs are considered jointly with the bright ETGs, the evidence of the existence of two distinct families like in the scenario supported by Kormendy et al. (2009, and references therein) seems more appropriate.
6 Summary and Conclusions
We have presented the first large–scale analysis of the photometric and structural scaling relations followed by the early-type galaxy population of the Antlia cluster. These relations were built on the basis of surface photometry performed on MOSAIC II–CTIO images for 177 ETGs, being 44 per cent of them newly discovered ones. Out of this ETG sample, 53 galaxies are members confirmed through radial velocities, measured on new GMOS–GEMINI and VIMOS–VLT spectra, as well as obtained from the literature. The ETGs that lack spectra have high probability of being members due to the membership status 1 assigned by FS90 (‘definite’ members) and/or because their photometry places them within of the CMR (Fig. 3).
Total integrated magnitudes and colours in addition to accurate structural parameters were obtained, for every galaxy, by fitting single Sérsic models to the observed surface brightness profiles and integrating them to infinity. Based on them, we constructed the scaling relations for the Antlia cluster.
The colour–magnitude plane in the Washington photometric system shows that all ETGs follow a tight linear relation, spanning more than 10 mag. Almost all galaxies with spectroscopically confirmed membership lie within of the CMR, giving thus support to the cluster as an entity. A break at the bright end of the CMR is discernible, which is understood as a consequence that dry mergers dominate the formation of gE galaxies since (e.g. Jiménez et al., 2011).
Linear relations can be fitted to the Antlia ETGs in the planes and . Following the procedure explained by Graham (2013, and references therein), these linear relations plus the equations that link the Sérsic parameters, let us derive two curved functions that match most ETGs in the planes and . The two Antlia confirmed cE galaxies do not follow those curved relations. Most of the S0 galaxies are also outliers of the curved relation , too. Due to the few bright Es and cEs present in Antlia, it is not possible to compare whether two linear relations, with different slopes, can be fitted in these latter planes instead of the curved functions (Kormendy et al., 2009, and references therein). We remind that brightness profiles for the cE and S0 galaxies have been fitted with single Sérsic models.
When data from other clusters and groups are included in the planes and , bright Es and cEs fill in the almost empty regions. In these cases, like for the Kormendy relation, a match with two different linear relations for bright and dwarf ETGs is a valid option. The curved relations derived previously with just the Antlia data, provide a reasonable match if cEs are left aside, though the match for the brighter galaxies is offset.
We plan to continue our study of Antlia, extending our coverage to encompass the whole cluster, in order to build the scaling relations including the entire galaxy population. Clearly, a set of homogeneus data from which a careful derivation and fit of the observed brightness profile of every galaxy are obtained, is the unavoidable first step to settle which scenario is more appropriate to better explain the scaling relations. From this starting point, a deeper structural analysis of the different galaxy types, along with their stellar populations and spatial distribution is needed.
Acknowledgements
We thank the referee Dr. Thorsten Lisker for valuable comments that helped to improve this manuscript. This work was funded with grants from Consejo Nacional de Investigaciones Científicas y Técnicas de la República Argentina, Agencia Nacional de Promoción Científica y Tecnológica, and Universidad Nacional de La Plata (Argentina). JP Calderón, LPB and JP Caso are grateful to the Departamento de Astronomía de la Universidad de Concepción (Chile) for financial support and warm hospitality during part of this research. TR acknowledges financial support from FONDECYT project Nr. 1100620, and from the BASAL Centro de Astrofisica y Tecnologias Afines (CATA) PFB-06/2007. LPB and MG: Visiting astronomers, Cerro Tololo Inter-American Observatory, National Optical Astronomy Observatories, which are operated by the Association of Universities for Research in Astronomy, under contract with the National Science Foundation. The present paper is also based on observations made with ESO telescopes at the La Silla Paranal Observatory under programme ID 79.B-0480, and obtained at the Gemini Observatory, which is operated by the Association of Universities for Research in Astronomy, Inc., under a cooperative agreement with the NSF on behalf of the Gemini partnership: the National Science Foundation (United States), the National Research Council (Canada), CONICYT (Chile), the Australian Research Council (Australia), Ministério da Ciência, Tecnologia e Inovação (Brazil), and Ministerio de Ciencia, Tecnología e Innovación Productiva (Argentina).
References
- Andreon (1998) Andreon S., 1998, A&A, 336, 98
- Barazza et al. (2002) Barazza F. D., Binggeli B., Jerjen H., 2002, A&A, 391, 823
- Bender et al. (1992) Bender R., Burstein D., Faber S. M., 1992, ApJ, 399, 462
- Bernardi et al. (2007) Bernardi M., Hyde J. B., Sheth R. K., Miller C. J., Nichol R. C., 2007, AJ, 133, 1741
- Bernardi et al. (2011) Bernardi M., Roche N., Shankar F., Sheth R. K., 2011, MNRAS, 412, 684
- Binggeli & Jerjen (1998) Binggeli B., Jerjen H., 1998, A&A, 333, 17
- Binggeli et al. (1988) Binggeli B., Sandage A., Tammann G. A., 1988, ARA&A, 26, 509
- Bower et al. (1992) Bower R. G., Lucey J. R., Ellis R. S., 1992, MNRAS, 254, 601
- Buzzoni et al. (2012) Buzzoni A., Cellone S. A., Saracco P., Zucca E., 2012, MNRAS, 420, 3427
- Caon et al. (1993) Caon N., Capaccioli M., D’Onofrio M., 1993, MNRAS, 265, 1013
- Capetti & Balmaverde (2005) Capetti A., Balmaverde B., 2005, A&A, 440, 73
- Caso et al. (2014) Caso J. P., Bassino L. P., Richtler T., Calderón J. P., Smith Castelli A. V., 2014, MNRAS, 442, 891
- Caso et al. (2013) Caso J. P., Bassino L. P., Richtler T., Smith Castelli A. V., Faifer F. R., 2013, MNRAS, 430, 1088
- Chilingarian et al. (2009) Chilingarian I., Cayatte V., Revaz Y., Dodonov S., Durand D., Durret F., Micol A., Slezak E., 2009, Science, 326, 1379
- Ciotti (1991) Ciotti L., 1991, A&A, 249, 99
- Conselice (2008) Conselice C. J., 2008, in Knapen J. H., Mahoney T. J., Vazdekis A., eds, Astronomical Society of the Pacific Conference Series Vol. 390, Pathways Through an Eclectic Universe. p. 403
- Conselice et al. (2001) Conselice C. J., Gallagher III J. S., Wyse R. F. G., 2001, ApJ, 559, 791
- Davies & Phillipps (1988) Davies J. I., Phillipps S., 1988, MNRAS, 233, 553
- De Rijcke et al. (2003) De Rijcke S., Dejonghe H., Zeilinger W. W., Hau G. K. T., 2003, A&A, 400, 119
- De Rijcke et al. (2005) De Rijcke S., Michielsen D., Dejonghe H., Zeilinger W. W., Hau G. K. T., 2005, A&A, 438, 491
- De Rijcke et al. (2009) De Rijcke S., Penny S. J., Conselice C. J., Valcke S., Held E. V., 2009, MNRAS, 393, 798
- Dirsch et al. (2003) Dirsch B., Richtler T., Bassino L. P., 2003, A&A, 408, 929
- Djorgovski & Davis (1987) Djorgovski S., Davis M., 1987, ApJ, 313, 59
- D’Onofrio et al. (1994) D’Onofrio M., Capaccioli M., Caon N., 1994, MNRAS, 271, 523
- D’Onofrio et al. (2008) D’Onofrio M. et al., 2008, ApJ, 685, 875
- Eggen et al. (1962) Eggen O. J., Lynden-Bell D., Sandage A. R., 1962, ApJ, 136, 748
- Faber et al. (2007) Faber S. M. et al., 2007, ApJ, 665, 265
- Ferguson & Sandage (1990) Ferguson H. C., Sandage A., 1990, AJ, 100, 1
- Ferrarese et al. (2006) Ferrarese L. et al., 2006, ApJS, 164, 334
- Fisher & Drory (2008) Fisher D. B., Drory N., 2008, AJ, 136, 773
- Forbes et al. (2008) Forbes D. A., Lasky P., Graham A. W., Spitler L., 2008, MNRAS, 389, 1924
- Fukugita et al. (1995) Fukugita M., Shimasaku K., Ichikawa T., 1995, PASP, 107, 945
- Gallazzi et al. (2006) Gallazzi A., Charlot S., Brinchmann J., White S. D. M., 2006, MNRAS, 370, 1106
- Gavazzi et al. (2005) Gavazzi G., Donati A., Cucciati O., Sabatini S., Boselli A., Davies J., Zibetti S., 2005, A&A, 430, 411
- Geisler (1996) Geisler D., 1996, AJ, 111, 480
- Graham (2008) Graham A. W., 2008, ApJ, 680, 143
- Graham (2011) Graham A. W., 2011, in Koleva M., Prugniel P., Vauglin I., eds, EAS Publications Series Vol. 48, EAS Publications Series. pp 231–236
- Graham (2013) Graham A. W., 2013, Elliptical and Disk Galaxy Structure and Modern Scaling Laws. Planets, Stars and Stellar Systems. Volume 6: Extragalactic Astronomy and Cosmology, p. 91
- Graham & Guzmán (2003) Graham A. W., Guzmán R., 2003, AJ, 125, 2936
- Grebel et al. (2003) Grebel E. K., Gallagher III J. S., Harbeck D., 2003, AJ, 125, 1926
- Harris & Canterna (1977) Harris H. C., Canterna R., 1977, AJ, 82, 798
- Hawley et al. (2011) Hawley W., Machacek M., Kraft R. P., 2011, in AAS/High Energy Astrophysics Division. p. 39.03
- Jaffé et al. (2011) Jaffé Y. L., Aragón-Salamanca A., De Lucia G., Jablonka P., Rudnick G., Saglia R., Zaritsky D., 2011, MNRAS, 410, 280
- Janz et al. (2014) Janz J. et al., 2014, ApJ, 786, 105
- Janz & Lisker (2008) Janz J., Lisker T., 2008, ApJ, 689, L25
- Janz & Lisker (2009) Janz J., Lisker T., 2009, ApJ, 696, L102
- Jerjen & Binggeli (1997) Jerjen H., Binggeli B., 1997, in Arnaboldi M., Da Costa G. S., Saha P., eds, Astronomical Society of the Pacific Conference Series Vol. 116, The Nature of Elliptical Galaxies; 2nd Stromlo Symposium. p. 239
- Jiménez et al. (2011) Jiménez N., Cora S. A., Bassino L. P., Tecce T. E., Smith Castelli A. V., 2011, MNRAS, 417, 785
- Karachentseva et al. (2010) Karachentseva V. E., Karachentsev I. D., Sharina M. E., 2010, Astrophysics, 53, 462
- Kharb et al. (2012) Kharb P. et al., 2012, AJ, 143, 78
- Khosroshahi et al. (2004) Khosroshahi H. G., Raychaudhury S., Ponman T. J., Miles T. A., Forbes D. A., 2004, MNRAS, 349, 527
- Kormendy (1985) Kormendy J., 1985, ApJ, 295, 73
- Kormendy & Bender (2012) Kormendy J., Bender R., 2012, ApJS, 198, 2
- Kormendy et al. (2009) Kormendy J., Fisher D. B., Cornell M. E., Bender R., 2009, ApJS, 182, 216
- Lagos et al. (2008) Lagos C. D. P., Cora S. A., Padilla N. D., 2008, MNRAS, 388, 587
- Larson et al. (1980) Larson R. B., Tinsley B. M., Caldwell C. N., 1980, ApJ, 237, 692
- Leaman et al. (2013) Leaman R. et al., 2013, ApJ, 767, 131
- Lieder et al. (2012) Lieder S., Lisker T., Hilker M., Misgeld I., Durrell P., 2012, A&A, 538, A69
- Lisker et al. (2006) Lisker T., Glatt K., Westera P., Grebel E. K., 2006, AJ, 132, 2432
- Lisker et al. (2008) Lisker T., Grebel E. K., Binggeli B., 2008, AJ, 135, 380
- Mayer et al. (2001) Mayer L., Governato F., Colpi M., Moore B., Quinn T., Wadsley J., Stadel J., Lake G., 2001, ApJ, 559, 754
- McDonald et al. (2011) McDonald M., Courteau S., Tully R. B., Roediger J., 2011, MNRAS, 414, 2055
- Mei et al. (2012) Mei S. et al., 2012, in American Astronomical Society Meeting Abstracts 219. p. #411.06
- Metcalfe et al. (1994) Metcalfe N., Godwin J. G., Peach J. V., 1994, MNRAS, 267, 431
- Mieske et al. (2007) Mieske S., Hilker M., Infante L., Mendes de Oliveira C., 2007, A&A, 463, 503
- Misgeld et al. (2009) Misgeld I., Hilker M., Mieske S., 2009, A&A, 496, 683
- Misgeld et al. (2008) Misgeld I., Mieske S., Hilker M., 2008, A&A, 486, 697
- Moore et al. (1999) Moore B., Lake G., Quinn T., Stadel J., 1999, MNRAS, 304, 465
- Naab & Ostriker (2009) Naab T., Ostriker J. P., 2009, ApJ, 690, 1452
- Nakazawa et al. (2000) Nakazawa K., Makishima K., Fukazawa Y., Tamura T., 2000, PASJ, 52, 623
- Norris et al. (2014) Norris M. A. et al., 2014, MNRAS, 443, 1151
- Pedersen et al. (1997) Pedersen K., Yoshii Y., Sommer-Larsen J., 1997, ApJ, 485, L17
- Penny & Conselice (2008) Penny S. J., Conselice C. J., 2008, MNRAS, 383, 247
- Penny et al. (2011) Penny S. J., Conselice C. J., De Rijcke S., Held E. V., Gallagher J. S., O’Connell R. W., 2011, MNRAS, 410, 1076
- Penny et al. (2014) Penny S. J., Forbes D. A., Pimbblet K. A., Floyd D. J. E., 2014, MNRAS, 443, 3381
- Rieke & Lebofsky (1985) Rieke G. H., Lebofsky M. J., 1985, ApJ, 288, 618
- Ruhland et al. (2009) Ruhland C., Bell E. F., Häußler B., Taylor E. N., Barden M., McIntosh D. H., 2009, ApJ, 695, 1058
- Sánchez-Janssen et al. (2008) Sánchez-Janssen R., Aguerri J. A. L., Muñoz-Tuñón C., 2008, ApJ, 679, L77
- Schlafly & Finkbeiner (2011) Schlafly E. F., Finkbeiner D. P., 2011, ApJ, 737, 103
- Schombert (2013) Schombert J. M., 2013, PASA, 30, 34
- Schroyen et al. (2011) Schroyen J., De Rijcke S., Valcke S., Cloet-Osselaer A., Dejonghe H., 2011, MNRAS, 416, 601
- Secker et al. (1997) Secker J., Harris W. E., Plummer J. D., 1997, PASP, 109, 1377
- Sersic (1968) Sersic J. L., 1968, Atlas de galaxias australes. Cordoba, Argentina: Observatorio Astronomico, 1968
- Skelton et al. (2009) Skelton R. E., Bell E. F., Somerville R. S., 2009, ApJ, 699, L9
- Smith Castelli et al. (2008) Smith Castelli A. V., Bassino L. P., Richtler T., Cellone S. A., Aruta C., Infante L., 2008, MNRAS, 386, 2311
- Smith Castelli et al. (2012) Smith Castelli A. V., Cellone S. A., Faifer F. R., Bassino L. P., Richtler T., Romero G. A., Calderón J. P., Caso J. P., 2012, MNRAS, 419, 2472
- Terlevich et al. (2001) Terlevich A. I., Caldwell N., Bower R. G., 2001, MNRAS, 326, 1547
- Terlevich et al. (1999) Terlevich A. I., Kuntschner H., Bower R. G., Caldwell N., Sharples R. M., 1999, MNRAS, 310, 445
- Toloba et al. (2011) Toloba E., Boselli A., Cenarro A. J., Peletier R. F., Gorgas J., Gil de Paz A., Muñoz-Mateos J. C., 2011, A&A, 526, A114
- Toomre (1977) Toomre A., 1977, in Tinsley B. M., Larson D. Campbell R. B. G., eds, Evolution of Galaxies and Stellar Populations. p. 401
- Vaduvescu et al. (2014) Vaduvescu O., Kehrig C., Bassino L. P., Smith Castelli A. V., Calderón J. P., 2014, A&A, 563, A118
- White & Rees (1978) White S. D. M., Rees M. J., 1978, MNRAS, 183, 341
- Yoshii & Arimoto (1987) Yoshii Y., Arimoto N., 1987, A&A, 188, 13