Behaviour of oscillations in loop structures above active regions
Abstract
In this study we combine the multiwavelength ultraviolet – optical (Solar Dynamics Observatory, SDO) and radio (Nobeyama Radioheliograph, NoRH) observations to get further insight into space-frequency distribution of oscillations at different atmospheric levels of the Sun. We processed the observational data on NOAA 11711 active region and found oscillations propagating from the photospheric level through the transition region upward into the corona. The power maps of low-frequency (1–2 mHz) oscillations reproduce well the fan-like coronal structures visible in the Fe ix 171 Å line. High frequency oscillations (5–7 mHz) propagate along the vertical magnetic field lines and concentrate inside small-scale elements in the umbra and at the umbra-penumbra boundary. We investigated the dependence of the dominant oscillation frequency upon the distance from the sunspot barycentre to estimate inclination of magnetic tubes in higher levels of sunspots where it cannot be measured directly, and found that this angle is close to 40° above the umbra boundaries in the transition region.
keywords:
Sunspots, Oscillations; Faculae, Oscillations; Magnetic topology; Coronal loops1 Introduction
The waves in solar magnetic structures play an important role in processes of the energy exchange. Moreover, the properties of the medium, i.e. the solar atmosphere, can be determined by studying the wave propagation. This affects such problems as the origin of the solar magnetic fields, coronal heating, flares, wave propagation in plasma with different magnetic field topology, and others. From the observation driven point of view the problems above depend on our knowledge of the magnetic field distribution with height, plasma velocity, temperature and their variations. Because direct measurement of these parameters is a considerable challenge, in practice one has to use different tools to get a comprehensive picture of the atmosphere structure in active regions and processes therein. The seismological study of the active regions is one of such unique tools (Bogdan and Judge, 2006; De Moortel and Nakariakov, 2012). Different methods were developed to explore magnetic geometry of the sunspots and to estimate the magnetic field inclination angle in the transition region and in the corona (Jess et al., 2013; Yuan et al., 2014b; Kobanov et al., 2015). Coronal seismology provides a capability to determine the magnetic field strength in coronal closed magnetic structures (Nakariakov and Ofman, 2001). Another opportunity is radio magnetography (Gelfreikh, 2004). The radio emission is naturally connected with magnetic field providing an instrument to study the 3D-structure of the sunspot atmosphere. Joint observations in radio and optical spectral ranges have a great potential (Kislyakov et al., 2006), that has not been implemented yet. One can trace the wave train propagation and utilise magnetic field extrapolation to the corona to estimate the effective height of the radio emission, which can be used to qualify the formation heights of the lines in UV and optical spectral ranges. New facilities like the Siberian Solar Radio Telescope (SSRT, Lesovoi et al. 2012), the Chinese Spectral Radioheliograph (CSRH, Yan et al. 2013), and others will provide new possibilities for observing the Sun’s radio emission in the multifrequency mode.
Sunspot oscillations were extensively studied in the past decades (see reviews by Lites (1992); Solanki (2003); Bogdan and Judge (2006); Jess et al. (2015)). Recent studies are based on multiwavelength observations and focus on determining the wave propagation speed (Felipe et al., 2010; Abramov-Maximov et al., 2011; Kiddie et al., 2012; Chandra et al., 2015), wave dynamics (Sych et al., 2012; Sych and Nakariakov, 2014; Zhugzhda and Sych, 2014), and related phenomena like jets, penumbral filaments, umbral flashes (Yurchyshyn et al., 2014, 2015; Esteban Pozuelo et al., 2015; Madsen et al., 2015; Louis et al., 2014; Maurya et al., 2013), light bridges (Yuan et al., 2014a; Yang et al., 2015) and also flares (Sych et al., 2014). Due to the circular symmetry, sunspots provide an opportunity to study the wave propagation processes in the presence of magnetic fields. In sunspot umbra, five-minute oscillations dominate at the photospheric level, and three-minute ones prevail in the chromosphere (Kobanov, 1990; Kentischer and Mattig, 1995; Sigwarth and Mattig, 1997; Rouppe van der Voort et al., 2003; Kobanov et al., 2009; Reznikova and Shibasaki, 2012). Oscillations with longer periods (10–15 minutes) manifest themselves at the peripheral part of the sunspots. Other magnetic field regions, e.g. facula show very different behaviour of the spatial-frequency dependence (Kobanov and Pulyaev, 2007; Centeno et al., 2009). Detecting and studing the coronal counterparts of these waves and quasi-periodic pulsations are relevant for the problem of energy flux transfer to the upper atmosphere.
We continue studing the space-frequency stratification of the oscillation processes in the sunspot atmosphere (Kobanov et al., 2015). We extend the analysis with new sunspot data, including those obtained in radio emission, and compare the results with magnetic field extrapolation.
2 Observational Data and Methods
The paper is result of the investigation into the sunspot oscillations observed at different wavelengths representing several heights of the solar atmosphere from the photosphere to the corona. We used the data from two observatories in this study: Solar Dynamics Observatory (SDO, Lemen et al. (2012); Scherrer et al. (2012); Woods et al. (2012)) and Nobeyama Radioheliograph (NoRH, Nakajima et al. 1994). The data were selected to cover height scale from the photosphere to the corona.
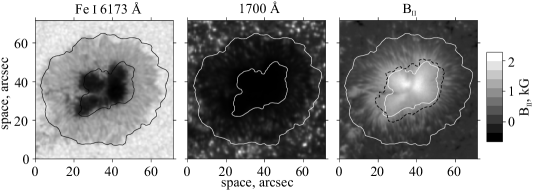
The sunspot had regular circular shape (Figure 1, left panel). The observation was performed on 2013 April 6 00:00–04:20 UT and there was no flare activity at this period; a C1.7 flare occurred on 10:58 UT.
We chose four spectral bands provided by the Atmospheric Imaging Assembly (AIA) for the analysis: Fe ix 171 Å and Fe xii, xxiv 193 Å (coronal heights), He ii 304 Å (transition region) and 1700 Å (upper photosphere, Figure 1, middle panel). The Helioseismic and Magnetic Imager (HMI) data were used to obtain the magnetic field at the photospheric level in the Fe i 6173 Å line, which is formed at the 100 – 150 km height (Fleck et al., 2011; Parnell and Beckers, 1969). The vector magnetic-field components were computed using the code of Very Fast Inversion of the Stokes Vector (Borrero et al., 2011). The SDO data sets were prepared using the aia_prep and hmi_prep SolarSoft routines. The sunspot was observed near the central meridian (W03S17), which allowed us to minimize the projection effect on the analysis of oscillations at different heights. We corrected the magnetic field angle to the solar normal within the planar approximation using equation (Gary and Hagyard, 1990):
| (1) |
where is the angle between the line of sight and the solar normal; is the observed field inclination angle; is the azimuthal angle corrected for the line-of-sight deviation from the central-meridian plane (Figure 1, right panel).
The radio data are the sequence of the 17 GHz NoRH images with the 20-second effective cadence and the 5′′ spatial resolution. The images were synthesised with the “Koshix” algorithm on the Solar Data Analysis System. To increase the signal-to-noise ratio, the number of integration frames for synthesis was set to 10. The images were cropped to include the sunspot area (′′). Then, the images were co-aligned using the cross-correlation technique and smoothed over spatial dimensions. The maximum brightness temperature in the sunspot does not exceed 29000 K and the degree of polarisation is about 25%. Thus, the polarised emission at 17 GHz in this image is most likely due to optically thin thermal bremsstrahlung. The line-of-sight magnetic field was estimated by the method proposed by Gelfreikh (2004).
To study space-height properties of the sunspot oscillations we used the method described in Kobanov et al. (2015) that is suitable for circular sunspots. To calculate the cut-off frequency, we used the equation (Bel and Leroy, 1977; McIntosh and Jefferies, 2006; Botha et al., 2011):
| (2) |
where is the cut-off frequency; =274 is the gravitational constant; is the speed of sound; is the adiabatic index; is the dependence of inclination angle on the barycenter distance. Using Equation 2 and empirical ratio 0.81F(r) mHz mHz for the 304 Å line (Yuan et al., 2014b) we estimate the magnetic-field inclination angle (Kobanov et al. (2015)):
| (3) |
The oscillations’ power spectrum was calculated using the Fast Fourier Transform (FFT). To remove trends from the data we subtracted the time series smoothed over a 25-minute time interval from the original series. The data set temporal resolution varies from 12 to 45 s for different instruments and bandpasses, which allows us to analyse frequencies up to 11 mHz — the Nyquist frequency for the HMI data; the Nyquist frequencies for the AIA data are 21 mHz (the 1700 Å band) and 42 mHz (the 304 Å and 171 Å bands), and that for the NoRH data is 25 mHz. To analyse the spatial distribution of the dominant frequencies, we obtain FFT power maps in the following way. FFT power spectra were calculated for every pixel ( arcsec2) of the SDO/AIA/HMI intensity images. The calculated Fourier spectra were smoothed by convolution with a rectangular window 1 mHz wide. The frequency corresponding to the power spectrum maximum value was taken as the dominant frequency for the particular spatial domain. To analyse wave trains and to measure their propagation speeds the frequency filtration was performed by the sixth-order Morlet wavelet. We used the algorithm described by Torrence and Compo (1998) to derive the FFT power spectra, to wavelet-filter the data and estimate the statistical significance. The normalisation by gives a measure of the power relative to the white noise level: 3 correspond to the 95% confidence level, and 4.6 — 99% confidence level ( is the variance of a time series).
The coronal magnetic field was calculated in the potential and nonlinear force-free (NLFF) approach, using SDO/HMI vector magnetograms as input data. To remove 180° ambiguity in the direction of filed component transversal to the line-of-sight we used the SFQ method by Rudenko and Anfinogentov (2014). The potential field was calculated using the method, described in Alissandrakis (1981) by applying FFT. The NLFF reconstruction was performed by using the optimization method, proposed by Wheatland et al. (2000). This method implementation by Rudenko and Myshyakov (2009) was used in the present study: we take into account a full set of the evolutionary equations and allow the field variations not only in the inner volume but also on the lateral and top boundaries of the computational domain.
3 Results
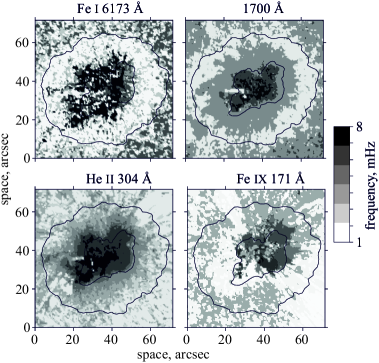
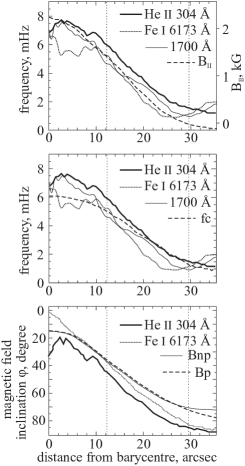
Figure 2 shows the spatial distribution of dominant frequencies in the sunspot at different heights from the photosphere to the corona. The black solid lines mark the inner and outer penumbra boundaries. Five-minute oscillations concentrate in an annular area, that expands beyond the umbra boundaries with increasing height. Low-frequency oscillations appear in the lower photosphere of the penumbra. Such a topology resembles the concept explaining running penumbral waves as upwardly propagating waves that form a “visual pattern” (Rouppe van der Voort et al., 2003; Bloomfield et al., 2007; Kobanov et al., 2009). Low-frequency oscillations occupy the larger area in the picture plane at higher coronal level visible in Fe ix 171 Å: the areas of dominant frequencies become elongated in the radial direction. Using the circular-shaped power distribution, one can plot frequency vs. distance from the barycentre for different height levels observed with AIA and HMI. Figure 3 presents a dominant frequency [] averaged over the pixels located at distance from the sunspot barycentre with a 0.6′′ step. The same averaging was used to obtain the longitudinal magnetic field [] and the absolute value of the magnetic-field inclination (Figure 3). We estimate the cut-off frequency (Figure 3, middle panel) and the magnetic-field inclination angle (Figure 3, bottom panel) by Equations 2 and 3. Using potential and nonlinear force-free magnetic field extrapolation data we produce vs. distance from barycentre plots for the 2200 km level. Both cases show a very similar dependence except for the outer penumbra (Figure 3, bottom panel). In the Figure 3 middle panel one can see a penumbra region, in which the dominant frequency curve (304 Å) follows the cut-off frequency curve. Earlier, Kuridze et al. (2009) showed that pressure impulses engendered in the photosphere can excite oscillations at the cut-off frequency. Consequently, the oscillations that coincide with the resonant frequencies of the cavities under the magnetic canopy amplify and can penetrate into the upper layers of the solar atmosphere (Srivastava et al., 2008).
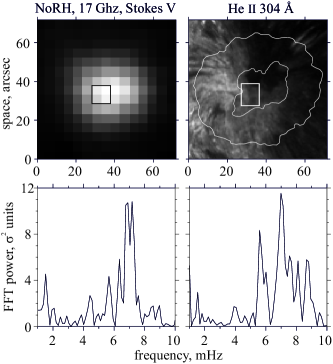
High-frequency waves of the 6 – 7 mHz band concentrate at the sunspot central umbral part at all heights and form fragmented domains on the power maps (Figure 4). The power maps were produced by using entire time series. The NoRH at 17 GHz observation clearly show three-minute band oscillations in Stokes V polarisation channel (Figure 5). For the optically thin radiation the line-of-sight magnetic field can be estimated according to Gelfreikh (2004) and is about 730 G. Extrapolation of the photospheric magnetic field to the upper atmosphere gives us the effective height of 2100–2200 km for the radio emission that corresponds to the transition region and the field strength of that value.
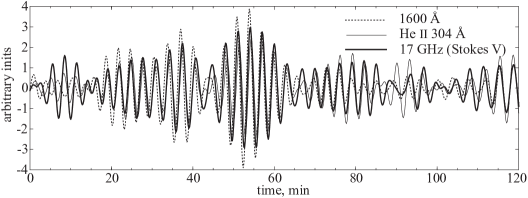
Intensity variations in the narrow band of 3 minute for the 1600 and 304 Å bands show a wave train structure that is typical of sunspots. Similar structures are present in the NoRH 17 GHz polarisation signal (Figure 6). The measured time delay of three-minute propagating waves (Figure 6) from the level of 1000–1300 km (1600 Å) to a height of 17 GHz emission gives a value of about 65 seconds, and 5 seconds from the level of 2200 km (304 Å) to a height of 17 GHz emission. We can conclude that the calculated height of radio emission generation agrees with height estimations for other spectral lines (Avrett and Loeser, 2008; Zhang et al., 1998) and with the analysis of characteristics of propagating three-minute waves (Reznikova et al., 2012; Kobanov et al., 2013).
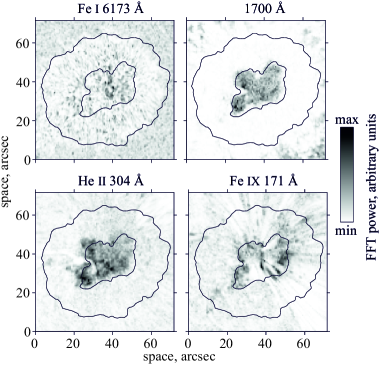
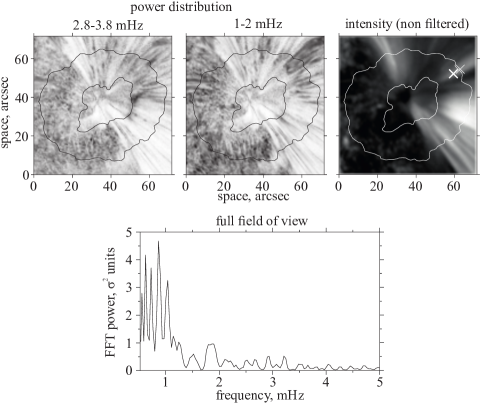
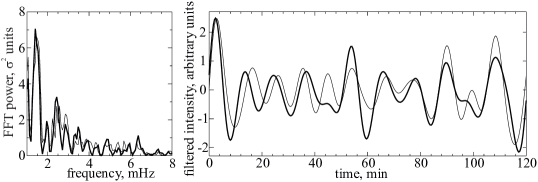
At the coronal heights, power maps reveal elongated structures that outline the coronal loops best at the 1–2 mHz filtration band (Figure 7). Similarly to the two sunspots analysed in Kobanov et al. (2015), the 1–2 mHz band oscillations can be traced along the loops to find the time delay and propagating speed. For this purpose we find two points along the loop having almost identical FFT spectra. These points are marked with crosses in Figure 7. Then using the amplitude vs. time plot (Figure 6), we estimate the apparent propagation speed that appears to be 45 km/s. The angle between the line of sight and the considered coronal fan was estimated from the magnetic field extrapolation and was found to be about 40°. Taking into account this value we find the deprojected wave propagation speed to be about 70 km/s. This value is lower than the expected sound speed in the corona. However, it is consistent with other measurements of the slow MHD wave propagation speed in coronal loops, ranging from 20 km/s to 190 km/s (See Table 2 in De Moortel (2009)). It is interesting to note that low-frequency oscillations of 1–2 mHz band in sunspots can be connected with Evershed flow’s pulsations (Rimmele, 1995; Kobanov and Makarchik, 2004). The study of such a possible connection would require sunspots located near the solar disc limb. Other possible scenarios can be related to the stochastic motion of coronal loops or the non-damping transverse oscillations (Nisticò et al., 2013; Anfinogentov et al., 2013).
4 Conclusions
The 5–7 mHz band high frequency oscillations concentrate inside small-scale elements in umbra and at the umbra-penumbra boundary. These kinds of oscillations show a well-known wave-train behaviour that also reveals itself in the NoRH Stokes V 17 GHz data. The wave trains observed in UV and radio coincide with a cross-correlation coefficient up to 0.75–0.92. The time delays for the 1600 Å, 304 Å and the NoRH signal agree with the previous results, obtained without radio data analysis, and indicate that the radio emission effective height is within the 2100–2200 km range which corresponds to the transition region and the magnetic field B730 G. This value agrees with one measured in He i 10830 Å line B600–1500 G, (Solanki et al., 2006) and is much higher than the estimated magnetic field at the coronal levels B10 G (Nakariakov and Ofman, 2001; Zaqarashvili et al., 2013). The estimation of the magnetic fields at higher coronal levels would be possible with availability of new high cadence and frequency radio data from SSRT and CSRH instruments.
The 1–2 mHz band low-frequency waves in NOAA 11711 reproduce the behaviour of NOAA 11479 and NOAA 11311 analysed by Kobanov et al. (2015): the power of these waves is concentrated in the annular zone around penumbra that expands with height. The estimated deprojected propagation speed of the wave train travelling along the single fan-loop is about 70 km/s.
The magnetic field inclination angle in the sunspot was estimated in two independent ways: from the observations of the dominant oscillations frequency and by using the magnetic field extrapolation. derived from HMI photospheric data is 35–40° for the umbra-penumbra boundary (12′′ from the sunspot centre), and corresponds to the field extrapolation results at the 2200 km level (Figure 3). is obtained from indirect measurements for He ii 304 Å line is 40–45°. The inclination estimation results fit in with the general structure of a sunspot and provide grounds for new research.
Acknowledgements
We acknowledge the NASA/SDO and NoRH science teams for providing the data. This work was partly done out on the Solar Data Analysis System operated by the Astronomy Data Center in cooperation with the Nobeyama Solar Radio Observatory of the National Astronomical Observatory of Japan. This study was supported by Projects No. 16.3.2, 16.3.3 of ISTP SB RAS, by the Russian Foundation for Basic Research under grants No. 12-02-33110 mol_a_ved, 15-32-20504 mol_a_ved, 15-02-03717-a, 15-02-01077-a, 15-02-01089-a, 13-02-00044-a, 15-02-03835-a. We are grateful to anonymous reviewers for their helpful remarks and suggestions. We acknowledge Y.M. Kaplunenko for his help in preparing the English version of the paper.
References
- Abramov-Maximov et al. (2011) Abramov-Maximov, V.E., Gelfreikh, G.B., Kobanov, N.I., Shibasaki, K., Chupin, S.A., 2011. Multilevel Analysis of Oscillation Motions in Active Regions of the Sun. Solar Phys. 270, 175–189. doi:10.1007/s11207-011-9716-7, arXiv:1102.1074.
- Alissandrakis (1981) Alissandrakis, C.E., 1981. On the computation of constant alpha force-free magnetic field. Astron. Astrophys. 100, 197--200.
- Anfinogentov et al. (2013) Anfinogentov, S., Nisticò, G., Nakariakov, V.M., 2013. Decay-less kink oscillations in coronal loops. Astron. Astrophys. 560, A107(6pp). doi:10.1051/0004-6361/201322094.
- Avrett and Loeser (2008) Avrett, E.H., Loeser, R., 2008. Models of the Solar Chromosphere and Transition Region from SUMER and HRTS Observations: Formation of the Extreme-Ultraviolet Spectrum of Hydrogen, Carbon, and Oxygen. ApJS 175, 229--276. doi:10.1086/523671.
- Bel and Leroy (1977) Bel, N., Leroy, B., 1977. Analytical Study of Magnetoacoustic Gravity Waves. Astron. Astrophys. 55, 239--243.
- Bloomfield et al. (2007) Bloomfield, D.S., Lagg, A., Solanki, S.K., 2007. The Nature of Running Penumbral Waves Revealed. Astrophys. J. 671, 1005--1012. doi:10.1086/523266, arXiv:0709.3731.
- Bogdan and Judge (2006) Bogdan, T.J., Judge, P.G., 2006. Observational aspects of sunspot oscillations. Royal Society of London Philosophical Transactions Series A 364, 313--331. doi:10.1098/rsta.2005.1701.
- Borrero et al. (2011) Borrero, J.M., Tomczyk, S., Kubo, M., Socas-Navarro, H., Schou, J., Couvidat, S., Bogart, R., 2011. VFISV: Very Fast Inversion of the Stokes Vector for the Helioseismic and Magnetic Imager. Solar Phys. 273, 267--293. doi:10.1007/s11207-010-9515-6, arXiv:0901.2702.
- Botha et al. (2011) Botha, G.J.J., Arber, T.D., Nakariakov, V.M., Zhugzhda, Y.D., 2011. Chromospheric Resonances above Sunspot Umbrae. Astrophys. J. 728, id84(7pp). doi:10.1088/0004-637X/728/2/84.
- Centeno et al. (2009) Centeno, R., Collados, M., Trujillo Bueno, J., 2009. Wave Propagation and Shock Formation in Different Magnetic Structures. Astrophys. J. 692, 1211--1220. doi:10.1088/0004-637X/692/2/1211, arXiv:0810.3613.
- Chandra et al. (2015) Chandra, R., Gupta, G.R., Mulay, S., Tripathi, D., 2015. Sunspot waves and triggering of homologous active region jets. Mon. Not. Roy. Astron. Soc. 446, 3741--3748. doi:10.1093/mnras/stu2305, arXiv:1410.8315.
- De Moortel (2009) De Moortel, I., 2009. Longitudinal Waves in Coronal Loops. Space Sci. Rev. 149, 65--81. doi:10.1007/s11214-009-9526-5.
- De Moortel and Nakariakov (2012) De Moortel, I., Nakariakov, V.M., 2012. Magnetohydrodynamic waves and coronal seismology: an overview of recent results. Royal Society of London Philosophical Transactions Series A 370, 3193--3216. doi:10.1098/rsta.2011.0640, arXiv:1202.1944.
- Esteban Pozuelo et al. (2015) Esteban Pozuelo, S., Bellot Rubio, L.R., de la Cruz Rodriguez, J., 2015. Lateral downflows in sunspot penumbral filaments and their temporal evolution. ArXiv e-prints arXiv:1502.02981.
- Felipe et al. (2010) Felipe, T., Khomenko, E., Collados, M., Beck, C., 2010. Multi-layer Study of Wave Propagation in Sunspots. Astrophys. J. 722, 131--144. doi:10.1088/0004-637X/722/1/131, arXiv:1008.4004.
- Fleck et al. (2011) Fleck, B., Couvidat, S., Straus, T., 2011. On the Formation Height of the SDO/HMI Fe 6173 Å Doppler Signal. Solar Phys. 271, 27--40. doi:10.1007/s11207-011-9783-9, arXiv:1104.5166.
- Gary and Hagyard (1990) Gary, G.A., Hagyard, M.J., 1990. Transformation of vector magnetograms and the problems associated with the effects of perspective and the azimuthal ambiguity. Solar Phys. 126, 21--36. doi:10.1007/BF00158295.
- Gelfreikh (2004) Gelfreikh, G.B., 2004. Coronal Magnetic Field Measurements Through Bremsstrahlung Emission, in: Gary, D.E., Keller, C.U. (Eds.), Astrophysics and Space Science Library, pp. 115--133. URL: http://dx.doi.org/10.1007/1-4020-2814-8_6, doi:10.1007/1-4020-2814-8_6.
- Jess et al. (2015) Jess, D.B., Morton, R.J., Verth, G., Fedun, V., Grant, S.D.T., Giagkiozis, I., 2015. Multiwavelength studies of MHD waves in the solar chromosphere: An overview of recent results. ArXiv e-prints arXiv:1503.01769.
- Jess et al. (2013) Jess, D.B., Reznikova, V.E., Van Doorsselaere, T., Keys, P.H., Mackay, D.H., 2013. The Influence of the Magnetic Field on Running Penumbral Waves in the Solar Chromosphere. Astrophys. J. 779, id168(11pp). doi:10.1088/0004-637X/779/2/168, arXiv:1310.7939.
- Kentischer and Mattig (1995) Kentischer, T.J., Mattig, W., 1995. Oscillations above sunspot umbrae. Astron. Astrophys. 300, 539--548.
- Kiddie et al. (2012) Kiddie, G., De Moortel, I., Del Zanna, G., McIntosh, S.W., Whittaker, I., 2012. Propagating Disturbances in Coronal Loops: A Detailed Analysis of Propagation Speeds. Solar Phys. 279, 427--452. doi:10.1007/s11207-012-0042-5, arXiv:1205.0891.
- Kislyakov et al. (2006) Kislyakov, A.G., Zaitsev, V.V., Stepanov, A.V., Urpo, S., 2006. On the Possible Connection between Photospheric 5-Min Oscillation and Solar Flare Microwave Emission. Solar Phys. 233, 89--106. doi:10.1007/s11207-006-2850-y.
- Kobanov et al. (2015) Kobanov, N., Kolobov, D., Chelpanov, A., 2015. Oscillations Above Sunspots and Faculae: Height Stratification and Relation to Coronal Fan Structure. Solar Phys. 290, 363--380. doi:10.1007/s11207-014-0623-6, arXiv:1411.6258.
- Kobanov (1990) Kobanov, N.I., 1990. On spatial characteristics of five-minute oscillations in the sunspot umbra. Solar Phys. 125, 25--30. doi:10.1007/BF00154775.
- Kobanov et al. (2013) Kobanov, N.I., Chelpanov, A.A., Kolobov, D.Y., 2013. Oscillations above sunspots from the temperature minimum to the corona. Astron. Astrophys. 554, A146(6pp). doi:10.1051/0004-6361/201220548, arXiv:1305.4718.
- Kobanov et al. (2009) Kobanov, N.I., Kolobov, D.Y., Sklyar, A.A., Chupin, S.A., Pulyaev, V.A., 2009. Characteristics of oscillatory-wave processes in solar structures with various magnetic field topology. Astron. Rep. 53, 957--967. doi:10.1134/S1063772909100072.
- Kobanov and Makarchik (2004) Kobanov, N.I., Makarchik, D.V., 2004. Pulsating Evershed Flows and Propagating Waves in a Sunspot. Astron. Rep. 48, 954--964. doi:10.1134/1.1822978.
- Kobanov and Pulyaev (2007) Kobanov, N.I., Pulyaev, V.A., 2007. Photospheric and Chromospheric Oscillations in Solar Faculae. Solar Phys. 246, 273--279. doi:10.1007/s11207-007-0391-7.
- Kuridze et al. (2009) Kuridze, D., Zaqarashvili, T.V., Shergelashvili, B.M., Poedts, S., 2009. Acoustic oscillations in the field-free, gravitationally stratified cavities under solar bipolar magnetic canopies. Astron. Astrophys. 505, 763--770. doi:10.1051/0004-6361/200811484, arXiv:0905.2302.
- Lemen et al. (2012) Lemen, J.R., Title, A.M., Akin, D.J., Boerner, P.F., Chou, C., Drake, J.F., Duncan, D.W., Edwards, C.G., Friedlaender, F.M., Heyman, G.F., Hurlburt, N.E., Katz, N.L., Kushner, G.D., Levay, M., Lindgren, R.W., Mathur, D.P., McFeaters, E.L., Mitchell, S., Rehse, R.A., Schrijver, C.J., Springer, L.A., Stern, R.A., Tarbell, T.D., Wuelser, J.P., Wolfson, C.J., Yanari, C., Bookbinder, J.A., Cheimets, P.N., Caldwell, D., Deluca, E.E., Gates, R., Golub, L., Park, S., Podgorski, W.A., Bush, R.I., Scherrer, P.H., Gummin, M.A., Smith, P., Auker, G., Jerram, P., Pool, P., Soufli, R., Windt, D.L., Beardsley, S., Clapp, M., Lang, J., Waltham, N., 2012. The Atmospheric Imaging Assembly (AIA) on the Solar Dynamics Observatory (SDO). Solar Phys. 275, 17--40. doi:10.1007/s11207-011-9776-8.
- Lesovoi et al. (2012) Lesovoi, S.V., Altyntsev, A.T., Ivanov, E.F., Gubin, A.V., 2012. The Multifrequency Siberian Radioheliograph. Solar Phys. 280, 651--661. doi:10.1007/s11207-012-0008-7, arXiv:1205.4794.
- Lites (1992) Lites, B.W., 1992. Sunspot oscillations - Observations and implications, in: Thomas, J.H., Weiss, N.O. (Eds.), NATO ASIC Proc. 375: Sunspots. Theory and Observations, pp. 261--302.
- Louis et al. (2014) Louis, R.E., Beck, C., Ichimoto, K., 2014. Small-scale chromospheric jets above a sunspot light bridge. Astron. Astrophys. 567, A96(8pp). doi:10.1051/0004-6361/201423756, arXiv:1406.0103.
- Madsen et al. (2015) Madsen, C.A., Tian, H., DeLuca, E.E., 2015. Observations of Umbral Flashes and Running Sunspot Waves with the Interface Region Imaging Spectrograph. Astrophys. J. 800, id129(10pp). doi:10.1088/0004-637X/800/2/129.
- Maurya et al. (2013) Maurya, R.A., Chae, J., Park, H., Yang, H., Song, D., Cho, K., 2013. Chromospheric Sunspot Oscillations in H and Ca ii 8542 Å. Solar Phys. 288, 73--88. doi:10.1007/s11207-013-0286-8.
- McIntosh and Jefferies (2006) McIntosh, S.W., Jefferies, S.M., 2006. Observing the Modification of the Acoustic Cutoff Frequency by Field Inclination Angle. Astrophys. J. Lett. 647, L77--L81. doi:10.1086/507425.
- Nakajima et al. (1994) Nakajima, H., Nishio, M., Enome, S., Shibasaki, K., Takano, T., Hanaoka, Y., Torii, C., Sekiguchi, H., Bushimata, T., Kawashima, S., Shinohara, N., Irimajiri, Y., Koshiishi, H., Kosugi, T., Shiomi, Y., Sawa, M., Kai, K., 1994. The Nobeyama radioheliograph. IEEE Proceedings 82, 705--713.
- Nakariakov and Ofman (2001) Nakariakov, V.M., Ofman, L., 2001. Determination of the coronal magnetic field by coronal loop oscillations. Astron. Astrophys. 372, L53--L56. doi:10.1051/0004-6361:20010607.
- Nisticò et al. (2013) Nisticò, G., Nakariakov, V.M., Verwichte, E., 2013. Decaying and decayless transverse oscillations of a coronal loop. Astron. Astrophys. 552, A57(6pp). doi:10.1051/0004-6361/201220676.
- Parnell and Beckers (1969) Parnell, R.L., Beckers, J.M., 1969. The Interpretation of Velocity Filtergrams. I: The Effective Depth of Line Formation. Solar Phys. 9, 35--38. doi:10.1007/BF00145725.
- Reznikova and Shibasaki (2012) Reznikova, V.E., Shibasaki, K., 2012. Spatial Structure of Sunspot Oscillations Observed with SDO/AIA. Astrophys. J. 756, id35(10pp). doi:10.1088/0004-637X/756/1/35.
- Reznikova et al. (2012) Reznikova, V.E., Shibasaki, K., Sych, R.A., Nakariakov, V.M., 2012. Three-minute Oscillations above Sunspot Umbra Observed with the Solar Dynamics Observatory/Atmospheric Imaging Assembly and Nobeyama Radioheliograph. Astrophys. J. 746, id119(10pp). doi:10.1088/0004-637X/746/2/119, arXiv:1109.5434.
- Rimmele (1995) Rimmele, T.R., 1995. Sun center observations of the Evershed effect. Astrophys. J. 445, 511--516. doi:10.1086/175716.
- Rouppe van der Voort et al. (2003) Rouppe van der Voort, L.H.M., Rutten, R.J., Sütterlin, P., Sloover, P.J., Krijger, J.M., 2003. La Palma observations of umbral flashes. Astron. Astrophys. 403, 277--285. doi:10.1051/0004-6361:20030237.
- Rudenko and Anfinogentov (2014) Rudenko, G.V., Anfinogentov, S.A., 2014. Very Fast and Accurate Azimuth Disambiguation of Vector Magnetograms. Solar Phys. 289, 1499--1516. doi:10.1007/s11207-013-0437-y.
- Rudenko and Myshyakov (2009) Rudenko, G.V., Myshyakov, I.I., 2009. Analysis of Reconstruction Methods for Nonlinear Force-Free Fields. Solar Phys. 257, 287--304. doi:10.1007/s11207-009-9389-7.
- Scherrer et al. (2012) Scherrer, P.H., Schou, J., Bush, R.I., Kosovichev, A.G., Bogart, R.S., Hoeksema, J.T., Liu, Y., Duvall, T.L., Zhao, J., Title, A.M., Schrijver, C.J., Tarbell, T.D., Tomczyk, S., 2012. The Helioseismic and Magnetic Imager (HMI) Investigation for the Solar Dynamics Observatory (SDO). Solar Phys. 275, 207--227. doi:10.1007/s11207-011-9834-2.
- Sigwarth and Mattig (1997) Sigwarth, M., Mattig, W., 1997. Velocity and intensity oscillations in sunspot penumbrae. Astron. Astrophys. 324, 743--749.
- Solanki (2003) Solanki, S.K., 2003. Sunspots: An overview. Astron. Astrophys. Rev. 11, 153--286. doi:10.1007/s00159-003-0018-4.
- Solanki et al. (2006) Solanki, S.K., Lagg, A., Aznar Cuadrado, R., Orozco Suárez, D., Collados, M., Wiegelmann, T., Woch, J., Sasso, C., Krupp, N., 2006. Measuring the Magnetic Vector with the He I 10830 Å Line: A Rich New World, in: Casini, R., Lites, B.W. (Eds.), Astronomical Society of the Pacific Conference Series, pp. 431--436.
- Srivastava et al. (2008) Srivastava, A.K., Zaqarashvili, T.V., Uddin, W., Dwivedi, B.N., Kumar, P., 2008. Observation of multiple sausage oscillations in cool post-flare loop. Mon. Not. Roy. Astron. Soc. 388, 1899--1903. doi:10.1111/j.1365-2966.2008.13532.x, arXiv:0806.0897.
- Sych et al. (2014) Sych, R., Karlický, M., Altyntsev, A., Dudík, J., Kashapova, L., 2014. Sunspot waves and flare energy release. ArXiv e-prints doi:10.1051/0004-6361/201424834, arXiv:1409.2947.
- Sych and Nakariakov (2014) Sych, R.A., Nakariakov, V.M., 2014. Wave dynamics in a sunspot umbra. Astron. Astrophys. 569, A72(8pp). doi:10.1051/0004-6361/201424049, arXiv:1409.4530.
- Sych et al. (2012) Sych, R.A., Zaqarashvili, T.V., Nakariakov, V.M., Anfinogentov, S.A., Shibasaki, K., Yan, Y., 2012. Frequency drifts of 3-min oscillations in microwave and EUV emission above sunspots. Astron. Astrophys. 539, A23(10pp). doi:10.1051/0004-6361/201118271, arXiv:1110.2556.
- Torrence and Compo (1998) Torrence, C., Compo, G.P., 1998. A Practical Guide to Wavelet Analysis. Bull. Am. Meteo. Soc. 79, 61--78. doi:10.1175/1520-0477(1998)079<0061:APGTWA>2.0.CO;2.
- Wheatland et al. (2000) Wheatland, M.S., Sturrock, P.A., Roumeliotis, G., 2000. An Optimization Approach to Reconstructing Force-free Fields. Astrophys. J. 540, 1150--1155. doi:10.1086/309355.
- Woods et al. (2012) Woods, T.N., Eparvier, F.G., Hock, R., Jones, A.R., Woodraska, D., Judge, D., Didkovsky, L., Lean, J., Mariska, J., Warren, H., McMullin, D., Chamberlin, P., Berthiaume, G., Bailey, S., Fuller-Rowell, T., Sojka, J., Tobiska, W.K., Viereck, R., 2012. Extreme Ultraviolet Variability Experiment (EVE) on the Solar Dynamics Observatory (SDO): Overview of Science Objectives, Instrument Design, Data Products, and Model Developments. Solar Phys. 275, 115--143. doi:10.1007/s11207-009-9487-6.
- Yan et al. (2013) Yan, Y., Wang, W., Liu, F., Geng, L., Chen, Z., Zhang, J., 2013. Radio imaging-spectroscopy observations of the Sun in decimetric and centimetric wavelengths, in: Kosovichev, A.G., de Gouveia Dal Pino, E., Yan, Y. (Eds.), IAU Symposium, pp. 489--494. doi:10.1017/S1743921313003001.
- Yang et al. (2015) Yang, S., Zhang, J., Jiang, F., Xiang, Y., 2015. Oscillating light wall above a sunspot light bridge. ArXiv e-prints arXiv:1504.03563.
- Yuan et al. (2014a) Yuan, D., Nakariakov, V.M., Huang, Z., Li, B., Su, J., Yan, Y., Tan, B., 2014a. Oscillations in a Sunspot with Light Bridges. Astrophys. J. 792, 41. doi:10.1088/0004-637X/792/1/41, arXiv:1407.1544.
- Yuan et al. (2014b) Yuan, D., Sych, R., Reznikova, V.E., Nakariakov, V.M., 2014b. Multi-height observations of magnetoacoustic cut-off frequency in a sunspot atmosphere. Astron. Astrophys. 561, A19(6pp). doi:10.1051/0004-6361/201220208.
- Yurchyshyn et al. (2015) Yurchyshyn, V., Abramenko, V., Kilcik, A., 2015. Dynamics in Sunspot Umbra as Seen in New Solar Telescope and Interface Region Imaging Spectrograph Data. Astrophys. J. 798, id136(9pp). doi:10.1088/0004-637X/798/2/136, arXiv:1411.0192.
- Yurchyshyn et al. (2014) Yurchyshyn, V., Abramenko, V., Kosovichev, A., Goode, P., 2014. High Resolution Observations of Chromospheric Jets in Sunspot Umbra. Astrophys. J. 787, id58(7pp). doi:10.1088/0004-637X/787/1/58, arXiv:1404.7444.
- Zaqarashvili et al. (2013) Zaqarashvili, T.V., Melnik, V.N., Brazhenko, A.I., Panchenko, M., Konovalenko, A.A., Franzuzenko, A.V., Dorovskyy, V.V., Rucker, H.O., 2013. Radio seismology of the outer solar corona. Astron. Astrophys. 555, A55(12pp). doi:10.1051/0004-6361/201321548, arXiv:1305.2287.
- Zhang et al. (1998) Zhang, J., White, S.M., Kundu, M.R., 1998. The Height Structure of the Solar Atmosphere from the Extreme-Ultraviolet Perspective. ApJL 504, L127--L130. doi:10.1086/311587, arXiv:astro-ph/9807175.
- Zhugzhda and Sych (2014) Zhugzhda, Y.D., Sych, R.A., 2014. Model of local oscillations in sunspots. Astronomy Letters 40, 576--593. doi:10.1134/S1063773714090059.