Divacancy superstructures in thermoelectric calcium-doped sodium cobaltate
Abstract
We have grown single crystals of NaxCayCoO2 and determined their superstructures as a function of composition using neutron and x-ray diffraction. Inclusion of Ca2+ stabilises a single superstructure across a wide range of temperatures and concentrations. The superstructure in the Na+ layers is based on arrays of divacancy clusters with Ca2+ ions occupying the central site, and it has an ideal concentration Na4/7Ca1/7CoO2. Previous measurements of the thermoelectric properties on this system are discussed in light of this superstructure. Na4/7Ca1/7CoO2 corresponds to the maximum in thermoelectric performance of this system.
pacs:
61.05.cp, 61.05.fm, 61.66.Fn, 61.72.jd, 68.65.CdI Introduction
Sodium cobaltate (NaxCoO2) has emerged as a material of exceptional scientific and technological interest due to its potential for thermoelectric applications that convert waste heat into electricity or allow solid state refrigerationTerasaki et al. (1997); Wang et al. (2003); Foo et al. (2004); Lee et al. (2006). In NaxCoO2, the removal of sodium ions creates holes in the cobalt layers. The Seebeck coefficient and power factor both increase with , as the concentration of holes decreasesLee et al. (2006). Above a concentration of , however, phase coexistence occurs with the insulating phase, causing a reduction in the power factor. The substitution of a divalent ion for sodium decreases by one the number of holes in the cobalt layer. This offers the possibility to lower the hole concentration and enhance further the thermoelectric performance. There are already promising results on polycrystalline samples doped with Ca and Sr, with an increase in the power factor over the comparable pure compoundKawata et al. (1999); Ono et al. (2004); Li et al. (2006).
Neutron diffraction studies have demonstrated the central role played by superstructure on the thermoelectric properties of NaxCoO2 Roger et al. (2007); Morris et al. (2009). The structure of NaxCoO2 comprises layers of conducting cobalt-oxygen octahedra separated by layers of sodium ions. The sodium ions can sit on one of two inequivalent sites; Na sites directly between successive cobalt ions, or displaced from these position on Na sites. The sites are preferentially occupied due to a small energy cost for sitting directly above cobalt arising from short-range repulsion. Vacancies in the sodium layer have been found to form multi-vacancy clusters at certain fractional concentrations. These clusters form by promoting sodium ions onto the sites, creating rattling cages that can reduce thermal conduction through the materialVoneshen et al. (2013). Coulomb interactions cause the vacancy clusters to arrange themselves into long range patterns, causing rings of superlattice peaks in diffraction images.
The electrostatic potential generated by these superlattices templates the Coulomb landscape in the cobalt-oxygen layer, generating confined electronic pathways in the layersRoger et al. (2007). The combination of electron confinement and rattling cage-ions creates an ideal environment for the thermoelectric effect.
Here we present the results of an x-ray and neutron diffraction study of superstructures in Ca-doped NaxCoO2. We show that the Ca stabilises a single superstructure over a wide range of temperature and composition, and we use the results to gain an understanding of how Ca-doping affects the thermoelectric properties.
II Methods
Single crystal boules of various compositions of NaxCayCoO2 were grown using the floating zone technique Prabhakaran et al. (2004); Prabhakaran and Boothroyd (2011). Small, high quality crystallites were cleaved from the boules and studied using x-ray diffraction with a molybdenum source, Xcalibur diffractometer (Agilent instruments) at Royal Holloway. A Cryojet5 (Oxford Instruments) was used for temperature control and precise temperatures were calibrated by replacing the sample with a thermistor of similar size. A large, single grain of Na0.7Ca0.1CoO2 was cleaved from its boule and studied using neutron diffraction on SXD Keen et al. (2006) at ISIS.
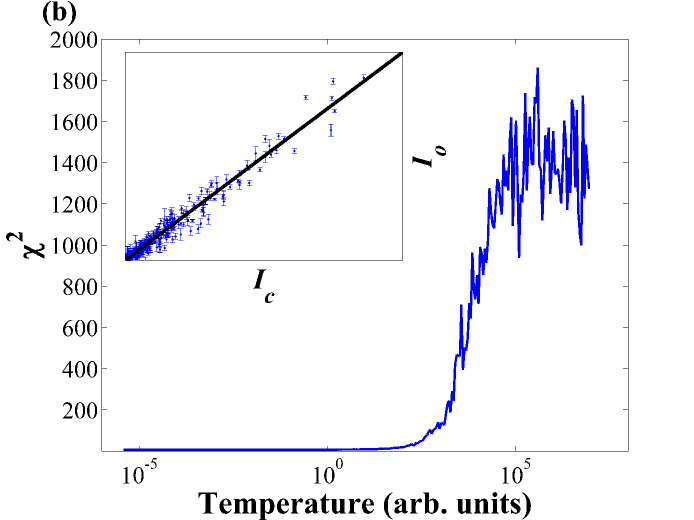
The hexagonal reflections from the diffraction experiments were integrated using standard instrument methods, and properties of the average structure were refined using the program Jana2006Dusek et al. (2001). A reverse Monte Carlo (RMC) program was written to determine the vacancy ordering within the sodium layer and to establish the position of calcium ions. RMC uses simulated annealing to minimise the chi-squared difference between the calculated intensities arising from a given set of atomic positions in the unit cell, and the experimental data. The positions of Ca and Na ions are changed with respect to the Co lattice, using the Metropolis algorithm in the Canonical ensemble. Small displacements of all atoms, with respect to their original positions, are also allowed. When the fictitious temperature is slowly decreased, the configuration corresponding to the absolute minimum of this chi-square difference can be reached. Further details on this method can be found in Refs. [McGreevy (2001); Porter (2012)].
III Diffraction Experiments
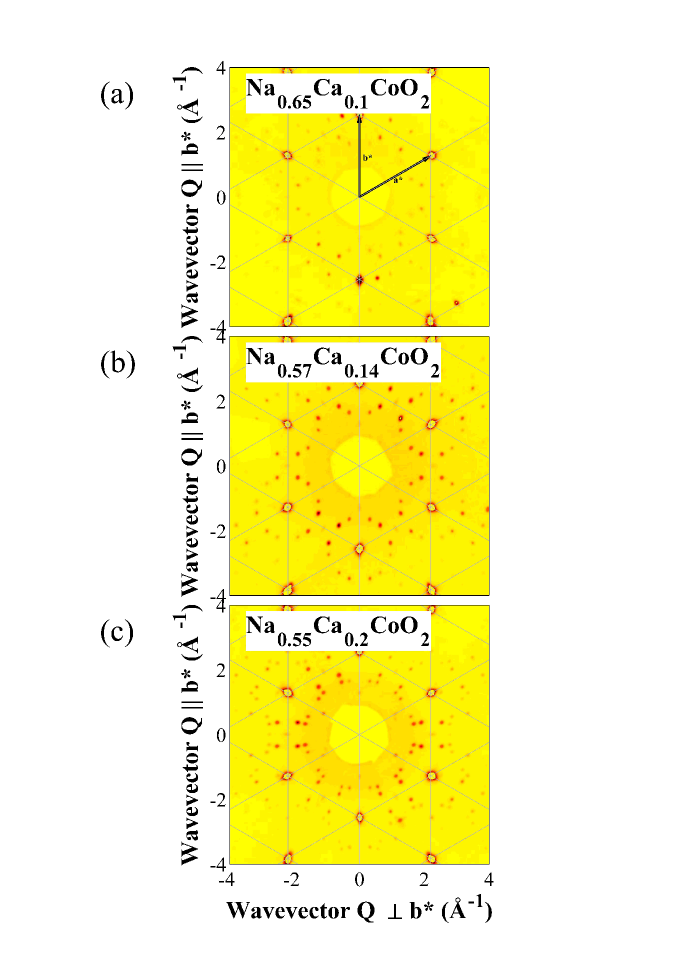
Three compositions of the calcium doped system were grown using the floating zone technique: Na0.65Ca0.1CoO2, Na0.57Ca0.14CoO2 and Na0.55Ca0.2CoO2. The samples were grown as large 4–6 cm boules which were cleaved to find small, high quality crystallites. These were screened with the x-ray diffractometer and high quality samples were measured with longer exposures and greater coverage at several temperatures. Figure 1 shows reciprocal space cuts in the plane from a single-crystal sample of each composition. All three samples exhibit rings of 12 satellite reflections around the principal hexagonal Bragg peaks. These additional peaks lay on the vertices of a hexagonal grid with spacing and can be indexed using a supercell with lattice vectors:
These supercell vectors index one of the two possible superlattice domains, where the second domain can be generated by a reflection in either the or . The intensities of the superlattice reflections indicate equal populations of these domains. No broadening of the peaks was detected within instrumental resolution and, therefore, the superstructures were found to be ordered long range. The positions of these superlattice peaks are not consistent with any of the diffraction patterns observed previously in pure NaxCoO2, signifying that a new superstructure has been found. All three samples have additional reflections halfway between the largest Bragg reflections due to contamination by , in addition to this the Na0.55Ca0.2CoO2 sample displays further reflections between the primary satellites. These additional reflections lay at the vertices of an hexagonal grid and can be indexed by a supercell with lattice vectors:
These propagation vectors were first observed for Na0.5CoO2 Huang et al. (2004), implying a coexistence between the Na0.5CoO2 superstructure and the new superstructure.
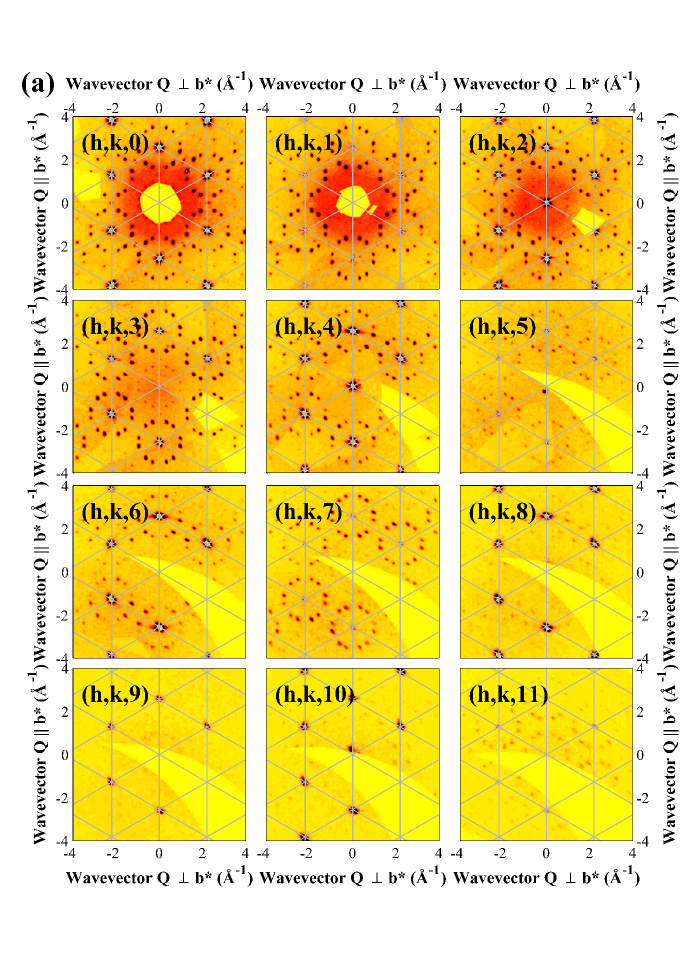
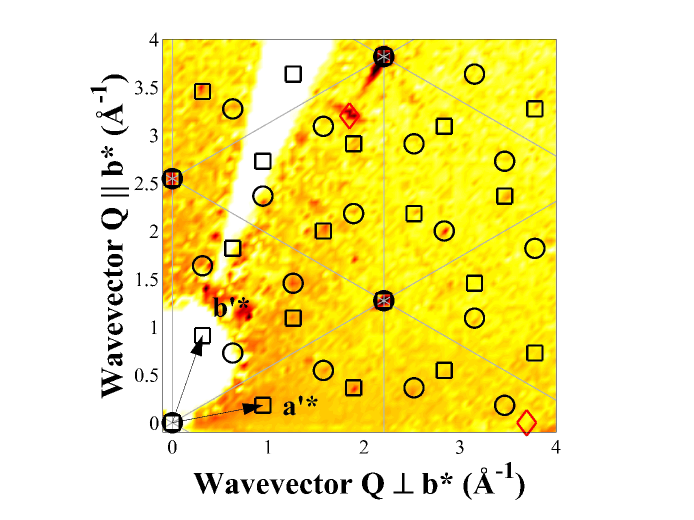
The intensities of the satellite peaks vary significantly for different planes as shown in Fig. 2. Satellites occur primarily in 12-fold rings around the reflections, with the modulation of peak intensity within the rings varying between even and odd planes. At high , the peak intensity is diminished due to the x-ray form factor, however peaks can still be observed and show that satellites around the reflections gain intensity, especially in the plane. The increased satellite intensity and reduced intensity in the principal reflections in the plane is particularly striking and it is related to the fact that the -lattice parameter is approximately 11 times the distance between the cobalt and oxygen planes.
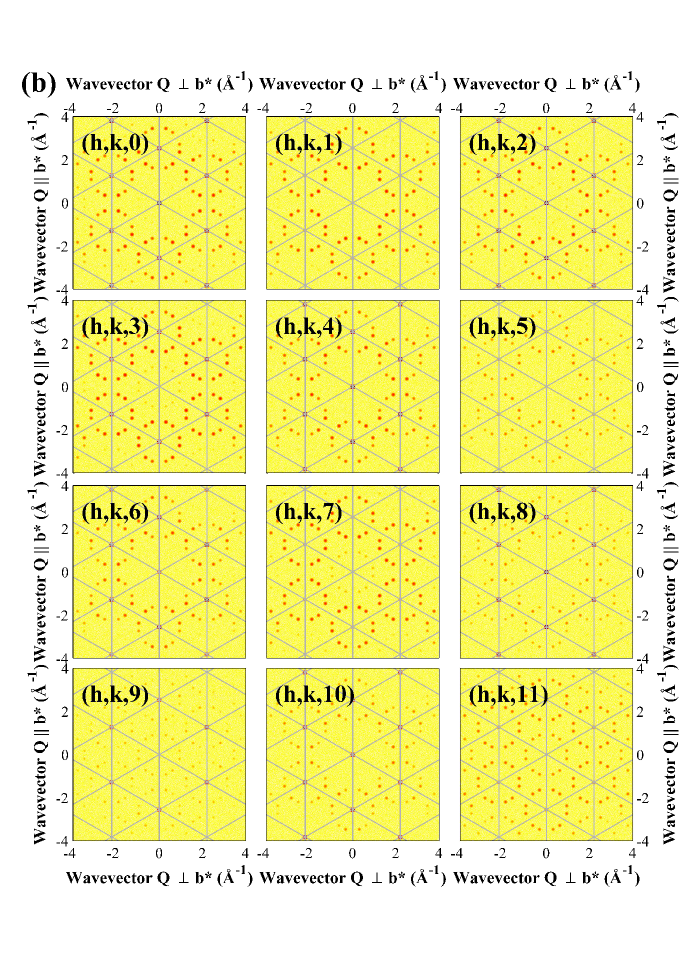
The diffraction patterns were measured as a function of temperature between 90 and 460 K. It was found that the satellite peaks do not change below room temperature, though they do eventually disappear at high temperature, as illustrated in Fig. 3. The disappearance of the satellite peaks is attributed to the sodium layers becoming disordered. We did not observe any variation of the peak widths in this temperature range within our experimental resolution. The ordering temperature increases as the calcium concentration increases, and the order parameter indicates a sharper transition for the sample. The peaks did not vary at all within this temperature range.
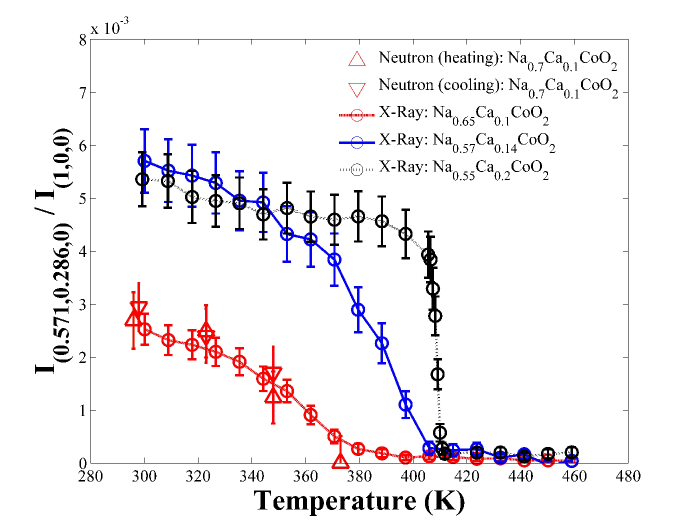
The peak intensities in Fig. 3 are normalised against the intensity of a nearby principal hexagonal reflection in each case. The Na0.65Ca0.1CoO2 intensity is much weaker than the other compositions and it has a lower disorder temperature, with a fitted order parameter giving . There is little difference between the initial intensity or the disorder temperature of Na0.57Ca0.14CoO2 and Na0.55Ca0.2CoO2, with and respectively. This suggests that the satellites in both samples originate from a phase with a common calcium composition. The additional calcium in the Na0.55Ca0.2CoO2 sample is, therefore, likely to be part of the coexisting phase.
A boule of Na0.7Ca0.1CoO2 was screened on SXD. A large single grain with intense, sharp principal Bragg peaks was cleaved from the boule and longer exposures of several hours were taken at 350K and 40K. It was not possible to grow large enough single grains for neutron diffraction studies of the superstructures with higher calcium concentrations.
Superlattice peaks can be distinguished in the data by their intensities having hexagonal symmetry. Satellite peaks were observed with the same propagation vectors used to index the superlattice observed with x-rays, indicating that this phase forms in the bulk material, as shown in Fig. 4. Several shorter exposures were performed at increasing temperatures and the disorder transition observed was consistent with the Na0.65Ca0.1CoO2 measurement performed with x-rays, see Fig. 3. The superlattice pattern did not change as a function of temperature, indicating a single phase below the ordering transition temperature.
In addition to the satellites, further peaks were observed close to the principal hexagonal reflections. The d-spacing of these peaks was Å, which matches the reflection of calcium oxide (CaO). By comparing the integrated intensities for several reflections with calculated structure factors, and averaging over domains, the relative proportion of CaO in Na0.7Ca0.1CoO2 was determined to be 0.8% with a statistical error of 0.2%. For this system to produce a hexagonal pattern of points as found in these results, the cubic direction of the CaO crystal would have to be parallel to the hexagonal of Na0.7Ca0.1CoO2, and the cubic direction of CaO would be parallel to the hexagonal of Na0.7Ca0.1CoO2. In this direction the CaO structure can be described as successive hexagonal layers of calcium and oxygen ions with an ABC stacking sequence. The hexagonal environment of the main phase allows the CaO impurity to grow epitaxially within the Na0.7Ca0.1CoO2 boule.
IV Single Crystal Refinements
The principal hexagonal reflections in the multi-composition x-ray datasets were integrated using the three-dimensional (3D) profile method. The results of the refinements, as recorded in Table 1, show that the sodium occupancies are consistently lower than the nominal values. The calcium occupancies are much closer to the nominal values however, which is consistent with loss of the more volatile sodium ions during growth. For Na0.57Ca0.14CoO2 the fitted Ca occupancy agrees with the nominal composition for the proposed Na4/7Ca1/7CoO2 superstructure. This is consistent with the lack of any observed coexisting phases in this sample.
| Occupancy | |||||||||
|---|---|---|---|---|---|---|---|---|---|
| Target Composition | a (Å) | c (Å) | Na | Ca | Na | Ca | Co | O | |
| Na0.65Ca0.1CoO2 | 2.8398(6) | 10.746(2) | 0.56(1) | 0.12(1) | 0.019(2) | 0.013(6) | 0.0066(5) | 0.006(1) | 7.84% |
| Na0.57Ca0.14CoO2 | 2.8403(4) | 10.756(1) | 0.529(5) | 0.138(5) | 0.010(1) | 0.005(2) | 0.0049(3) | 0.0058(6) | 3.96% |
| Na0.55Ca0.2CoO2 | 2.8362(4) | 10.761(2) | 0.516(7) | 0.172(9) | 0.013(1) | 0.014(3) | 0.0062(4) | 0.0050(7) | 7.39% |
The thermal parameters were refined as isotropic spheres. The data in Table 1 are consistent with increased static disorder away from the optimum composition. The ADPs for the sodium ions on the sites are comparable to those obtained for the pure systemVoneshen et al. (2013), whereas those of the divalent calcium ions on the sites are significantly lower. A full discussion of ADPs in terms of the lattice vibrations is beyond the scope of the present paper.
The R-factors for these refinements show that there is excellent agreement between the refined models and the experimental data. Other refinements were attempted that changed the assumption that Ca ions occupy sites and Na ions sit on sites. These resulted in unrealistic concentrations of calcium or negative thermal parameters, and these models were, therefore, rejected.
V Reverse Monte Carlo Simulations
Intensities from the superlattice reflections from Na0.57Ca0.14CoO2 were obtained from the room temperature x-ray data by indexing a single superlattice domain and excluding the principal hexagonal reflections. The superlattice reflections arise purely from the superstructure, whereas the principal reflections are only slightly modified, and they are also affected by other factors such as multiple scattering, or coexisting domains and phases. The propagation vectors used to index the rings of superlattice reflections converts to a real space supercell of seven hexagonal sodium cobaltate unit cells, and the concentrations from the refinements meant that four sodium ions and one calcium were added to each layer. RMC calculations were performed using this set of intensities and supercell. Each iteration of the RMC program involves discrete hopping movements of the sodium and calcium ions to vacancy sites within the plane, as well as continuous movements of any ion by small increments in any direction. Simulated annealing of the system helped to avoid a false minimum solution, initially allowing ions to hop freely then slowly decreasing the fictitious temperature and reducing the probability of allowing movements that would produce a higher .
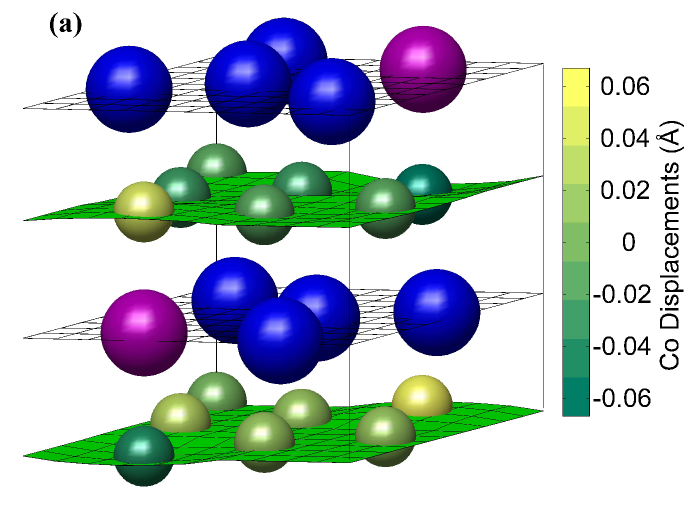
The RMC calculations led to the robust solution illustrated in Fig. 5, with the calcium ion on a position surrounded by sodium ions sitting on sites. In the second sodium/calcium layer the same pattern emerges, however, the calcium ion is translated away from the location of calcium on the first layer. This translation relates to a significant reduction in . The fit for this model had a per degree of freedom of 5.82 and an value of 12.9%. Figure 2(b) shows the calculated x-ray patterns for this solution indicating good agreement with the experimental data in Fig. 2(a) across all planes, including the variation of the satellite peak intensity between even and odd planes. The resulting structure has the space group with unique axis , atomic positions are given in Table 2.
| Name | Site | |||
|---|---|---|---|---|
| Co1 | 0 | 0 | 0 | 2a |
| Co2 | 0.1453(2) | 0.7156(2) | 0.00453(18) | 4f |
| Co3 | 0.2850(2) | 0.4295(2) | -0.00029(17) | 4f |
| Co4 | 0.4266(2) | 0.1421(2) | 0.00147(17) | 4f |
| O1 | 0.0462(11) | 0.2425(12) | 0.0926(9) | 4f |
| O2 | 0.2436(11) | 0.1951(11) | 0.5877(9) | 4f |
| O3 | 0.1948(11) | 0.9557(12) | 0.0977(9) | 4f |
| O4 | 0.3759(11) | 0.9031(11) | 0.5922(9) | 4f |
| O5 | 0.3284(11) | 0.6601(12) | 0.0955(8) | 4f |
| O6 | 0.5271(11) | 0.6205(11) | 0.6018(9) | 4f |
| O7 | 0.8966(11) | 0.5176(11) | 0.0853(9) | 4f |
| Na1 | 0.2334(14) | 0.1921(15) | 0.25 | 2e |
| Na2 | 0.0592(14) | 0.2410(15) | 0.75 | 2e |
| Na3 | 0.3799(14) | 0.8966(15) | 0.25 | 2e |
| Na4 | 0.5226(14) | 0.6177(15) | 0.25 | 2e |
| Ca1 | 0.1486(8) | 0.7151(8) | 0.75 | 2e |
The RMC solution also exhibits ordering in the distortions of the cobalt plane, with cobalt ions moving away from the closest calcium (which is sitting directly above the cobalt). This form of distortion was predicted using a Coulomb model for the pure systemRoger et al. (2007). The magnitude of the distortion is smaller for the system doped with calcium since the decreased hole concentration reduces the electrostatic potential for the multi-vacancy clusters. Figure 5(a) depicts the calcium doped divacancy structure with cobalt distortions emphasized for clarity. It was not possible to resolve the variation in the Co-O bond lengths using our x-ray data and, therefore, we attempted to use the neutron data.
RMC simulations using the neutron diffraction data were less sensitive to the superlattice, mainly due to a lower signal-to-background. The same divacancy superstructure was obtained, but the smaller scattering contrast between the calcium and sodium ions made it difficult to locate the positions of the calcium ions.
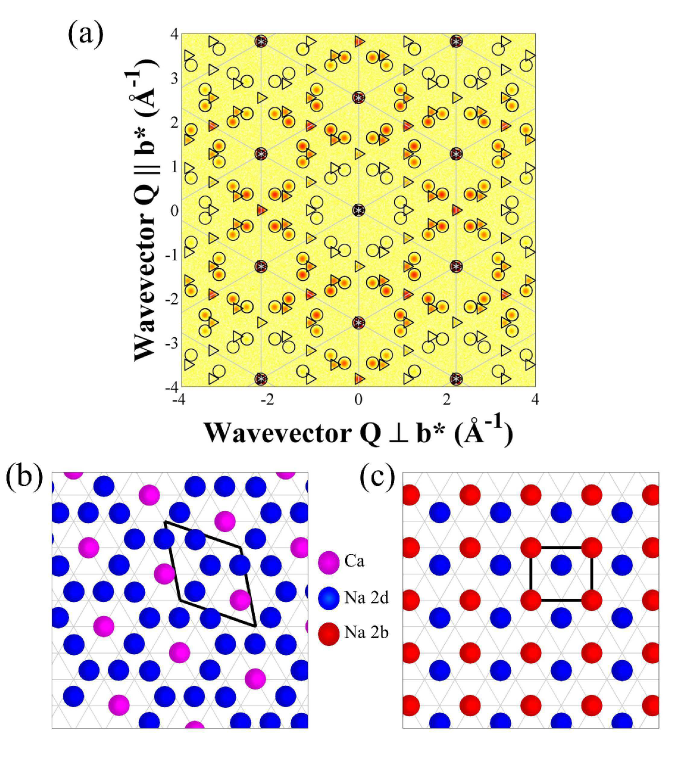
For Na0.55Ca0.2CoO2 this divacancy phase coexists with the phase observed for Na0.5CoO2 as shown in Fig. 6. In fact, the Na0.5CoO2 superstructure can also be viewed as stripes of divacancy clustersRoger et al. (2007). In this case it was not possible to perform RMC simulations due to the presence of contamination by higher order diffraction peaks.
VI Discussion
Analysis of the superlattice observed in all samples of NaxCayCoO2 indicates the presence of the superstructure with an ideal concentration of Na4/7Ca1/7CoO2. For pure sodium cobaltate the corresponding superstructure has a sodium concentration . According to calculations of the ground state energies of multi-vacancy structures using a long-range Coulombic model with short-range repulsion, this is the only stable divacancy cluster in this composition rangeRoger et al. (2007). It is likely that the substitution of the divalent calcium at the centre of the divacancy cluster has a stabilising effect since it lowers the charge of the divacancy cluster. The fact that this superstructure does not change with temperature and forms over a range of sample compositions suggests that it is a particularly stable superstructure.
Previous studies involving the doping of sodium cobaltate with calcium have concentrated on the variation of transport properties relevant to the thermoelectric performance of the material and had not considered the role of the superstructure. This has led to a number of different doping regimes being attempted though none have used exactly the concentration of the superstructure determined here. Kawata et al. found that both the electrical resistivity, , and the Seebeck coefficient, , increase with increasing calcium concentrationKawata et al. (1999). Ono et al. found that the increase in both and was linear, so that overall the power factor, , also increased with calcium concentrationOno et al. (2004). However, the power factor reaches a maximum value for Na0.70Ca0.0175CoO2 and above this calcium concentration, decreases. In another composition series, Li et al. found that the power factor first increased, and then decreased for Na0.64Ca0.16CoO2 and higher calcium concentrationsLi et al. (2006). In these reports the power factor is peaked very close to the optimum concentration for the ideal Na4/7Ca1/7CoO2 superstructure. The Seebeck coefficient increases up to this composition. Above this composition, where we find coexistence with an additional insulating phase, the electrical conductivity decreases.
For a full understanding of the thermoelectric performance of this material, the effect of the divacancy superstructure on the thermal transport must also be understood, as this is a key component for calculating the thermoelectric figure-of-merit, , where is the thermal conductivity. This contribution is beyond the scope of the current work but will be addressed in a future publication.
VII Conclusions
In summary, both x-ray and neutron diffraction of calcium-doped sodium cobaltate have revealed a previously unobserved superlattice that can be explained by a superstructure with seven unit cells. An RMC program was used to find the ordering in both sodium layers as well as distortions in the cobalt plane in a model-independent manner, reliably generating a divacancy structure with calcium ions at the centre on a site, with an ideal concentration Na4/7Ca1/7CoO2. The same superstructure is observed across a broad temperature range and in all compositions studied, though moving away from the optimal concentration for this structure results in weaker superlattice intensities and the emergence of additional phases. Comparison with thermoelectric measurements in the literature indicates that this ideal concentration coincides with the maximum in the thermoelectric power factor for the system.
Acknowledgements.
We thank D. Voneshen for his help. We are grateful for the financial support and hospitality of ISIS. This work was supported by EPSRC grants EP/J011150/1 and EP/J012912/1.References
- Terasaki et al. (1997) I. Terasaki, Y. Sasago, and K. Uchinokura, Phys. Rev. B 56, R12685(R) (1997).
- Wang et al. (2003) Y. Wang, N. Rogado, R. Cava, and N. Ong, Nature (London) 423, 425 (2003).
- Foo et al. (2004) M. L. Foo, Y. Wang, S. Watauchi, H. W. Zandbergen, T. He, R. J. Cava, and N. P. Ong, Phys. Rev. Lett. 92, 247001 (2004).
- Lee et al. (2006) M. Lee, L. Viciu, L. Li, Y. Wang, M. L. Foo, S. Watauchi, R. A. P. Jr, R. J. Cava, and N. P. Ong, Nat. Mater. 5, 537 (2006).
- Kawata et al. (1999) T. Kawata, Y. Iguchi, T. Itoh, K. Takahata, and I. Terasaki, Phys. Rev. B 60, 10584 (1999).
- Ono et al. (2004) Y. Ono, N. Kato, Y. Miyazaki, and T. Kajitani, J. Ceram. Soc. Japan 112, S626 (2004).
- Li et al. (2006) Y. Li, G. Xu, and M. Jiang, J. Mater. Sci. Technol. 22, 526 (2006).
- Roger et al. (2007) M. Roger, D. J. P. Morris, D. A. Tennant, M. J. Gutmann, J. P. Goff, J. U. Hoffmann, R. Feyerherm, E. Dudzik, D. Prabhakaran, A. T. Boothroyd, N. Shannon, B. Lake, and P. P. Deen, Nature (London) 445, 631 (2007).
- Morris et al. (2009) D. J. P. Morris, M. Roger, M. J. Gutmann, J. P. Goff, D. A. Tennant, D. Prabhakaran, A. T. Boothroyd, E. Dudzik, R. Feyerherm, J. U. Hoffmann, and K. Kiefer, Phys. Rev. B 79, 100103 (2009).
- Voneshen et al. (2013) D. J. Voneshen, K. Refson, E. Borissenko, M. Krisch, A. Bosak, A. Piovano, E. Cemal, M. Enderle, M. J. Gutmann, M. Hoesch, M. Roger, L. Gannon, A. T. Boothroyd, S. Uthayakumar, D. G. Porter, and J. P. Goff, Nat. Mater. 12, 1028 (2013).
- Prabhakaran et al. (2004) D. Prabhakaran, A. T. Boothroyd, R. Coldea, and N. R. Charnley, J. Cryst. Growth 271, 74 (2004).
- Prabhakaran and Boothroyd (2011) D. Prabhakaran and A. T. Boothroyd, J. Cryst. Growth 318, 924 (2011).
- Keen et al. (2006) D. A. Keen, M. J. Gutmann, and C. C. Wilson, J. Appl. Crystallogr. 39, 714 (2006).
- Dusek et al. (2001) M. Dusek, V. Petrícek, M. Wunschel, R. E. Dinnebier, and S. van Smaalen, J. Appl. Crystallogr. 34, 398 (2001).
- McGreevy (2001) R. L. McGreevy, J. Phys.: Condens. Matter 13, R877 (2001).
- Porter (2012) D. G. Porter, “Control of electrons through patterning of superstructures in sodium cobaltate,” (2012), ph.D. thesis, Royal Holloway, University of London.
- Huang et al. (2004) Q. Huang, M. L. Foo, J. W. Lynn, H. W. Zandbergen, G. Lawes, Y. Wang, B. H. Toby, A. P. Ramirez, and R. N P Ong and, J. Phys.: Condens. Matter 16, 5803 (2004).