Mining the XRT archive to probe the X-ray absorber structure in the AGN population
Abstract:
One of the key ingredients of the Unified Model of Active Galactic Nuclei (AGN) is the presence of a torus-like optically thick medium composed by dust and gas around the putative supermassive black hole. However, the structure, size and composition of this circumnuclear medium are still matter of debate. To this end, the search for column density variations through X-ray monitoring on different timescales (months, weeks and few days) is fundamental to constrain size, kinematics and location of the X-ray absorber(s).
Here we describe our project of mining the Swift-XRT archive to assemble a sample of AGN with extreme column density variability and determining the physical properties of the X-ray absorber(s). We also present the results obtained from a daily-weekly Swift-XRT follow-up monitoring recently performed on one of the most interesting new candidates for variability discovered so far, Mrk 915.
1 Variable Swift-AGN sample
According to the Unified Model of Active Galactic Nuclei (AGN; [2]), an obscuring optically thick medium composed by dust and gas arranged in a torus-like geometry is present around the nuclear engine. However, the structure, size and composition of this circumnuclear medium are still matter of debate; important constrains have been recently provided by the study of the absorption variability, almost ubiquitous in bright absorbed AGN ([3]). X-ray absorbing column densities, , have been observed to change over different timescales, from a few years down to weeks or days, for a handful of AGN (e.g., [4] and references therein), allowing us to investigate the X-ray properties of the absorbers down to sub-parsec scales. The emerging picture is that multiple neutral and ionized absorbers co-exist around the central black hole, located at different distances from it.
We recently started a project aimed at finding more examples of these sources in order to study the physical properties of the X-ray absorbers on a larger statistical basis. We exploited the vaste amount of X-ray observations provided by the X-ray Telescope (XRT; [5]) onboard the satellite Swift. XRT long exposure observations are always split in segments of ks, with typical integration times of ks per day. This generates, for bright sources, a natural short-timescale monitoring, with spectra good enough to perform a basic spectral analysis. As an example, for an AGN with a flux of , in ks we expect to collect net photons. This makes the Swift-XRT archive an important database to search for different timescale variability of bright sources. To assemble our sample, we considered:
-
1.
the serendipitous sources detected in the field of view of XRT observations performed as follow-up of 76 gamma-ray bursts. These observations correspond to square degrees;
-
2.
the XRT sources classified as AGN that are possible counterparts of objects detected by the Burst Alert Telescope (BAT) onboard Swift [6, 7]. This AGN sample can be considered unbiased in term of column density, at least for (a limit above which a source falls in the so-called Compton-thick regime). In the energy band covered by BAT (keV), the intrinsic emission is indeed weakly affected by absorption levels below few .
For each source, we split the XRT data sets on a daily basis, combining all the observation segments within 1 day (for the AGN-BAT sample) or 2 days (for the serendipitous sources). We filtered out time bins shorter than sec. The light curves span a wide range of number of time bins (from one up to more than spectra) and timescales (from few days to years). For serendipitous sources and BAT AGN we have at least two spectra.
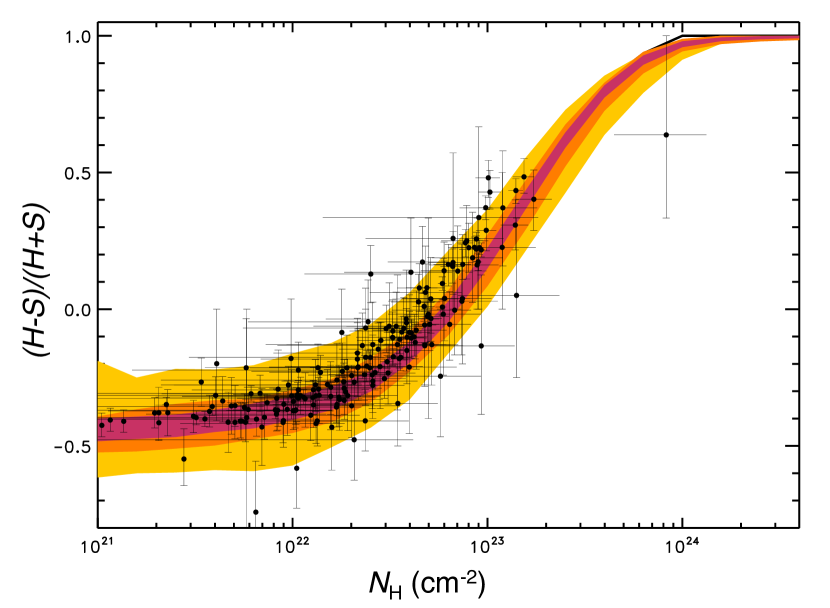
As a proxy of the amount of column density we used the hardness ratio , where keV and keV. In the keV energy band, the spectrum of an AGN can be approximate, at the first order, by an absorbed power law, while below keV different soft components (soft excess, reflection, scattering, etc) are also present. Under this hypothesis, the value as defined here provides a strong indication of the amount of absorption: in Fig. 1 (left panel) we compare the vs. derived from the analysis of the XRT data with the measured for a number of simulated spectra (photon index ) with different values of absorbing column density. For each input value, we indicate with different colours the and percentile of the distribution of tests with three different values of keV source photons (from lightest to darkest, , and ). From the plot it is evident that the is a proxy of the , and variation in the can be interpreted as an indication of a change in the absorbing column density, at least for between and few times .
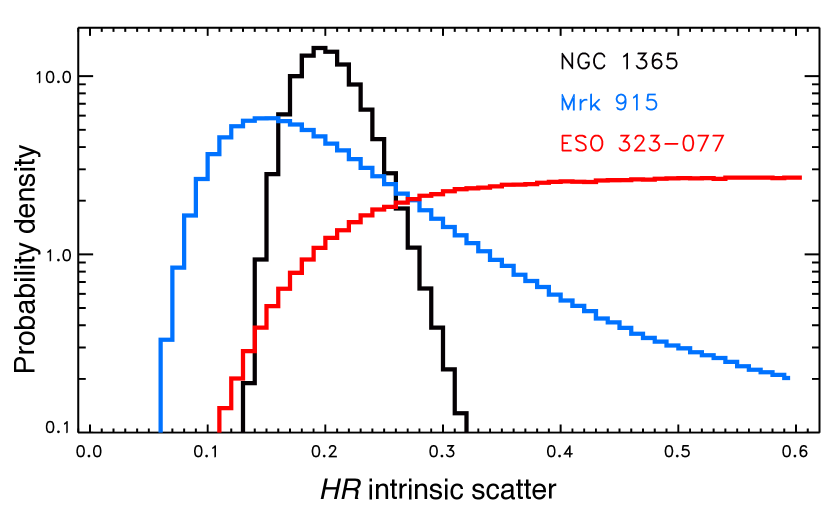
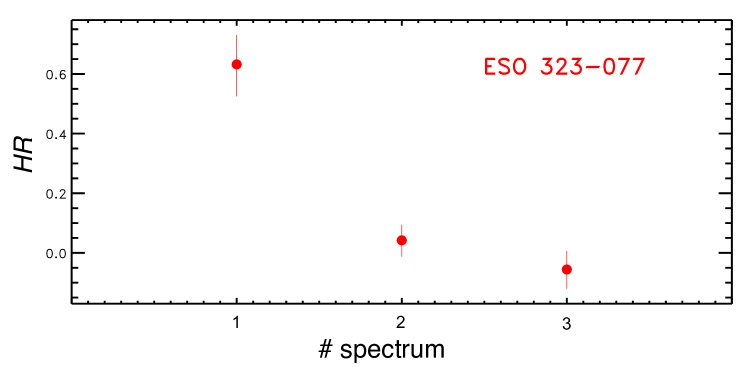
In order to probe the spectral variability, for each source we measured the possible non-zero amplitude of an intrinsic scatter superimposed to the statistical one. We adopted a Bayesian approach similar to the one used by [8] to determine the intrinsic scatter of cluster velocity dispersion in presence of measurement errors, adapted here to Poisson-based quantities. Basically, starting from the source and background photons in the two bands (keV and keV) and in the different time bins, we calculate the probability for each value of intrinsic scatter given the data. As an example, the probability distributions for sources for which a spectral variation is clearly detected are shown in Fig. 1 (right panel), where we plot the probability associated to an intrinsic scatter value ranging from (corresponding to the no-scatter case) to . As evident from the figure, the probability of null intrinsic scatter is , implying a negligible probability that the measured variability (shown in Fig. 2 for two of the sources) is due to statistical fluctuations.
By applying a very conservative threshold of in the probability of null intrinsic scatter, we found AGN candidates for variable absorbers, of which are serendipitous and are BAT-selected. The sources are listed in Table 1, together with the main characteristics of the XRT archival data considered here. For the AGN observed by BAT, we summarise also the basic information extracted from the Swift-BAT 70 month survey catalogue111See http://swift.gsfc.nasa.gov/results/bs70mon/. Most of the BAT-selected sources are well-known variable AGN: this confirms the validity of the adopted method. We are exploring its potentiality by relaxing the threshold in probability of null intrinsic scatter. However, even the more restrictive threshold used here demonstrates the effectiveness of this method: it provided us with new candidates (two of which are serendipitous) that were not previously known as variable sources. Below we present the results obtained from a daily-weekly Swift-XRT follow-up monitoring that was recently performed on one of them, Mrk 915.
| Source name | XRT archive | BAT catalogue | Ref. | |||||
| Tot. Exp. | count rate | # spectra | z | Opt. class. | ||||
| (1) | (2) | (3) | (4) | (5) | (6) | (7) | (8) | (9) |
| Mrk 915 | 23.2 | 0.14 | 6 | 316 | 1.70.3 | 0.02411 | Sy1 | |
| NGC 1365 | 154.8 | 0.14 | 34 | 644 | 2.00.1 | 0.00546 | Sy1.8 | [9, 10, 11, 12, 13] |
| ESO 362-18 | 96.9 | 0.53 | 31 | 494 | 1.90.1 | 0.01245 | Sy1.5 | [14] |
| CGCG 031-072 | 10.7 | 0.03 | 3 | 215 | 1.90.3 | 0.03305 | Sy1 | |
| NGC 4395 | 243.6 | 0.11 | 190 | 25 | 2.00.2 | 0.00106 | Sy1.9 | [15, 13] |
| ESO 323-077 | 7.5 | 0.09 | 3 | 33 | 2.1 | 0.01501 | Sy1.2 | [16] |
| Mrk 335 | 299.2 | 0.34 | 182 | 184 | 2.30.3 | 0.02578 | Sy1.2 | [17, 18, 19, 4] |
| NGC 3227 | 14.5 | 0.32 | 6 | 104 | 2.00.1 | 0.00386 | Sy1.5 | [15, 4, 13] |
| NGC 3516 | 36.8 | 0.46 | 31 | 1184 | 1.90.1 | 0.00884 | Sy1.5 | [20, 21, 4, 13] |
| NGC 4051 | 39.6 | 0.67 | 32 | 403 | 2.30.1 | 0.00233 | Sy1.5 | [22, 23, 15, 4, 13] |
| Mrk 766 | 108.5 | 0.58 | 56 | 223 | 2.50.2 | 0.01293 | Sy1.5 | [24, 25, 26, 27, 15] |
| NGC 3783 | 21.7 | 2.2 | 6 | 1815 | 2.00.1 | 0.00973 | Sy1 | [28, 15, 4, 13] |
| MCG +11-11-032 | 14.6 | 0.02 | 3 | 184 | 1.80.3 | 0.036 | Sy2 | |
| SWJ012118-125727 | 53.6 | 0.01 | 4 | |||||
| SWJ105826-231414 | 59.4 | 0.004 | 7 | |||||
2 A new candidate for variable absorber: Mrk 915
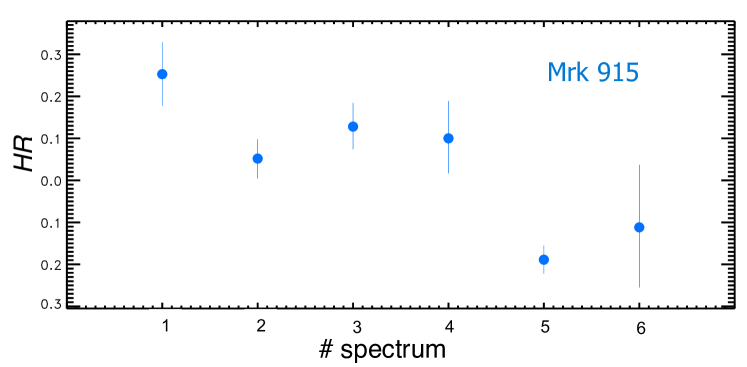
Mrk 915 () is a Seyfert 1.5-1.9 galaxy hosting a black hole of mass ([29]). Spectroscopic observations performed in the optical band ([29, 30]) suggest that part of the optical absorption affecting the central regions originates outside the obscuring torus, and it is most likely associated with the dust lanes seen crossing the central source ([31]). For this source the variation observed has a probability less than of having a null intrinsic scatter superimposed to the statistical fluctuations (Fig. 2, left panel).
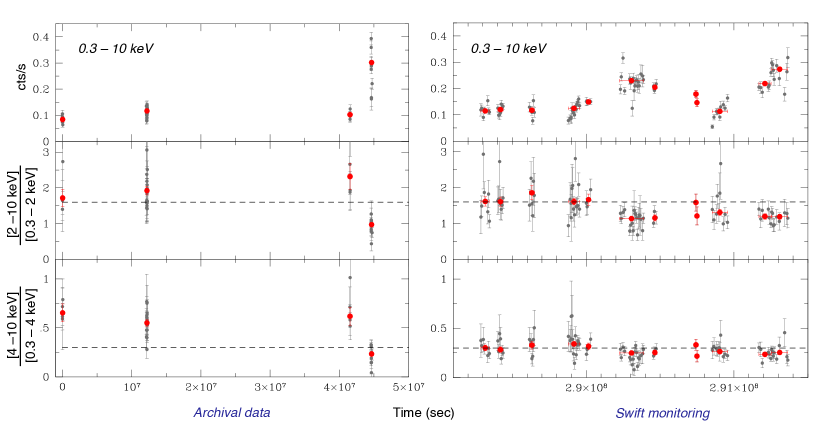
We were awarded 12 observations with XRT (covering weeks, for a total of ksec net exposure time), to further investigate the variability and its timescales. In Fig. 3 we show the temporal behaviour of Mrk 915, as reconstructed considering all the Swift datasets (archival on the left panel, new monitoring on the right panel). The data are binned both per observation (red filled circles) and per snapshot (grey dots). Comparing the keV light curves from the new monitoring and the archival data, we confirm, on shorter timescales, the count rate variability previously detected (see Fig. 3, upper panels). However, the analysis of the ratio of count rates observed in hard and soft bands () highlights a change in the behaviour of the source: in the archival observations Mrk 915 underwent to a dramatic spectral variation on a timescale of month. This is clearly revealed by the decreasing of the keV vs. keV ratio of a factor of (see Fig. 3, lower panels). A slightly less intense variation is also observed in the keV vs. keV ratio (about a factor of ). During the new Swift monitoring the change in the spectral shape is less prominent, of a maximum factor of on timescales of days. No difference in the maximum amplitude of variation is observed when comparing the light curve of the keV vs. keV ratio with the light curve of the keV vs. keV ratio.
To summarise, the Swift monitoring allowed us to find Mrk 915 in a different state than previously detected, and to follow the source during a spectral variation. The origin of this behaviour is still under investigation; a detailed spectral analysis will be presented in Severgnini et al. (in prep.).
Acknowledgments.
The research leading to these results has received funding from the European Commission Seventh Framework Programme (FP7/2007-2013) under grant agreement n. 267251 “Astronomy Fellowships in Italy” (AstroFIt). Support from the Italian Space Agency is acknowledged by LB (contract ASI INAF NuSTAR I/037/12/0). This work made use of data supplied by the UK Swift Science Data Centre at the University of Leicester. This research has made use of the Palermo BAT Catalogue and database operated at INAF - IASF Palermo. We also want to thank Neil Gehrels and the Swift Mission Operation Center to make every effort to get our ToO request scheduled.References
- [1]
- [2] Antonucci 1993, Unified models for active galactic nuclei and quasars, ARA&A, 31, 473
- [3] G. Risaliti, M. Elvis, F. Nicastro, Ubiquitous Variability of X-Ray-absorbing Column Densities in Seyfert 2 Galaxies, ApJ 571 (2002) 234
- [4] A.G. Markowitz, M. Krumpe, R. Nikutta, First X-ray-based statistical tests for clumpy-torus models: eclipse events from 230 years of monitoring of Seyfert AGN, MNRAS 439 (2014) 1403
- [5] D.N. Burrows et al., The Swift X-Ray Telescope, SSRv 120 (2005) 165
- [6] W.H. Baumgartner et al., The 70 Month Swift-BAT All-sky Hard X-Ray Survey, ApJS 207 (2013) 19
- [7] G. Cusumano et al., The Palermo Swift-BAT hard X-ray catalogue.III.Results after 54 months of sky survey, A&A 524 (2010) A64
- [8] S. Andreon et al., Scaling relations of the colour-detected cluster RzCS 052 at z = 1.016 and some other high-redshift clusters, MNRAS 383 (2008) 102
- [9] G. Risaliti et al., Rapid Compton-thick/Compton-thin Transitions in the Seyfert 2 Galaxy NGC1365, ApJL 623 (2005) 93
- [10] G. Risaliti et al., Occultation Measurement of the Size of the X-Ray-emitting Region in the Active Galactic Nucleus of NGC1365, ApJL 659 (2007) 111
- [11] R. Maiolino et al., “Comets” orbiting a black hole, A&A 517 (2010) AA47
- [12] V. Braito et al., NGC1365: A Low Column Density State Unveiling a Low Ionization Disk Wind, ApJ 796 (2014) 87
- [13] G. Torricelli-Ciamponi et al., Search for X-ray occultations in active galactic nuclei, MNRAS 442 (2014) 2116
- [14] B. Agís-González et al., Black hole spin and size of the X-ray-emitting region(s) in the Seyfert 1.5 galaxy ESO 362-G18, MNRAS 443 (2014) 2862
- [15] J. Gofford, et al. The Suzaku view of highly ionized outflows in AGN - I. Statistical detection and global absorber properties, MNRAS 430 (2013) 60
- [16] G. Miniutti et al., The properties of the clumpy torus and BLR in the polar-scattered Seyfert 1 galaxy ESO 323-G77 through X-ray absorption variability, MNRAS 437 (2014) 1776
- [17] D. Grupe et al., XMM-Newton Observations of the Narrow-Line Seyfert 1 Galaxy Mrk335 in a Historical Low X-Ray Flux State, ApJ 681 (2008) 982
- [18] D. Grupe et al., A Remarkable Long-term Light Curve and Deep, Low-state Spectroscopy: Swift and XMM-Newton Monitoring of the NLS1 Galaxy Mkn335, ApJS 199 (2012) 28
- [19] A.L. Longinotti et al., The Rise of an Ionized Wind in the Narrow-line Seyfert 1 Galaxy Mrk335 Observed by XMM-Newton and HST, ApJ 766 (2013) 104
- [20] T.J. Turner et al., X-Ray Characteristics of NGC3516: A View through the Complex Absorber, ApJ 733 (2011) 48
- [21] E.M. Huerta et al., A Detailed Analysis of the High Resolution X-Ray Spectra of NGC3516: Variability of the Ionized Absorbers, ApJ 793 (2014) 61
- [22] P. Uttley et al., Complex X-ray spectral behaviour of NGC4051 in the low flux state, MNRAS 347 (2004) 1345
- [23] A.P. Lobban et al., Contemporaneous Chandra HETG and Suzaku X-ray observations of NGC4051, MNRAS 414 (2011) 1965
- [24] K.A. Pounds et al., Fe K emission and absorption features in XMM-Newton spectra of Mrk766: evidence for reprocessing in flare ejecta, MNRAS 342 (2003) 1147
- [25] L. Miller et al., The variable X-ray spectrum of Mrk766. I. Principal components analysis, A&A 463(2007) 131
- [26] T.J. Turner et al., The variable X-ray spectrum of Mrk766. II. Time-resolved spectroscopy, A&A 475 (2007) 121
- [27] G. Risaliti et al., X-ray absorption by broad-line region clouds in Mrk766, MNRAS 410 (2011) 1027
- [28] R.C. Reis et al., X-Ray Spectral Variability in NGC3783, ApJ 745 (2012) 93
- [29] N. Bennert et al., Size and properties of the narrow-line region in Seyfert 1 galaxies from spatially-resolved optical spectroscopy, A&A 459 (2006) 55
- [30] M.L. Trippe et al., A Multi-wavelength Study of the Nature of Type 1.8/1.9 Seyfert Galaxies, ApJ 725 (2010) 1749
- [31] M.A. Malkan et al., A Hubble Space Telescope Imaging Survey of Nearby AGN, ApJS 117 (1998) 25