Criticality in the approach to failure in amorphous solids
Abstract
Failure of amorphous solids is fundamental to various phenomena, including landslides and earthquakes. Recent experiments indicate that highly plastic regions form elongated structures that are especially apparent near the maximal shear stress where failure occurs. This observation suggested that acts as a critical point where the length scale of those structures diverges, possibly causing macroscopic transient shear bands. Here we argue instead that the entire solid phase () is critical, that plasticity always involves system-spanning events, and that their magnitude diverges at independently of the presence of shear bands. We relate the statistics and fractal properties of these rearrangements to an exponent that captures the stability of the material, which is observed to vary continuously with stress, and we confirm our predictions in elastoplastic models.
Amorphous solids, such as emulsions, sand or molecular glasses are yield stress materials: they behave as solids if the applied shear stress is low, but flow as fluids if it is large. Unlike the melting transition, the associated phase transition is dynamical: the solid phase is an arrested, glassy state whose properties depend on preparation. One such property is failure Manning et al. (2007), which occurs as increases toward a history-dependent stress where macroscopic flow starts. For densely prepared materials, the stress overshoots: Andreotti et al. (2013); Jagla (2007), where is the minimum stress at which flow can be maintained in stationary conditions. Flow then tends to localize along transient (but sometimes long-lasting) shear bands Divoux et al. (2015). By contrast, for loosely prepared materials Andreotti et al. (2013) and shear-banding may be avoided Moorcroft and Fielding (2013). Despite its importance in human applications and geophysical phenomena, including landslides and earthquakes Lockner and Beeler (2002), the microscopic mechanisms controlling plasticity and failure remain debated.
In granular materials, recent experiments Amon et al. (2012); Le Bouil et al. (2014a, b) and numerics Gimbert et al. (2013) support that for , plasticity occurs via localized rearrangements, or shear transformations Argon (1979), which tend to organize into elongated structures whose magnitude grows as . In Gimbert et al. (2013) it was argued that for a dense initial state (), acts as a critical point where a correlation length diverges and avalanches become system-spanning, which may in turn trigger macroscopic shear bands. This viewpoint complements the growing consensus that the reverse transition, occurring when flows stop as the stress is decreased toward , is accompanied by a diverging length scale Pouliquen (2004); Lin et al. (2014a); Olsson and Teitel (2007); Martens et al. (2011); Düring et al. (2014); Salerno et al. (2012); Lemaître and Caroli (2009). Such a “symmetric” scenario where diverges from both sides of the transition applies to the depinning transition Fisher (1998) of an elastic manifold pushed through a disordered medium. Nevertheless, an alternative scenario has been argued for in glassy systems with slowly-decaying interactions, predicting system-spanning avalanches () in the entire glass phase Müller and Wyart (2015). Applied to amorphous solids, this view suggests criticality for all stresses where plasticity occurs. This approach however lacks empirical support, and its consequences on failure near have not been investigated.
In this Letter we show that as the stress is adiabatically increased in the solid phase, leading to a plastic strain , the mean avalanche size follows , where is the system size and is an exponent that characterizes the stability of the structure Lin et al. (2014b). This result confirms that avalanches are system-spanning () for all , and further implies an additional singularity as failure is approached, since when . We suggest that data analysis used in the literature can mistakenly interpret this singularity as a diverging length scale. We also derive a scaling relation between and exponents characterizing the statistics of avalanches. We test these predictions using elasto-plastic models Picard et al. (2005); Baret et al. (2002), and show that they hold independently of the system preparation and of the presence of shear bands near , thus implying that macroscopic flow localization and singularities in avalanche size are unrelated.
Elastoplastic viewpoint: following Hébraud and Lequeux (1998); Picard et al. (2005); Baret et al. (2002) we model amorphous solids as consisting of blocks, each characterized by a scalar local stress and a local failure threshold . The overall shear stress is . Stability of is achieved if . Otherwise, the block is unstable: a plastic strain of magnitude occurs on some time scale , leading to an overall increment of plastic strain . Such a plastic event also reduces stress locally by some amount where is the elastic modulus, and affects stress in other locations via a long-range Eshelby field Picard et al. (2004), which can in turn trigger new instabilities. For our numerics below, we choose the specific model described in Lin et al. (2014a) in two dimensions. Blocks then form a bi-periodic square lattice, and the elastic propagator follows approximatively where is the angle between the shear direction and . We choose , and , where is a random number, uniformly distributed in . For these choices, , and stability is easily expressed in terms of the variable , and corresponds to .
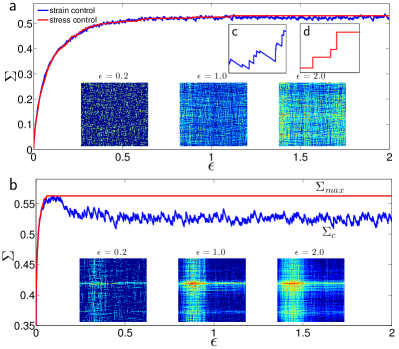
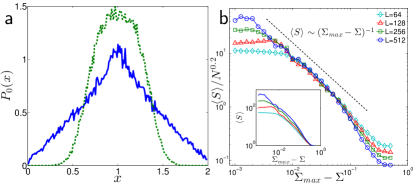
Such automaton models can be used to study the transient regime toward failure. In what follows we use two quasi-static protocols. In the stress-control protocol, is increased just sufficiently to trigger a single instability. is fixed during the resulting avalanche, and is increased again only when this chain of events has stopped. The strain-control protocol is identical, except that decreases during avalanches, proportionally to the plastic strain. Stress v.s. plastic strain curves for these two protocols are shown in Fig.1 (from which the stress v.s. total strain curves are easily deduced using the relation ). They essentially track each other macroscopically (although they differ microscopically, see insets (c) and (d)) except when reaches , if .
The transient qualitatively depends on the initial stability of the system, characterized by the initial distribution of local stability . If is narrow and depleted near (corresponding to a very stable initial condition), transient shear bands occur; otherwise flow can remain homogeneous Vandembroucq and Roux (2011). In Fig.1 we confirm these results using a broad and a narrow distribution (see S.I. for details). We further find that transient shear bands tend to occur if the stress-strain curve overshoots (although we did not investigate this correlation systematically), as is sometimes reported Shi et al. (2007); Moorcroft et al. (2011); Jagla (2007) and argued for in Moorcroft and Fielding (2013); Fielding (2014). In what follows we focus on avalanche-type response, for below and approaching .
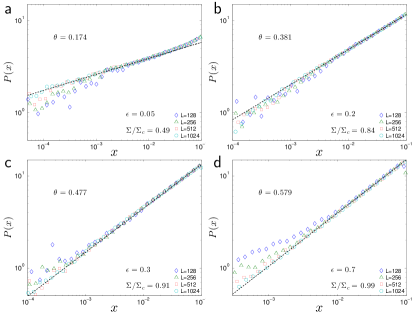
Distribution of local distance to yield stress: mean-field models Lemaître and Caroli (2007); Hébraud and Lequeux (1998) reveal that the distribution of local stability vanishes near in a quasi-static shear at . In Lin et al. (2014b) some of us showed that stability indeed requires the presence of a pseudo-gap, i.e. with , otherwise, any plastic event would eventually trigger an extensive rearrangement, and this argument also holds in the transient regime. was measured in elasto-plastic models Lin et al. (2014b) and indirectly in MD simulations Karmakar et al. (2010); Salerno and Robbins (2013) both at and after a quench at , leading to consistent results. In Fig.2 we extend these results to the transient regime. We find that as predicted in Lin et al. (2014b). However, the value of turns out to be function of the relative stress , while it converges to a well-defined value for large system size as shown in S.I. After some initial decay at very small (not shown), the value of increases from at to the value at . This measure is consistent with the exponent obtained in the stationary regime Lin et al. (2014a).
The value of was argued to control rheological properties in the flowing phase as from aboveLin et al. (2014a) and to imply system spanning avalanches for Müller and Wyart (2015). We now extend this latter argument to include the case where from below.
Extreme value statistics implies that if and the variables are independent, the least stable block must be at a distance of an instability. By definition, is the increment of stress that can be added before a new avalanche starts: the length of the vertical lines in Fig.1(d). Hence, following a finite stress increment of , a number of avalanches are triggered. In elastoplastic models the avalanche size is defined as the number of plastic events, which is approximately related to the total strain of the single avalanche , by . Thus the total strain increase must follow , where is the mean avalanche size at stress . We thus get:
| (1) |
where is the local slope of the stress-plastic strain curve, and the limit corresponds to . This central result indicates that (i) if is increased in the solid phase, avalanches are system-spanning () even for , since their size is dependent. Thus the system remains critical in the whole range as long as plastic flow occurs, i.e. . (ii) Avalanches become larger as , as observed Le Bouil et al. (2014a), since at .
Further scaling relations can be derived for the statistical properties of transient avalanches for . We make the assumption that the distribution of avalanches is homogeneous, i.e. , where the cut-off size scales as . Here is the fractal dimension of avalanches, is the linear system size, and , where is the spatial dimension. From this distribution it is straightforward to compute the mean . Comparing with Eq.(1), we get:
| (2) |
A similar relation holds for stationary flow Lin et al. (2014a), although in the transient regime exponents appear to depend continuously on .
Finally, we introduce an exponent defined as for close to . Eq.(1) then implies the scaling relation:
| (3) |
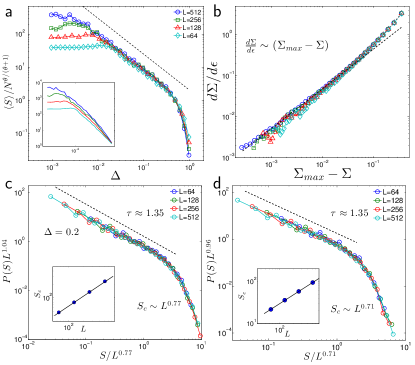
These predictions are tested in Fig.3. The inset of panel (a) shows that the mean avalanche size, as a function of , grows with the system size even far from failure. The entire solid phase is critical, as expected from Eq.(1). Note that to test this equation, one must consider the fact that . In this figure we use for the third order polynomial fit of Fig.2(b). Using these values for a beautiful collapse is observed.
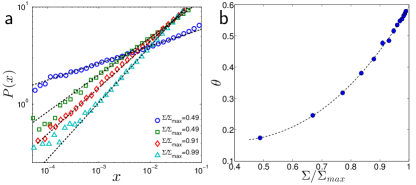
The presence of system sized avalanches far from threshold has to be distinguished from the divergence observed close to the yield stress, at fixed as implied by Eq.(3). Fig.3(a) is consistent with this relation and yields . According to its definition, can also be directly measured from the local slope of stress-strain curves, as is done in Fig.3(b) where is found, consistent with Fig.3(a). means that the stress tends to exponentially fast. As shown in S.I, this appears to be valid also if the stress overshoots and .
In Fig.3(c,d), we measure at , where , by collapsing the probability distribution of avalanche sizes, with . We find and in the stress-control case. Again, these values perfectly agree with Eq.(2). This result holds also for the strain-control protocol where we find scale-free avalanches with the same and a similar fractal dimension, .
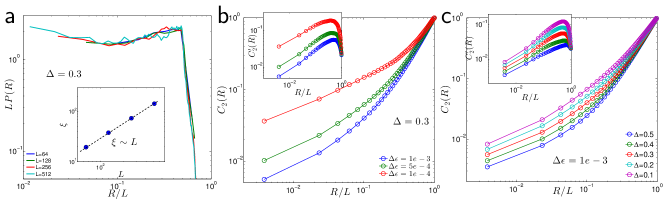
Length scale: To further evidence the presence of a diverging length scale throughout the solid phase, we study the strain map generated by a single avalanche, and consider the distances between all the blocks involved in the avalanche. We compute the distribution of these distances, and define as the average of these distributions among avalanches occurring at the same stress value in different samples (we choose to weight each avalanche by in this average). We focus on avalanches occurring at a finite distance from failure, with . Assuming homogeneity we expect . In Fig.4(a), we confirm such a form, specifically:
| (4) |
We observe a similar scaling form in the strain-control simulation. These results confirm that , as further supported by the observation that shown in inset.
Our results are at odd with the conclusions of Gimbert et al. (2013), which report an increasing length scale in a stress-control simulation of granular media. We now suggest that their data may in fact be consistent with our views. In Gimbert et al. (2013), a length scale is extracted by considering the fluctuations of the strain field obtained during some strain interval , for different stress values . This is a priori different from our analysis above which considers avalanches individually. To clarify this point, we perform an analysis closer to theirs, where finite intervals of strain are considered. We define a pair density function Girard et al. (2010) as the probability that two local plastic events among the ones in this interval are at a distance smaller than . Fig.4(b) shows for and varying as indicated in legend. At first sight, one may think that a length scale can be extracted from , but that this length is -dependent. We find that this dependence, however, can be cured by removing the effect of the mean strain in our definition of . We define , which is zero if the plastic events are homogeneous in space. As shown in the inset of Fig.4(b), the characteristic length in does not depend on . In Fig.4(c) we show a similar analysis as the proximity to failure is varied. From it would appear that a length scale grows as . However, as shown in inset this is an artefact of this analysis, as shows a constant length scale of order , consistent with our prediction . Experimental measurements of the anisotropic part of the strain field also support that the correlation length is always large and weakly depends on Le Bouil et al. (2014b). Our views could be further tested by performing a similar analysis in similar experimental Amon et al. (2012); Le Bouil et al. (2014a, b) and numerical Gimbert et al. (2013) data.
Conclusion: Ref.Müller and Wyart (2015) argues that glassy systems whose elementary excitations display sufficiently long-range interactions (including electron glass, mean-field spin glasses or spheres at random close packing) must display criticality for an entire range of fields or shear stress. This view has not yet been established experimentally. Our work supports that it holds in amorphous solids and granular materials, where it should be testable. Slowly-sheared granular material experiments have revealed avalanches with power-law statistics, but currently these studies have been limited to stationary flow Hayman et al. (2011); Bretz et al. (2006) (which, in addition to miss the transient behavior, may lead to additional complexity for granular materials due to the emergence of isostaticity DeGiuli et al. (2015); Lerner et al. (2012), a property however absent in the transient Kruyt (2010)). Note that for stresses far from , a large system may be required to test our views, since one must have for Eq.(1) to hold. Our predictions may also apply in disordered crystals, where however is not well-defined presumably due to work hardening Miguel et al. (2001); Csikor et al. (2007). In Ispánovity et al. (2014), the authors observe numerically scale-free avalanches with for a range of stresses. In our views that corresponds to , a prediction that could be tested by measuring how the characteristic interval of stress with no plasticity vanishes with . Finally, a central question for the future is what governs the value of the exponent , which affects plasticity but also macroscopic rheological properties.
Acknowledgments: It is a pleasure to thank E. DeGiuli, E. Lerner, B. Metzger, M. Muller, J. Weiss, L. Yan and S. Zapperi for discussions related to this work. MW acknowledges support from NSF CBET Grant 1236378 and MRSEC Program of the NSF DMR-0820341 for partial funding.
References
- Manning et al. (2007) M. L. Manning, J. S. Langer, and J. M. Carlson, Physical review E 76 (2007).
- Andreotti et al. (2013) B. Andreotti, Y. Forterre, and O. Pouliquen, Granular media: between fluid and solid (Cambridge University Press, 2013).
- Jagla (2007) E. A. Jagla, Phys. Rev. E 76, 046119 (2007).
- Divoux et al. (2015) T. Divoux, M. A. Fardin, S. Manneville, and S. Lerouge, arXiv preprint arXiv:1503.04130 (2015).
- Moorcroft and Fielding (2013) R. L. Moorcroft and S. M. Fielding, Physical review letters 110, 086001 (2013).
- Lockner and Beeler (2002) D. A. Lockner and N. M. Beeler, International Geophysics 81, 505 (2002).
- Amon et al. (2012) A. Amon, V. B. Nguyen, A. Bruand, J. Crassous, and E. Clément, Phys. Rev. Lett. 108, 135502 (2012).
- Le Bouil et al. (2014a) A. Le Bouil, A. Amon, J.-C. Sangleboeuf, H. Orain, P. Bésuelle, G. Viggiani, P. Chasle, and J. Crassous, Granular Matter 16, 1 (2014a).
- Le Bouil et al. (2014b) A. Le Bouil, A. Amon, S. McNamara, and J. Crassous, Physical review letters 112, 246001 (2014b).
- Gimbert et al. (2013) F. Gimbert, D. Amitrano, and J. Weiss, EPL (Europhysics Letters) 104, 46001 (2013).
- Argon (1979) A. Argon, Acta Metallurgica 27, 47 (1979).
- Pouliquen (2004) O. Pouliquen, Physical review letters 93, 248001 (2004).
- Lin et al. (2014a) J. Lin, E. Lerner, A. Rosso, and M. Wyart, Proceedings of the National Academy of Sciences 111, 14382 (2014a).
- Olsson and Teitel (2007) P. Olsson and S. Teitel, Phys. Rev. Lett. 99, 178001 (2007).
- Martens et al. (2011) K. Martens, L. Bocquet, and J.-L. Barrat, Phys. Rev. Lett. 106, 156001 (2011).
- Düring et al. (2014) G. Düring, E. Lerner, and M. Wyart, Physical Review E 89, 022305 (2014).
- Salerno et al. (2012) K. M. Salerno, C. E. Maloney, and M. O. Robbins, Phys. Rev. Lett. 109, 105703 (2012).
- Lemaître and Caroli (2009) A. Lemaître and C. Caroli, Phys. Rev. Lett. 103, 065501 (2009).
- Fisher (1998) D. S. Fisher, Physics Reports 301, 113 (1998).
- Müller and Wyart (2015) M. Müller and M. Wyart, Annual Review of Condensed Matter Physics 6 (2015).
- Lin et al. (2014b) J. Lin, A. Saade, E. Lerner, A. Rosso, and M. Wyart, EPL (Europhysics Letters) 105, 26003 (2014b).
- Picard et al. (2005) G. Picard, A. Ajdari, F. Lequeux, and L. Bocquet, Physical Review E 71, 010501 (2005).
- Baret et al. (2002) J.-C. Baret, D. Vandembroucq, and S. Roux, Phys. Rev. Lett. 89, 195506 (2002).
- Hébraud and Lequeux (1998) P. Hébraud and F. Lequeux, Phys. Rev. Lett. 81, 2934 (1998).
- Picard et al. (2004) G. Picard, A. Ajdari, F. Lequeux, and L. Bocquet, The European Physical Journal E 15, 371 (2004).
- Vandembroucq and Roux (2011) D. Vandembroucq and S. Roux, Physical Review B 84, 134210 (2011).
- Shi et al. (2007) Y. Shi, M. B. Katz, H. Li, and M. L. Falk, Physical review letters 98, 185505 (2007).
- Moorcroft et al. (2011) R. L. Moorcroft, M. E. Cates, and S. M. Fielding, Physical review letters 106, 055502 (2011).
- Fielding (2014) S. M. Fielding, Reports on Progress in Physics 77, 102601 (2014).
- Lemaître and Caroli (2007) A. Lemaître and C. Caroli, arXiv preprint arXiv:0705.3122 (2007).
- Karmakar et al. (2010) S. Karmakar, E. Lerner, and I. Procaccia, Phys. Rev. E 82, 055103 (2010).
- Salerno and Robbins (2013) K. M. Salerno and M. O. Robbins, Physical Review E 88, 062206 (2013).
- Girard et al. (2010) L. Girard, D. Amitrano, and J. Weiss, Journal of Statistical Mechanics: Theory and Experiment 2010, P01013 (2010).
- Hayman et al. (2011) N. W. Hayman, L. Ducloué, K. L. Foco, and K. E. Daniels, Pure and applied geophysics 168, 2239 (2011).
- Bretz et al. (2006) M. Bretz, R. Zaretzki, S. B. Field, N. Mitarai, and F. Nori, EPL (Europhysics Letters) 74, 1116 (2006).
- DeGiuli et al. (2015) E. DeGiuli, G. Düring, E. Lerner, and M. Wyart, Phys. Rev. E 91, 062206 (2015).
- Lerner et al. (2012) E. Lerner, G. Düring, and M. Wyart, Proceedings of the National Academy of Sciences 109, 4798 (2012).
- Kruyt (2010) N. P. Kruyt, Comptes Rendus Mécanique 338, 596 (2010).
- Miguel et al. (2001) M.-C. Miguel, A. Vespignani, S. Zapperi, J. Weiss, and J.-R. Grasso, Nature 410, 667 (2001).
- Csikor et al. (2007) F. F. Csikor, C. Motz, D. Weygand, M. Zaiser, and S. Zapperi, Science 318, 251 (2007).
- Ispánovity et al. (2014) P. D. Ispánovity, L. Laurson, M. Zaiser, I. Groma, S. Zapperi, and M. J. Alava, Phys. Rev. Lett. 112, 235501 (2014).
I Appendix
I.0.1 (a) Dependence on initial conditions
Different transient behaviors can be generated by considering different initial conditions for the distribution of local stability , which we build as follows. We set initially , where is a random variable uniformly distributed in . Such initial conditions ensure that each line and column present the same mean , which reduces finite size effects Lin et al. (2014a). The dynamics is then run at fixed stress, until all sites are stabilized. We choose (broad), and (narrow), as for Fig.1 in the main text. The two corresponding distributions are shown in Fig.A.1(a).
Our predictions, including the result of Eq.(1), appear to hold true independently of the system preparation, as shown in Fig.A.1(b) testing Eq.(1) in the overshoot case. Although we did not perform a detailed measurement of the exponent in that case, we find that is indeed system size dependent, and again find .
I.0.2 (b) Finite size effects on and
Fig.A.2 shows for different system sizes and four different stress values, supporting that the value we report for in the main text, Fig.2(b), indeed approximates the true value in the thermodynamic limit.