Anatomy of the AGN in NGC 5548
During an extensive multiwavelength campaign that we performed in 2013-14 the prototypical Seyfert 1 galaxy NGC 5548 has been found in an unusual condition of heavy and persistent obscuration. The newly discovered “obscurer” absorbs most of the soft X-ray continuum along our line of sight and lowers the ionizing luminosity received by the classical warm absorber. Here we present the analysis of the high resolution X-ray spectra collected with XMM-Newton and Chandra throughout the campaign, which are suitable to investigate the variability of both the obscurer and the classical warm absorber. The time separation between these X-ray observations range from 2 days to 8 months. On these timescales the obscurer is variable both in column density and in covering fraction. This is consistent with the picture of a patchy wind. The most significant variation occurred in September 2013 when the source brightened for two weeks. A higher and steeper intrinsic continuum and a lower obscurer covering fraction are both required to explain the spectral shape during the flare. We suggest that a geometrical change of the soft X-ray source behind the obscurer cause the observed drop in the covering fraction. Due to the higher soft X-ray continuum level the September 2013 Chandra spectrum is the only X ray spectrum of the campaign where individual features of the warm absorber could be detected. The spectrum shows absorption from Fe-UTA, O iv, and O v, consistent to belong to the lower-ionization counterpart of the historical NGC 5548 warm absorber. Hence, we confirm that the warm absorber has responded to the drop in the ionizing luminosity caused by the obscurer.
Key Words.:
galaxies: individual NGC 5548 - galaxies: absorption lines - X-rays: galaxies1 Introduction
In the X-ray band,
active galactic nuclei (AGN)
are variable emitters.
The origin of this variability,
that can be even large and fast
(e.g., Matt et al. 2003),
is not fully understood yet
(see e.g. McHardy et al. 2006; Turner et al. 2009; Ponti et al. 2012).
Variable absorption of
the X-ray radiation along
the line of sight
is one of the possible explanations.
Indeed, many absorbing components,
spanning a broad range in ionization,
can be detected in AGN X-ray spectra.
Cold neutral absorption
is able to strongly suppress
the soft X-ray flux
and to change the curvature
of the X-ray
spectrum.
In recent years,
evidence for variability
due to cold X-ray absorption
in both type 1 and type 2 AGN
has increased.
In many cases
changes in the absorber
column density and/or
covering fraction
on a few hours–few years timescale
have been reported
e.g., in NGC 4388 (Elvis et al. 2004),
NGC 4151 (Puccetti et al. 2007), and
1H 0557-385 (Coffey et al. 2014).
On these same timescales,
the X-ray absorbing column density
may even drastically switch
from Compton thick to Compton thin
as observed in several type 2 AGN
e.g.
NGC 7582 (Piconcelli et al. 2007),
UGC 4203 (Risaliti et al. 2010),
and NGC 454 (Marchese et al. 2012).
This rich phenomenology
suggests that
cold gas
is present even in the
innermost region of AGN
(see Bianchi et al. 2012).
This material is probably
patchy and may belong
to the Broad Line Region
(BLR) or to a clumpy torus
(e.g., Miniutti et al. 2014).
In the best studied
Seyfert 1.8 source NGC 1365
a single cloud has been monitored
while eclipsing the central
X-ray source for a few hours
(Risaliti et al. 2009). In the last
decade, this source
has been observed in a
vast variety of spectral
appearances,
ranging from Compton thick
(Risaliti et al. 2005)
to an almost unobscured condition
more reminiscent
of a pure type 1 AGN
(Walton et al. 2014).
Absorbers at higher ionization
(the so-called warm absorbers, WA)
imprint discrete absorption lines
on 50% of type 1
AGN spectra (Crenshaw et al. 2003b).
These features,
that fall mainly
in the soft X-ray (e.g.
from
Ne ii–Ne x,
Fe x–Fe xxiv,
and O iv–O vii)
and in the
UV (e.g., O vi, Mg ii,
C ii–C iv,
and Si ii–Si iv)
domain,
are usually
blueshifted with
respect to the systemic
velocity, indicating therefore
a global outflow of the absorbing
gas (Crenshaw et al. 2003b).
In local Seyfert 1
galaxies
absorption lines
have usually a narrow
profile (FWHM km s-1).
In about 15% of optically
selected quasars
(Weymann et al. 1991)
broad absorption lines
(BAL) with a typical width
of km s-1 have been also observed
(Hamann & Sabra 2004).
In the last ten years
observational campaigns
providing simultaneous
high resolution UV
and X-ray spectroscopy
have been performed
for a handful
of local AGN
(see Costantini 2010, for a review).
In some cases
(e.g.,
NGC 4151, Kraemer et al. (2005)
Mrk 279, Arav et al. (2007); Costantini et al. (2007)
1H 0419-577 Di Gesu et al. (2013)),
it has been
established
that X-ray and UV
narrow absorption lines (NAL)
may be the manifestation
of the same outflow,
even though it is not
trivial to determine
how the X-ray and UV
absorbing gas are physically
and geometrically related.
The UV and X-ray absorbing gas
could be co-located
(e.g., Mrk 509, Ebrero et al. 2011),
with the UV absorbing components
being possibly denser clumps
embedded in a more highly ionized
wind (e.g., NGC 4051, Kraemer et al. 2012).
WAs are usually
complex multicomponent
winds spanning a broad range
in velocity and in ionization.
The lower ionization
components produce the UV lines
while the higher ionization phases
are seen only in the X-rays.
An intermediate phase
producing absorption lines
in both bands
may in some cases be present.
Variability
in the warm absorption
may in principle contribute to
the overall
X-ray variability of AGN
on different timescales.
In order
to assess the
WA variability on long
(e.g., years)
timescales
it is necessary that
high quality multiepoch
spectroscopy is available,
which is seldom the case.
A multiepoch study of the
WA has been attempted
for instance in Mrk 279
(Ebrero et al. 2010)
without finding
significant variability.
In a different case
(Mrk 841, Longinotti et al. 2010),
comparing two different
observations taken 4
years apart,
a moderate
decrease
in the WA ionization as
the continuum dims
has been observed.
An even more noticeable
long-term WA variability
has been reported in the case
of Mrk 335 (Longinotti et al. 2013),
where the emergence of an ionized
outflow that was not
historically present
has been observed
in 2009.
On shorter timescales,
changes
in the WA opacity
or ionization
have been
observed for instance in
NGC 3783 (31 days, Krongold et al. 2005)
and
NGC 4051 (few ks–few months, Krongold et al. 2007; Steenbrugge et al. 2009).
The timescale
over which absorption lines
are observed to vary
can be used
to measure the distance
of the absorbing gas
from the ionizing source
(see Crenshaw et al. 2003b).
Indeed,
for photoionized gas
in equilibrium,
the recombination
timescale
depends on
the gas number density .
Besides the distance
it is the only
other unknown parameter
in the definition of
ionization parameter
(where
is the ionizing luminosity
in the 1–1000 Ryd band).
Searching for
absorption line variability
on short timescales
and thus constraining the
location of the WA
is the main motivation
for conducting
monitoring
campaigns of AGN
(e.g., Mrk 509,
see Kaastra et al. 2012).
The knowledge of the
location is crucial
for estimating the mass
outflow rates and kinetic
luminosities associated
to these absorbers
(e.g., Crenshaw & Kraemer 2012)
and thus,
to evaluate their potential
impact on the host galaxy
environment.
| Obs. | Date | Satellites | a𝑎aa𝑎aUV flux measured by Swift-UVOT, corrected for reddening. | b𝑏bb𝑏bObserved flux in the quoted bands, as derived from our best fit model. | b𝑏bb𝑏bObserved flux in the quoted bands, as derived from our best fit model. |
|---|---|---|---|---|---|
| yyyy-mm-dd | () | () | |||
| XM1 | 2013-06-22 | 1 4 | 2.07 | 1.1 | 13.2 |
| XM2 | 2013-06-30 | 1 4 | 2.28 | 3.5 | 29.9 |
| XM3 | 2013-07-07 | 1 4 | 2.07 | 2.1 | 21.2 |
| XM4 | 2013-07-11 | 1 4 | 2.32 | 3.6 | 32.1 |
| XM5 | 2013-07-15 | 1 4 | 2.57 | 2.6 | 26.9 |
| XM6 | 2013-07-19 | 1 4 | 2.74 | 2.3 | 27.4 |
| XM7 | 2013-07-21 | 1 4 | 2.88 | 2.3 | 23.5 |
| XM8 | 2013-07-23 | 1 4 | 3.09 | 2.2 | 25.1 |
| XM9 | 2013-07-25 | 1 4 | 2.97 | 3.2 | 29.8 |
| XM10 | 2013-07-27 | 1 4 | 3.29 | 3.0 | 29.4 |
| XM11 | 2013-07-29 | 1 4 | 3.21 | 2.8 | 26.4 |
| XM12 | 2013-07-31 | 1 4 | 3.21 | 2.2 | 23.6 |
| CH1 | 2013-09-01 | 2 4 | 4.54 | 7.7 | 38.7 |
| CH2 | 2013-09-02 | 2 4 | 4.48 | 4.4 | 29.7 |
| CH3 | 2013-09-10 | 2 3 4 | 4.89 | 5.7 | 36.1 |
| XM13 | 2013-12-20 | 1 4 | 3.27 | 2.1 | 21.8 |
| XM14 | 2014-02-05 | 1 4 | 3.49 | 4.1 | 24.4 |
With this aim,
during the summer of 2013
and the winter of 2013-14
we performed
a large multiwavelength
monitoring campaign on the
bright Seyfert 1 NGC 5548.
The overview of the campaign in
presented in
Mehdipour et al. (2015, hereafter Paper I).
NGC 5548
is a prototypical
Seyfert 1 galaxy,
that has been studied
for decades
from optical
(e.g., Peterson & Wandel 1999)
to X-ray wavelengths
(e.g., Nandra et al. 1993; Iwasawa et al. 1999).
From a dynamical modeling
of the BLR (Pancoast et al. 2014),
it is inferred that
this source is observed
at an inclination angle of
and hosts a
supermassive black hole (SMBH)
of in its center.
Previously,
high resolution
UV
(Crenshaw & Kraemer 1999; Crenshaw et al. 2003a)
and X-ray
(Kaastra et al. 2000, 2002; Steenbrugge et al. 2003, 2005)
spectra
have revealed
several deep NAL
that can be ascribed
to a moderate
velocity
(=200–1200 km s-1) ionized
outflow.
Unexpectedly,
throughout
the whole 2013-14 campaign
NGC 5548 appeared
dramatically different
from the past
(e.g., from the Chandra observation of 2002, Steenbrugge et al. 2005)
being 25 times
less luminous in the soft X-rays.
Moreover,
it showed
broad, asymmetric absorption troughs
in the blue wings of
the main UV broad
emission lines
(e.g., in
Ly, C iv, N v).
In Kaastra et al. (2014, hereafter K14)
we proposed
that all these changes
can be ascribed to
the onset of
a persistent,
weakly ionized,
fast
(v5000 km s-1),
wind
(hereafter “the obscurer”).
The obscurer is located within
or just outside the BLR,
at a distance of a few light
days from the SMBH,
and possibly
has been launched
from the accretion disk.
It blocks
90%
of the
X-ray flux along
our line of sight,
thereby lowering
the ionizing
luminosity
received by
the WA.
Indeed, in this
obscured condition,
the historical
NGC 5548 WA is
still present, but
with a lower ionization.
In the X-rays it is consistent
with being 3 times
less ionized than
what was observed in 2002 (K14),
and, at the same time,
in the UV it shows
new lower-ionization
NAL
(from e.g. C ii
and C iii, Arav et al. 2014, in press).
In this paper
we use all
the
high resolution
X-ray spectra
collected during our
campaign
to
assess
what drives
the spectral changes
of
NGC 5548 on timescale
as short as few days.
This is the typical
time separation between
the X-ray observations
of the campaign.
These spectra are
suitable to investigate
the absorption variability,
because they
cover the energy band
where the main ionized
and neutral absorption
features of e.g.
oxygen and iron fall.
During the campaign
the source
was always weak
in the soft X-rays,
except
for a sudden brightening
in September 2013
(Fig. 1).
On that occasion,
we triggered
a Chandra-LETGS observation.
In the following we investigate
also the possible causes and
consequences of this
sudden brightening.
The paper is organized as follows:
in Sect. 2 we briefly
present the datasets that we use
in this analysis, and
in Sect. 3 we describe the
template spectral model that we apply
to all the datasets in Sect. 4.
Finally in Sect. 5
we discuss our results
and in Sect. 6
we outline the conclusions.
The C-statistic (Cash 1979) is used
throughout the paper,
and errors are quoted at 68
confidence level
(). In all the
spectral models presented in the
following, we use the Galactic
hydrogen column density
from Wakker et al. (2011, = cm-2).
The cosmological redshift
that we adopted for NGC 5548 is 0.017175
(de Vaucouleurs et al. 1991).The cosmological parameters are set to:
=70 km s-1 Mpc-1, =0.3 and =0.7.
2 The data
XMM-Newton observed NGC 5548 between June 2013 and February 2014
using both the EPIC cameras
(Turner et al. 2001; Strüder et al. 2001) and
the Reflection Grating Spectrometer
(RGS, den Herder et al. 2001).
The core of the
campaign
consisted of 12,
50 ks long, XMM-Newton observations that were
taken every 2–8 days
in June and July 2013.
After these, two other observations
were acquired in December 2013
and February 2014, providing
14 XMM-Newton datasets
in total.
The details of all
the observations,
that hereafter
we label
in chronological
order as XM1–XM14,
are given in Table
1.
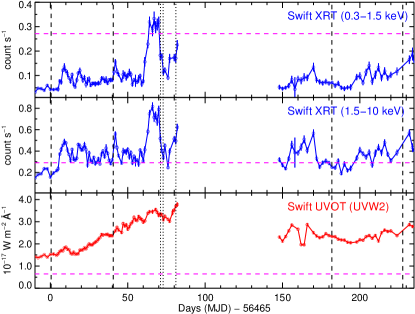
During the entire
campaign, the source was also
monitored daily
by Swift (Gehrels et al. 2004),
both in the X-rays
with the X Ray Telescope
(XRT, Burrows et al. 2005)
and in the UV with the
UV Optical Telescope
(UVOT, Roming et al. 2005).
Swift-UVOT flux measurements
in the UVW2
(=2030 Å) filter,
corrected for reddening and
for the host galaxy contribution
as explained in Paper I,
are also used in the
present analysis.
In September 2013
we triggered a Chandra observation
because
Swift observed a sudden
brightening (Fig. 1).
The observation was performed
with the Low Energy Transmission
Grating Spectrometer (LETGS, Brinkman et al. 2000)
in combination
with the High Resolution
Camera (HRC-S).
The observing time
was split in three observations
(Obs. CH1–CH3)
of 30, 67 and 123 ks respectively.
The first two were
taken on September 1st and 2nd
while the third and longest one
was taken a week later on September
10th.
Simultaneously with this observation
a higher energy spectrum was
acquired with the
Nuclear Spectroscopic Telescope Array
(NuSTAR, Harrison et al. 2013) satellite.
In the occasion of this flaring event,
no XMM-Newton observation
was available.
A detailed description
of the data reduction
procedure for all the instruments
is given in Paper I.
In the present analysis,
we fit the high resolution
RGS and
LETGS spectra.
The simultaneous EPIC-pn
and NuSTAR spectra
at higher,
less absorbed, energies
provide the continuum
baseline over which the
absorption is superposed.
We defer the reader
to Ursini et al. (2015, in press),
hereafter U15,
for a detailed
modeling of the continuum
at high energies.
As in K14,
we fitted
the EPIC-pn in
the 1.03–10.0 Å (1.24–12 keV) band
together with the
RGS in the
5.68–38.23 Å (0.32–2.2 keV)
band. Thus, the two
instruments overlap
in a small band
allowing to check
for possible
intercalibration
mismatches.
In all our fits
the intercalibration
factor used in K14
( 1.027) was
adequate.
Due to an incomplete
correction
for the gain of the EPIC-pn
(not corrected in the
SAS v13 we used, see Paper I),
the Fe K line appears blueshifted
(see Cappi et al.
in prep. for a detailed discussion),
which we correct for with
an artificial redshift
for these spectra.
However,
this solution leads
to a poor fit near the energy
of the gold M-edge of the telescope
mirror.
For this reason,
we omitted
the interval 5.0–6.2 Å (2.0–2.5 keV)
from all our fits.
We fitted the
Chandra-LETGS spectra
between 2 and 40 Å (0.3–6.2 keV).
We used the NuSTAR spectrum
simultaneous to CH3
in the 0.2–2.5 Å (5–60 keV) band.
Since Chandra-LETGS and NuSTAR
were consistent
in the overlapping
band we did not
apply any
intercalibration correction
in the joint fit.
3 The template model
In order to assess
the variability of NGC 5548,
we used the same
template model to fit all the spectra.
This template is
close to the model adopted in K14,
differing from it only in
the modeling
of the “soft-excess”
(Arnaud et al. 1985) component.
We performed
all the spectral
analysis
with the latest version of SPEX
(v. 2.05, Kaastra et al. 1996).
In our template model
we considered
the cosmological redshift
and the Galactic absorption.
For the latter,
we use a collisionally ionized
plasma model (HOT), with a nominal
temperature of 0.5 eV for a neutral
gas.
Our continuum model includes
a primary and reflected power-law,
on top of which lies
a soft-excess component.
In NGC 5548 the reflection
is consistent to be constant
(see U15) thus producing
a steady narrow Fe K line
(see Cappi et al., in prep.).
In the present analysis
we used the reflection
parameters obtained in U15
(=1.9 and =300 keV
for the photon index and the high energy
cutoff of the primary power law)
in the SPEX reflection model
REFL, which includes both a
Compton reflected continuum
(Magdziarz & Zdziarski 1995)
and the Fe K line
(Zycki & Czerny 1994).
To adjust the
fit of the Fe K line, we let the normalization
of REFL free to vary
within the errors of the
U15 model.
When using EPIC-pn data,
we applied to REFL an artificial blueshift
(z=–1.25)
to correct
for an apparent centroid shift
of the Fe K line
(see also Sect. 2).
The X-ray obscuration affects
the spectrum mainly below 2.0 keV
and makes therefore the detection
of the soft-excess
from X-ray spectra elusive.
Nevertheless,
this component
contributes to the continuum
in the band where most
of the absorption is
seen, thus
its modeling
is critical
for evaluating
the absorption
variability.
In Paper I we show that
the soft-excess component is
likely to be the tail
of a component extending from UV to soft X-rays,
which is produced
by Compton up-scattering of the disk photons
in a warm, optically thick plasma.
Therefore, in this framework,
the UV emission (which is not affected by the obscuration)
is a proxy for the X-ray soft-excess.
We used COMT (based on Titarchuk 1994)
to model the soft-excess component
and we used the UV flux ()
listed in Table 1
for each observation to set the normalization.
The 0.3–2.0 keV luminosity
of the soft-excess is given by:
,
valid for the range of observed UV fluxes used here
(Mehdipour, private communication).
Hence, consistently with the
long-term variability analysis
in Mehdipour et al. (in prep.),
we kept the COMT component
constant in shape
in all the fits,
with its 0.3-2.0 keV
flux varying according to the UV flux.
We use the mean values
given in Paper I
for the other COMT parameters,
namely
the Wien temperature
of the incoming photons
( eV),
the temperature
( keV),
and the optical depth
() of the plasma.
A detailed
modeling of the X-ray emission features
of NGC 5548 will be presented in Whewell et al,
in preparation.
The X-ray narrow
emission lines
are consistent with being
constant during the
XMM-Newton campaign
and thus could be kept
frozen in all our fits.
For the narrow lines
we the values
obtained in the
K14 fit,
while for the
broad emission features we
used the fluxes given in
Steenbrugge et al. (2005).
In K14 we found that
the obscurer
causing the persistent flux dimming
of NGC 5548 comprises two ionization phases
(hereafter labeled as “warm”
and “cold”).
The warm phase is
mildly ionized ()
and has a larger covering
fraction
(e.g., ,
, K14)
and a lower column density
(e.g., cm-2,
cm-2, K14)
than the cold phase
which is consistent with being neutral.
In SPEX, we used
a photoionized absorber model (XABS)
for both the obscurer components
and we adopted for them
the same kinematics
(outflow and broadening velocity)
used in K14.
The ionization
balance for both the obscurer
components is computed using
the intrinsic, unabsorbed spectral
energy distribution (SED).
Finally,
we included six more XABS components
in the template model to account
for the lower ionized counterpart
of the historical NGC 5548 warm absorber.
The ionization balance
for all the WA components
is computed using
a SED filtered
by the obscurer.
We label the WA components with
capital letters, from A to F
as the ionization increases.
As in K14,
we assumed that
the WA varies
only in ionization
when the ionizing SED
illuminating it changes.
Indeed,
from UV spectra
we know that the kinematics
of the WA components has not changed
over at least 16 years,
and Ebrero et al. (in prep.)
shows no historical evidence
for total hydrogen column
density variations.
We kept therefore the kinematics
and the equivalent
hydrogen column density
of all the WA components
frozen to the parameters
obtained from
the unobscured 2002 spectrum
(see the updated fit
in Ebrero et al., in prep.).
In the following
we apply this template model
to all the XMM-Newton and Chandra datasets of
our monitoring campaign.
In all the fits,
the free parameters
are the slope and the normalization
of the primary power law,
the column density, and the
covering fraction of
the two obscurer phases.
Besides these, in the fits
of those datasets where
either the continuum
or the obscurer parameters
change significantly,
we also allow the ionization
parameters of the
warm absorber to vary.
The variability
in flux of the
soft excess component
was determined directly
from the Swift UV flux,
as explained above.
4 Fitting the variability


| Obscurer components a𝑎aa𝑎aFor the warm obscurer: . For the cold obscurer: | WA components b𝑏bb𝑏bFor Obs. CH2+3, XM14, and K14 the ionization parameters given are the output of the iterative fitting procedure described in Sect. 4.2. | |||||||||||
| Obs | b𝑏bb𝑏bFor Obs. CH2+3, XM14, and K14 the ionization parameters given are the output of the iterative fitting procedure described in Sect. 4.2. | c𝑐cc𝑐cPhoton index of the primary continuum. | d𝑑dd𝑑dColumn density of the obscurer components. | c𝑐cc𝑐cPhoton index of the primary continuum. | d𝑑dd𝑑dColumn density of the obscurer components. | e𝑒ee𝑒eCovering fraction of the obscurer components. | e𝑒ee𝑒eCovering fraction of the obscurer components. | e𝑒ee𝑒eCovering fraction of the obscurer components. | e𝑒ee𝑒eCovering fraction of the obscurer components. | e𝑒ee𝑒eCovering fraction of the obscurer components. | e𝑒ee𝑒eCovering fraction of the obscurer components. | C/Expected Cf𝑓ff𝑓fIonization parameters of the warm absorber components. |
| ( cm-2) | ( cm-2) | (log erg cm s-1) | ||||||||||
| XM1 | 1.5 ∗∗**∗∗**Lower limit of the fitting range. | \rdelim{1210pt 0.33∗ | 1.06∗ | 1.70∗ | 1.91∗ | 2.48∗ | 2.67 \rdelim}1210pt | 384/334 | ||||
| XM2 | 422/345 | |||||||||||
| XM3 | 1.5 ∗∗**∗∗**Lower limit of the fitting range. | 379/337 | ||||||||||
| XM4 | 406/346 | |||||||||||
| XM5 | 435/335 | |||||||||||
| XM6 | 1.5 ∗∗**∗∗**Lower limit of the fitting range. | 415/341 | ||||||||||
| XM7 | 1.5 ∗∗**∗∗**Lower limit of the fitting range. | 394/340 | ||||||||||
| XM8 | 389/339 | |||||||||||
| XM9 | 390/340 | |||||||||||
| XM10 | 434/344 | |||||||||||
| XM11 | 399/340 | |||||||||||
| XM12 | 1.5 ∗∗**∗∗**Lower limit of the fitting range. | 447/338 | ||||||||||
| CH1 | 1.83 ∗*∗*Frozen parameters. | 17 ∗*∗*Frozen parameters. | 0.38 ∗*∗*Frozen parameters. | 1.11 ∗*∗*Frozen parameters. | 1.75 ∗*∗*Frozen parameters. | 1.96 ∗*∗*Frozen parameters. | 2.53 ∗*∗*Frozen parameters. | 2.72 ∗*∗*Frozen parameters. | 149/152 | |||
| CH2+3 | 0.38 | 1.11 | 1.75 | 1.96 | 2.53 | 2.72 | 530/311 | |||||
| XM13 | 1.5 ∗∗**∗∗**Lower limit of the fitting range. | 0.33 ∗*∗*Frozen parameters. | 1.06 ∗*∗*Frozen parameters. | 1.70 ∗*∗*Frozen parameters. | 1.91 ∗*∗*Frozen parameters. | 2.48 ∗*∗*Frozen parameters. | 2.67∗*∗*Frozen parameters. | 415/340 | ||||
| XM14 | ∗*∗*Frozen parameters. | 0.39 | 1.12 | 1.76 | 1.97 | 2.54 | 2.73 | 485/342 | ||||
| K14 ∗∗∗***∗∗∗***Best fit parameters derived in K14 for the co-added XM1–12 spectrum. | 0.33 | 1.06 | 1.70 | 1.91 | 2.48 | 2.67 | ||||||
4.1 The core of the campaign: from June to August 2013
The XMM-Newton monitoring campaign began on June 22nd,
catching NGC 5548 at the lowest flux level
observed in any of the high resolution
spectra of the campaign
( erg s-1 cm-2,
for Obs. XM1, see Table 1).
Throughout all the summer of 2013,
(Obs. XM2–XM12)
the 0.3–2.0 keV flux remained
quite stable (within
a factor 1.3)
around an average level
of erg s-1 cm-2.
The stacked XMM-Newton spectrum
of Obs. XM1–XM12
is published in K14.
In that paper
we determine
consistently
both the average obscurer parameters
and the average obscured
SED illuminating the WA. Accordingly,
we compute the ionization balance
and the ionization parameters
for all the WA components.
We fitted Obs. XM1–XM12 assuming
the average WA determined in K14.
Hence, only the continuum
and the two obscurer phases were
left free in the fits.
Furthermore,
in the fits we set a lower limit
for the continuum slope
() to be
consistent with what was observed
during the campaign at higher
energies and with the
analysis repeated by Cappi et al,
in preparation. Indeed,
when fitting such absorbed spectra
below 10 keV,
a flatter intrinsic continuum
becomes degenerate with a stronger
obscuration. The assumption on the
slope aimed at minimizing this ambiguity
and, however,
did not affect the
final results
(as we checked
a posteriori,
see below).
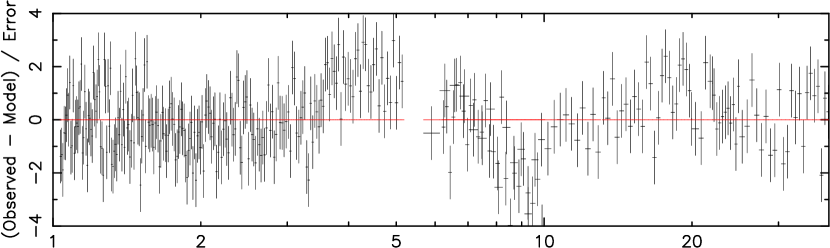
As a first step we fit the spectra
allowing for both the obscurer phases just one
of the parameters (column density,
and covering factor) free.
When only the covering fractions are
allowed to vary the fit displays
strong residuals, for instance
the negative residuals just below 10 Å (See Fig. 2, first panel).
In the observation
where they are more evident (Obs. XM5)
the C-statistic
is 600 for an expected value of 340.
When we fixed the covering factors
but instead allowed the column densities to vary,
more systematic residuals
between 10 and 20 A are apparent
(Fig. 2, second panel).
Therefore, we
conclude that the two phases of the obscurer
have to be variable both in column density and the
covering fraction to adapt the template model
to all the individual XMM-Newton observations.
We tested however the
possibility that the obscurer
varies in ionization rather
than in covering fraction.
For most of the datasets,
a statistically acceptable
fit can be
achieved keeping
the covering fraction
of both the obscurer phases
frozen to the average values
derived in K14
and allowing the ionization
parameter of the warm obscurer
to vary instead.
However,
with these constraints
the best fit
prefers an almost
neutral obscurer
(e.g. ),
which would be
too lowly ionized
to produce,
for instance,
the broad C iv
absorption lines
that are seen in the UV.
Hence, we discarded these
fits.
The final best fit parameters are listed in Table
2.
In a couple of cases, the
fit stopped at the lower limit we had imposed
for . We checked how much further the
fit of these datasets could
be improved allowing an even flatter
continuum. In all cases,
releasing the spectral index
resulted in a negligible improvement
of the fit (e.g., for Obs. XM1,
for =1.46).
The RGS spectra
of the individual
observations are rather noisy
and the residuals do not
show any hint of
unaccounted WA features.
However,
as a final test,
we checked
how sensitive
are the best fits
to possible
variations in the WA
ionization.
We attempted
to refit
each observation
setting
the WA ionization parameters
according to the
variation from the average
of the continuum
normalization.
All the fits
were insensitive
to this variation,
(e.g., )
with the free parameters
remaining the same
within the
errors.
Therefore,
we concluded a posteriori
that assuming a constant WA
in the core of the XMM-Newton campaign was reasonable.
We show in Fig. 2
(third and fourth panel)
an example of best fit
(Obs. XM5).
4.2 The flare of September 2013 as seen with Chandra-LETGS and NuSTAR


In September 2013
we triggered a series of 3
Chandra-LETGS observations because
it seemed that NGC 5548 was recovering
from the obscuration. Indeed,
in a few days, the X-ray flux
in both the Swift-XRT bands rose
above the level
measured at unobscured epochs
and remained steady
for about a week. This brightening was
however a short-lived flare, and after
a few days the source fell again to
the typical low flux level
of the XMM-Newton campaign
(Fig. 1).
Our triggered
Chandra-LETGS observations missed the
peak of the flare. The first
two observations
were taken during its declining tail,
while a week later
the third one
caught a smaller
rebrightening.
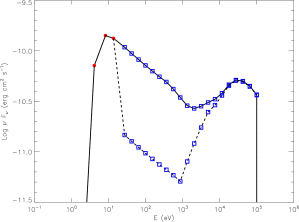
To understand
if and how
the absorbing components
had responded
to these continuum changes
we needed to use
in the
photoionization modeling
of the obscurer
a SED
representative
of NGC 5548 during the flare
(Fig. 3, solid line).
To construct it,
we used the Comptonization
model of Paper I
which extends
from the UV
to the soft X-rays.
At the same time,
NuSTAR provided
the continuum slope
at high energies.
In the UV
we took the model values
corresponding to
Å,
Å Å.
We then interpolated 20 data points
in the model between
0.03 and 100 keV.
Finally, we cut off the SED
at low energies
(below 0.01 Ryd).
We derived consistently
the obscurer parameters
and the WA ionization parameters
using the same
iterative method of K14.
At each iteration of this
fitting routine
new obscurer parameters
are fitted. Next,
the new obscured continuum
is used as the ionizing SED
in the photoionization modeling
of the six WA components.
The new ionization
parameters are assigned
by rescaling those observed
in the unobscured spectrum
of 2002 to the level
of the current obscured continuum.
Explicitly,
at the Nth iteration
.
Finally, the ionization
balances for the new ionization parameters
are recomputed before moving to the
next iteration. The final outputs
of this procedure are the obscurer parameters,
the obscured SED illuminating the WA,
and the rescaled WA ionization parameters.
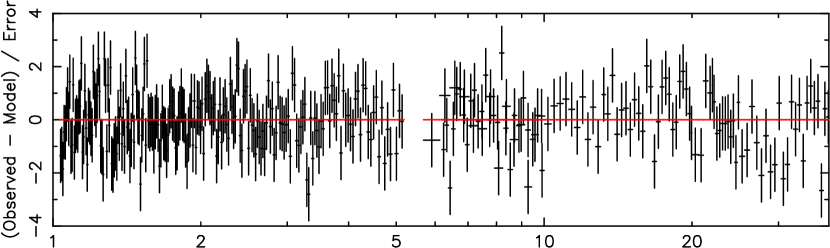
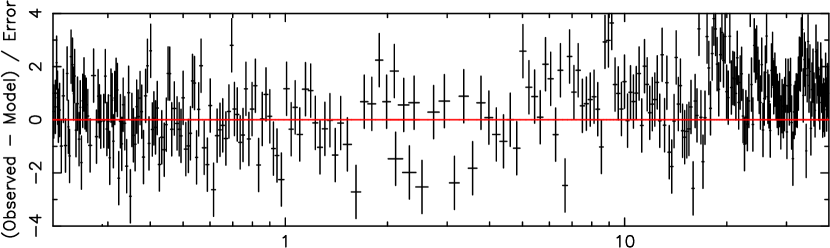
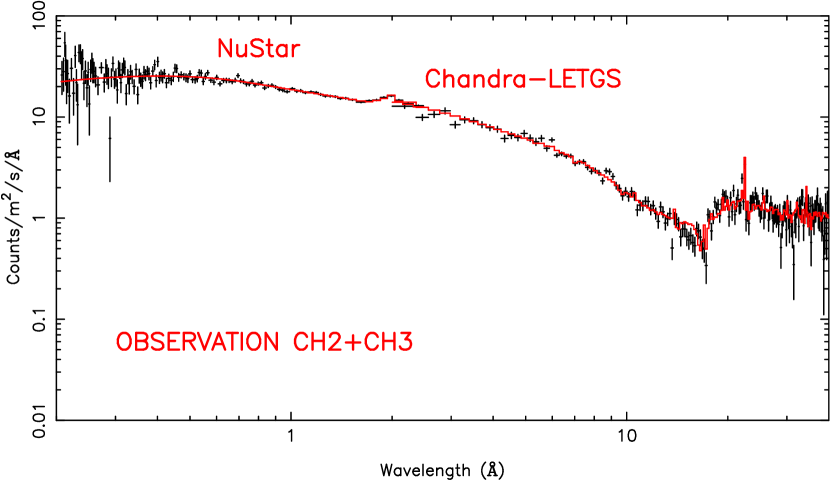
At first,
we dealt with the third
and longest Chandra-LETGS spectrum (Obs. CH3)
and we fitted it jointly
with the simultaneous
NuSTAR spectrum. We started with
a few iterations where
only the continuum
was allowed to vary.
However, since
in this way the fit was left
with large residuals
(C/Expected C=846/307, Fig. 4, first panel)
we released
first the covering fractions
(Fig. 4, second panel)
and in turn the column densities
of both the obscurer phases
(Fig. 4, third panel).
Once we achieved the best fit,
we applied it
to the other two Chandra-LETGS spectra,
for comparison.
For obs. CH1,
the fit tends
to steepen the continuum
up to .
In contrast,
we could easily fit Obs. CH2 just
by renormalizing the model.
Therefore we decided
that we can stack observations CH2 and CH3,
and thus increase the signal-to-noise ratio
of the spectrum.
We fitted this stacked
spectrum
(hereafter labeled
as Obs. CH2+3)
together with NuSTAR
using the iterative procedure
just described.
The final
best fit model
is shown
in Fig. 4
(fourth panel)
and the final obscured SED
produced in the iterative
fitting is plotted in Fig.
3, dashed line.
Using the above best fit,
we tested whether
the difference in photon index
for observation CH1 could be due
to changing properties of the obscurer.
If we keep
the continuum shape frozen,
the best fit
prefers zero covering fraction
for the cold obscurer.
For
this dataset,
we favor
this solution
because a large
variation of the continuum slope
would be inconsistent with
what NuSTAR and INTEGRAL
have shown
for the whole campaign (see U15).
All the best fit parameters
for the Chandra observations
are shown in Table 2.
Compared to the spectra of the core of
the campaign,
the Chandra spectra
require both a steeper continuum
()
and a lower covering fraction
of the warm obscurer ( ).
However,
in principle,
it is possible that a change
in the ionization state
of the obscurer mimics
a drop in the
covering fraction.
The data quality is not sufficient
to fit the ionization parameter,
therefore
we refitted the spectrum
with the ionization parameter
of the warm obscurer expected
if it responds immediately to flux changes.
We used the UVW2 flux to calculate
the expected increase in ionization parameter.
In the fit we used the
covering fractions as given in K14.
With these constraints
the resulting fit is statistically
worse (C/Expected C=647/311)
and shows larger positive
residuals in the Chandra-LETGS band.
Leaving the ionization parameter
of the warm obscurer
free, a better fit is derived,
but the obtained ionization parameter
()
is unrealistically high
(100 times than the
average value)
considering the increase
by only a factor 2
in the UVW2 flux
during the flare.
Therefore, we can exclude
that a change in the
ionization of the obscurer
is the dominant cause
of the observed flare.
During
the XMM-Newton campaign,
the discrete features of the WA
are always blended
with the obscured continuum
and not detectable.
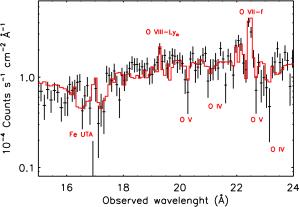
During the Chandra observation
the source was about twice
as bright, and some WA signatures
are visible in the stacked CH2+3 spectrum
(Fig. 5).
These features are consistent
with the WA model computed
via our iterative procedure.
The broad trough
at 16 Å is a blend of
unresolved transition array (UTA)
from several ionized iron species
Between
20 and 24 Å some O iv-O v
absorption lines
are present.
In table 3,
we list which of
the O iv and O v
lines predicted by our WA model
contribute to each
feature.
The WA comprises 6 ionization
components that could be
distinguished thanks
to the excellent data quality of the
2002 spectrum.
Here, the lower
statistics does not
allow to overcome the blending
among the components.
| Ion | WA component | Outflow velocity | a𝑎aa𝑎aPredicted wavelength, considering the cosmological redshift and the blueshift due to the outflow. | b𝑏bb𝑏bLine optical depth. |
| km s-1 | Å | |||
| O v | C | 1148 | 20.23 | 27 |
| B | 547 | 20.27 | 7 | |
| D | 254 | 20.29 | 3 | |
| E | 792 | 20.26 | 1 | |
| O iv | B | 547 | 21.04 | 3 |
| C | 1148 | 21.00 | 2 | |
| O v | C | 1148 | 22.67 | 143 |
| B | 547 | 22.71 | 34 | |
| D | 254 | 22.73 | 16 | |
| O iv | C | 1148 | 23.04 | 10 |
| B | 547 | 22.08 | 5 |
4.3 The end of the campaign: the observations of December 2013 and February 2014
In the last two
XMM-Newton observations of the campaign,
NGC 5548 was again at the same flux level
of summer 2013.
Therefore,
at first we attempted to fit them
using again the same WA
of the average spectrum.
The parameters of the
continuum and of the two
phases of the obscurer
were free.
This attempt
resulted
in a satisfactory fit for XM13,
while for Obs. XM14,
we obtained
a high column density
for the cold obscurer
( cm-2)
largely inconsistent
with what was observed
throughout the campaign.
Thus,
we attempted to refit
this dataset
freezing the cold
column density
to the average value
measured
in the previous observations.
This resulted
in negligible
covering fraction
for the cold obscurer
( ) and
in a flatter continuum
( instead of
1.7).
This lower value of
is also similar
to the other values
measured at this luminosity
(Fig. 8).
For these reasons,
we considered
this
solution more physically
plausible.
We note
that for this
dataset a solution
with a negligible covering fraction
of the cold obscurer and
a flatter continuum is found
also in U15 when including
in the fit INTEGRAL data at
higher energies.
Considering
the large change in the obscurer,
also for this observation
we used our iterative method
to determine the ionization of the WA
(for details see Sect. 4.1).
We built
the SED for Obs. XM14 interpolating
the Comptonization model of Paper I
repeating all the steps
already described in Sect. 4.1.
In this case, the slope of the continuum
at X-ray energies is provided
by the fit of the EPIC-pn data.
Starting from the solution
just described,
the fit converged
in a few iterations.
We also made
some iterations where
the ionization parameter
of the warm obscurer
was left free.
However,
since it was not possible
to constrain it,
we finally kept
it frozen
to the value found in K14
(see Sect. 3).
We adopt the final
result of
the iterative routine
as our best-fit model.
The parameters
resulting from this exercise
are outlined in Table
2.
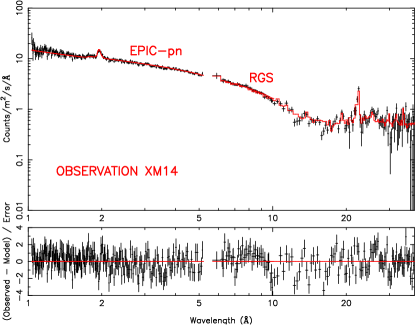
We show the final best-fit
model for Obs. XM14 in
Fig. 6.
The final WA model
that we found is only
slightly different
from the average one.
The residuals
of the best-fit model
display some
possible features at 10.3 Å and 12.3 Å which
are close to the expected
wavelength of the
Ne ix-K edge
(10.54 Å)
and Ne X-Ly (12.34 Å) respectively.
We checked if adding
additional absorbing
column density in
Ne ix-Ne x
could improve the fit.
For this, we used the SLAB
model in SPEX, that allows
us to fit a single ionic
column density regardless
of the ionization balance with the
other ions.
We found however that this
additional component
is not required
by the fit ().
5 Discussion
5.1 The short-term variability
During our extensive monitoring campaign
in 2013 and early 2014
NGC 5548 was always obscured.
In this analysis
we have applied
the model developed in K14
for the average spectrum
of the core of the campaign
to all the individual observations,
with the aim of understanding
how the source
varies.
When both the intrinsic continuum
and the obscurer are allowed to vary,
the model is able to
explain the variability
on the
2 days–8 months
timescale sampled in the
monitoring campaign.
The obscuring
material that is causing the
soft X-ray flux depression of NGC 5548 varies along our line of sight,
both in column density
and in covering fraction.
The scenario proposed by K14,
that the source is obscured
by a patchy wind,
is consistent
with our variability findings.
In this framework,
the variability of the obscuration
may well be due to several reasons,
e.g. motion across the line of sight
and changing ionization
with continuum variability.
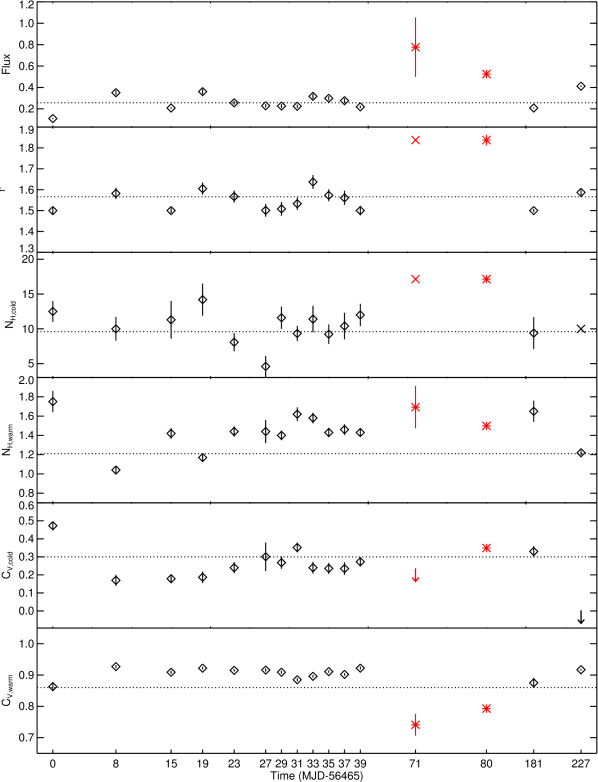
The best fit parameters
for the continuum and
the two phases of the obscurer
are displayed
in Fig.7
as a function of time.
During the core
of the XMM-Newton campaign
(Obs. XM1–XM12)
the source was steadily
obscured
and the variability in flux
was relatively small
( 27%).
The only clear outlier
with a flux significantly
different from the average
is Obs. XM1.
The values we found
for the warm obscurer
parameters
(Fig. 7
4th and 6th panel)
deviate
from those found
in K14
the co-added XM1–XM12
spectrum.
This is due to our
different modeling of
the soft-excess, that
dominates the continuum
in the band where
the absorption
from this component
is more effective.
In our modeling
the Comptonized
soft-excess,
whose normalization
is set by the UV flux
measured by Swift for
each observation,
is always more luminous
( erg s-1)
than the phenomenological
blackbody fitted in K14.
Throughout
the core of the campaign,
the intrinsic continuum
is fairly constant in shape
(with a standard deviation
of the spectral index
)
and slightly variable in normalization
(,
for the soft-excess and the
power law component,
respectively).
For the obscurer,
the cold component
was the most variable
(
and ).
In contrast,
for the warm component
the covering fraction is stable
()
and the column density
shows rather small variability
().
The large deviation
from the average of the
cold covering fraction
suggests that
the obscurer inhomogeneity,
that is possibly
dominated by the cold phase,
may have caused most of
the variability observed
during this phase
of the campaign.
In this paper
we have also presented
the Chandra-LETGS datasets
that were acquired
in September 2013 when
NGC 5548 underwent a two-week
brightening.
With respect
to the core of the campaign
changes in both
the continuum
and the obscurer
are required to fit
these spectra.
At the time
of the Chandra observation, the UV flux
measured by Swift,
which in our interpretation
is a tracer
for the soft X-ray excess,
was the highest of the whole
campaign.
At the same time,
the continuum at hard X-ray
energies
increased in flux
and became steeper.
For both observations
the warm obscurer component
has a significantly
lower covering fraction.
In the first
observation
also the covering fraction
of the cold component is lower.
As pointed out
in Sect. 4.2,
a variation in the obscurer
ionization alone is
insufficient to explain
to observed variation
in spectral shape.
The decrease
in covering fraction,
in principle,
can be due
either to a local
thin patch of the
obscurer
passing in our line of
sight at the moment of the
Chandra or
to a geometrical
change of the UV/soft
X-ray continuum source
behind the obscurer.
The former possibility,
although it cannot be
excluded, would however
require that the intrinsic
continuum and the obscurer
change properties in
synchrony, which seems
ad hoc.
In the Comptonization
model of Petrucci et al. (2013),
the UV/soft X-ray spectrum
is supposed to be produced
via Comptonization
of the UV disk photons
in a “warm” ( 1 keV)
and moderately thick
()
corona.
A “hot” corona,
with higher temperature
( 100 keV)
and smaller optical depth
( 1),
will in turn Compton upscatter
these UV/soft X-ray photons
to hard X-ray energies.
In this interpretation,
an increase in physical size
of the warm corona,
while naturally augmenting
both the UV and the soft X-ray flux,
would also result in a drop
of the observed
obscurer covering fraction.
Moreover,
the increase
in the UV/soft X-ray photon flux
will more effectively cool the
hot corona,
hence producing a steeper
hard X-ray spectrum
which is in agreement with
the observation.
Due to increased
soft X-ray flux
in the
Chandra observations
some discrete
WA features
(Fe UTA, O iv–O v)
became evident in the spectrum.
These are
the only detectable WA signatures
in any X-ray
spectrum of our campaign.
These features
are best fitted by a
WA which has a
significantly lower
degree of ionization
than what is observed
in the unobscured 2002 spectrum.
Like K14, for all the WA components
we found best fit ionization parameters
which are 0.40 dex lower than
the 2002 values ( =
0.78, 1.51, 2.15, 2.36, 2.94, and 3.13).
This means
that the ionizing luminosity received
by the WA decreased by a factor of
4. Thus,
our analysis confirms the
K14 finding. The decrease
in the WA ionization,
that is seen also in the UV
(Arav et al. 2014)
is explained
when the newly discovered
obscurer is located between
the nucleus and the WA.
In this geometry,
the obscurer shadows the
central source and
prevents most of the ionizing
flux from reaching
the warm absorber.
The absorbers in NGC 5548 changed again
in the last observation
of the
campaign, namely Obs. XM14.
We found that
in this dataset,
the covering fraction
of the cold obscurer
became negligible.
At the same time,
the continuum above 2.0 keV
is similar to what is observed
throughout the XMM-Newton campaign while the soft-excess
component is only slightly higher.
Thus,
the most likely cause of
the spectral changes observed
in this dataset is again
the inhomogenity
of the obscuration.
Variability
in the continuum
and obscurer parameters
is also noticed in the
U15 analysis of the
six XMM-Newton and
one Chandra observations
that were acquired
simultaneously
with a higher energy
observation.
However, the parameters
obtained fitting
the EPIC-pn
jointly with RGS
as done here
are not directly comparable
with those obtained
fitting the EPIC-pn
jointly with
NuSTAR and/or
INTEGRAL, as done
in U15.
This is both
because of cross-calibration
issues between
the instruments
and of differences
in the analysis.
In particular,
as noticed
also in U15,
RGS and EPIC-pn
are mismatched
in flux in the
overlapping band
as a function
of energy
(e.g., Detmers et al. 2009).
On the other hand,
NuSTAR spectra
are systematically
steeper
than EPIC-pn spectra
(
see Cappi et al., in prep).
In the present analysis
we consider also the ionized phase
of the obscurer (K14),
while U15 use two purely neutral
components. This can
affect the broadband curvature
of the model. Moreover
U15 has an additional
degree of freedom in the
high-energy cutoff of the
continuum.
For all these reasons,
the only meaningful comparison
is among the overall
trend of the parameters.
Even taking into account
the differences between
our analysis and the one
presented in U15
the parameters
trends that we discuss
below still hold.
5.2 What drives the variability?
To understand
if there are
some systematic
factors
driving the
short-term variability
of the source,
we looked
for correlations among
the best fit parameters
and the unobscured
flux measured
for the 16 datasets
presented here.
We used the
hard X-ray flux in the
5.0–10.0 keV band
and the UVW2 flux
listed
in Table 1
as tracers of the
intrinsic continuum,
as they are
almost unaffected
by the obscuration.
Even considering these
unabsorbed bands,
the range of flux
sampled
in the monitoring
campaign is narrow
(a factor of 2),
with the only outliers
at lower and higher
flux being Obs. XM1
and Obs CH2+3.
Therefore,
to evaluate
the reliability
of any correlations
we checked if
it is still holding
when removing these
two data points
from the computation
of the Pearson
correlation
coefficient.
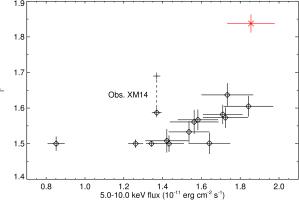
In Fig. 8
we show that
the best fit continuum slope
steepens as the hard
X-ray flux increases.
For the complete
sample the correlation
is extremely significant.
The Pearson correlation
coefficient is
implying a probability
for the null hypothesis.
When excluding Obs. XM1
and Obs. CH2+3 from the
computation,
the degree of correlation
still remains significant
(=0.68,
=1%).
This trend
has been
already noticed in the past
for NGC 5548 in Kaastra et al. (2004)
and has been also reported
in other Seyfert galaxies
(e.g., MCG 6-30-15 Shih et al. 2002),
with different interpretations
(see e.g., Ponti et al. 2006; Giacchè et al. 2014).
In the same Fig. 8
we show also that
for Obs. XM14,
the higher value of
that
would be required
by a fit including
a thick cold obscurer
(that we rejected,
see. Sect. 4.3)
is inconsistent with
the correlation
valid for all
the other datasets.
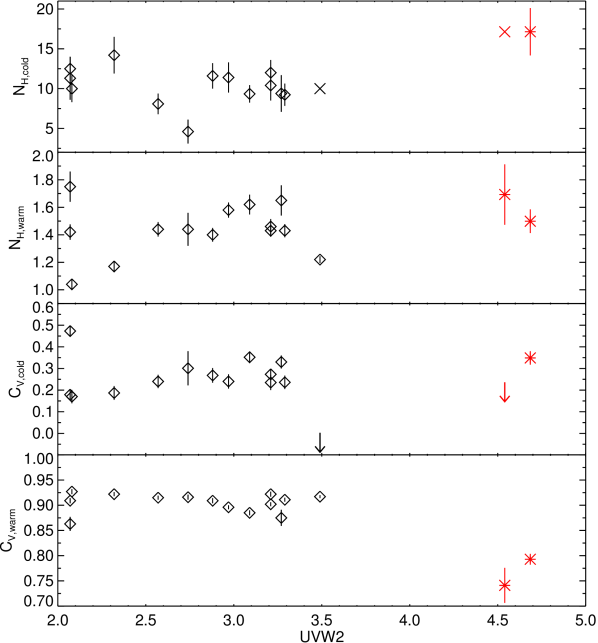
In Fig. 9
we plot the parameters
of both the obscurer
phases as function
of the UVW2 flux.
The only parameter
showing a possible trend
with the intrinsic
continuum is the
warm covering factor.
Namely, the drop
observed during the
Chandra observations
may be the tail
of a mild decreasing
trend visible also for
the XMM-Newton data
points (Fig. 9,
bottom panel).
Formally, when the two Chandra data points
are included in the computation
a significant correlation
(,
=1%) is present.
When considering only the
XMM-Newton sample,
the trend is only qualitative
(
=25%).
In Sect. 5.1
we have suggested that the
drop in covering fraction
observed during the September 2013
flare is due to an increase
in the size of the
soft X-ray/UV source.
A clear correlation between
the warm covering fraction and intrinsic
continuum, supported
by more numerous data points
at different flux values,
would favor the hypothesis
that this is a systematic
effect producing
at least part of the
observed covering fraction
variability.
This
trend is not apparent
for the cold covering fraction.
This could be due to
a higher degree of inhomogenity
in the cold phase that would
also explain its larger
variability in covering fraction
(e.g., it went
from 0.47 in
Obs XM1 to 0
in Obs. XM14).
In conclusion,
a combination
of changes
in the continuum
and in the obscurer
physical parameters
is required
to explain the short-term
spectral variability
of NGC 5548 during
our 2013-2014 campaign.
The lack of correlation
between the intrinsic continuum
(as traced by the UVW2 flux)
and obscurer parameters
indicate that the obscurer
must physically
change properties
independent on the
source flux level.
The case of the September 2013 spectrum
suggests that the soft X-ray
emitting region change geometry
as the flux increases.
This could be a systematic effect
contributing to the overall covering
fraction variability.
6 Summary and conclusions
During the multiwavelength monitoring campaign that we performed in 2013-2014 for the Seyfert 1 galaxy NGC 5548, the source had a soft X-ray flux well below the long-term average, except for a two-week long flare in September 2013. In K14, we have ascribed this condition to the onset of a persistent, weakly-ionized but high-velocity wind that blocks 90% of the soft X-ray flux and lowers the ionizing luminosity received by the WA. Thus, in this condition, the normal WA that was previously observed in this source is still present, but with a lower ionization. In this paper we fitted all the high-resolution XMM-Newton and Chandra datasets that were taken during the campaign with a model that consistently accounts for a variable continuum, the newly discovered obscurer and the new ionization conditions of the historical WA. We found that:
-
1.
On the timescales sampled in the monitoring campaign (2 days–8 months) both the intrinsic continuum and the obscurer are variable. The obscuring material varies both in column density and in covering fraction. This rapid variability is consistent with the picture of a patchy wind proposed by K14.
-
2.
The Chandra spectra that were taken just after the peak of the flare in September 2013 are explained by both an increase and a steepening of the intrinsic continuum and a drop in the obscurer covering fraction. The latter is likely to be due to a geometrical change of the soft X-ray continuum source behind the obscurer.
-
3.
The Chandra spectra of September 2013 show absorption from Fe-UTA, O iv and O v, consistent with belonging to the lower-ionized counterpart of the historical NGC 5548 warm absorber. These are the only individual WA features in any X-ray spectrum of the campaign.
-
4.
A positive correlation between the X-ray continuum slope and the observed 5.0–10.0 keV flux holds for both the XMM-Newton and Chandra datasets.
-
5.
The addition of the two Chandra points produce a formal anticorrelation between the warm obscurer covering fraction and the intrinsic continuum luminosity, as traced by the observed UVW2 flux.
Acknowledgements.
This work is based on observations obtained with XMM-Newton an ESA science mission with instruments and contributions directly funded by ESA Member States and the USA (NASA). This research has made use of data obtained with the NuSTAR mission, a project led by the California Institute of Technology (Caltech), managed by the Jet Propulsion Laboratory (JPL) and funded by NASA. This work made use of data supplied by the UK Swift Science Data Centre at the University of Leicester. We thank the Chandra team for allocating the LETGS triggered observations. We thank the International Space Science Institute (ISSI) in Bern for their support and hospitality. SRON is supported financially by NWO, the Netherlands Organization for Scientific Research. M.M.acknowledges support from NWO and the UK STFC. This work was supported by NASA through grants for HST program number 13184 from the Space Telescope Science Institute, which is operated by the Association of Universities for Research in Astronomy, Incorporated, under NASA contract NAS5-26555. M.C. acknowledges financial support from contracts ASI/INAF n.I/037/12/0 and PRIN INAF 2011 and 2012. P.O.P and F.U. acknowledge funding support from the CNES and the french-italian International Project of Scientific Collaboration: PICS-INAF project n°181542 S.B. and A.D.R. acknowledge INAF/PICS financial support and financial support from the Italian Space Agency under grant ASI/INAF I/037/12. A.D.R acknowledge financial support from contract PRIN INAF 2011. G.P. acknowledges support via an EU Marie Curie Intra-European fellowship under contract no. FP-PEOPLE-2012-IEF-331095 and Bundesministerium für Wirtschaft und Technologie/Deutsches Zentrum für Luft- und Raumfahrt (BMWI/DLR, FKZ 50 OR 1408). FU acknowledges support from Université Franco-Italienne (Vinci PhD fellowship). M.W. acknowledges the support of a PhD studentship awarded by the UK STFC.References
- Arav et al. (2014) Arav, N., Chamberlain, C., Kriss, G. A., et al. 2014, ArXiv e-prints
- Arav et al. (2007) Arav, N., Gabel, J. R., Korista, K. T., et al. 2007, ApJ, 658, 829
- Arnaud et al. (1985) Arnaud, K. A., Branduardi-Raymont, G., Culhane, J. L., et al. 1985, MNRAS, 217, 105
- Bianchi et al. (2012) Bianchi, S., Maiolino, R., & Risaliti, G. 2012, Advances in Astronomy, 2012, 17
- Brinkman et al. (2000) Brinkman, B. C., Gunsing, T., Kaastra, J. S., et al. 2000, in Society of Photo-Optical Instrumentation Engineers (SPIE) Conference Series, Vol. 4012, X-Ray Optics, Instruments, and Missions III, ed. J. E. Truemper & B. Aschenbach, 81–90
- Burrows et al. (2005) Burrows, D. N., Hill, J. E., Nousek, J. A., et al. 2005, Space Sci. Rev., 120, 165
- Cash (1979) Cash, W. 1979, ApJ, 228, 939
- Coffey et al. (2014) Coffey, D., Longinotti, A. L., Rodríguez-Ardila, A., et al. 2014, MNRAS, 443, 1788
- Costantini (2010) Costantini, E. 2010, Space Sci. Rev., 157, 265
- Costantini et al. (2007) Costantini, E., Kaastra, J. S., Arav, N., et al. 2007, A&A, 461, 121
- Crenshaw & Kraemer (1999) Crenshaw, D. M. & Kraemer, S. B. 1999, ApJ, 521, 572
- Crenshaw & Kraemer (2012) Crenshaw, D. M. & Kraemer, S. B. 2012, ApJ, 753, 75
- Crenshaw et al. (2003a) Crenshaw, D. M., Kraemer, S. B., Gabel, J. R., et al. 2003a, ApJ, 594, 116
- Crenshaw et al. (2003b) Crenshaw, D. M., Kraemer, S. B., & George, I. M. 2003b, ARA&A, 41, 117
- de Vaucouleurs et al. (1991) de Vaucouleurs, G., de Vaucouleurs, A., Corwin, J. H. G., et al. 1991, Third Reference Catalogue of Bright Galaxies. Volume I: Explanations and references. Volume II: Data for galaxies between 0h and 12h. Volume III: Data for galaxies between 12h and 24h.
- den Herder et al. (2001) den Herder, J. W., Brinkman, A. C., Kahn, S. M., et al. 2001, A&A, 365, L7
- Detmers et al. (2009) Detmers, R. G., Kaastra, J. S., & McHardy, I. M. 2009, A&A, 504, 409
- Di Gesu et al. (2013) Di Gesu, L., Costantini, E., Arav, N., et al. 2013, A&A, 556, A94 (Paper I)
- Ebrero et al. (2010) Ebrero, J., Costantini, E., Kaastra, J. S., et al. 2010, A&A, 520, A36
- Ebrero et al. (2011) Ebrero, J., Kriss, G. A., Kaastra, J. S., et al. 2011, A&A, 534, A40
- Elvis et al. (2004) Elvis, M., Risaliti, G., Nicastro, F., et al. 2004, ApJ, 615, L25
- Gehrels et al. (2004) Gehrels, N., Chincarini, G., Giommi, P., et al. 2004, ApJ, 611, 1005
- Giacchè et al. (2014) Giacchè, S., Gilli, R., & Titarchuk, L. 2014, A&A, 562, A44
- Hamann & Sabra (2004) Hamann, F. & Sabra, B. 2004, in Astronomical Society of the Pacific Conference Series, Vol. 311, AGN Physics with the Sloan Digital Sky Survey, ed. G. T. Richards & P. B. Hall, 203
- Harrison et al. (2013) Harrison, F. A., Craig, W. W., Christensen, F. E., et al. 2013, ApJ, 770, 103
- Iwasawa et al. (1999) Iwasawa, K., Fabian, A. C., & Nandra, K. 1999, MNRAS, 307, 611
- Kaastra et al. (2012) Kaastra, J. S., Detmers, R. G., Mehdipour, M., et al. 2012, A&A, 539, A117
- Kaastra et al. (2014) Kaastra, J. S., Kriss, G. A., Cappi, M., et al. 2014, Science, 345, 64
- Kaastra et al. (2000) Kaastra, J. S., Mewe, R., Liedahl, D. A., Komossa, S., & Brinkman, A. C. 2000, A&A, 354, L83
- Kaastra et al. (1996) Kaastra, J. S., Mewe, R., & Nieuwenhuijzen, H. 1996, in UV and X-ray Spectroscopy of Astrophysical and Laboratory Plasmas, ed. K. Yamashita & T. Watanabe, 411–414
- Kaastra et al. (2004) Kaastra, J. S., Raassen, A. J. J., Mewe, R., et al. 2004, A&A, 428, 57
- Kaastra et al. (2002) Kaastra, J. S., Steenbrugge, K. C., Raassen, A. J. J., et al. 2002, A&A, 386, 427
- Kraemer et al. (2012) Kraemer, S. B., Crenshaw, D. M., Dunn, J. P., et al. 2012, ApJ, 751, 84
- Kraemer et al. (2005) Kraemer, S. B., Crenshaw, D. M., George, I. M., Gabel, J. R., & NGC 4151 Team. 2005, in Bulletin of the American Astronomical Society, Vol. 37, American Astronomical Society Meeting Abstracts, 1190
- Krongold et al. (2005) Krongold, Y., Nicastro, F., Brickhouse, N. S., Elvis, M., & Mathur, S. 2005, ApJ, 622, 842
- Krongold et al. (2007) Krongold, Y., Nicastro, F., Elvis, M., et al. 2007, ApJ, 659, 1022
- Longinotti et al. (2010) Longinotti, A. L., Costantini, E., Petrucci, P. O., et al. 2010, A&A, 510, A92
- Longinotti et al. (2013) Longinotti, A. L., Krongold, Y., Kriss, G. A., et al. 2013, ApJ, 766, 104
- Magdziarz & Zdziarski (1995) Magdziarz, P. & Zdziarski, A. A. 1995, MNRAS, 273, 837
- Marchese et al. (2012) Marchese, E., Braito, V., Della Ceca, R., Caccianiga, A., & Severgnini, P. 2012, MNRAS, 421, 1803
- Matt et al. (2003) Matt, G., Guainazzi, M., & Maiolino, R. 2003, MNRAS, 342, 422
- McHardy et al. (2006) McHardy, I. M., Koerding, E., Knigge, C., Uttley, P., & Fender, R. P. 2006, Nature, 444, 730
- Mehdipour et al. (2015) Mehdipour, M., Kaastra, J. S., Kriss, G. A., et al. 2015, ArXiv e-prints
- Miniutti et al. (2014) Miniutti, G., Sanfrutos, M., Beuchert, T., et al. 2014, MNRAS, 437, 1776
- Nandra et al. (1993) Nandra, K., Fabian, A. C., George, I. M., et al. 1993, MNRAS, 260, 504
- Pancoast et al. (2014) Pancoast, A., Brewer, B. J., Treu, T., et al. 2014, MNRAS, 445, 3073
- Peterson & Wandel (1999) Peterson, B. M. & Wandel, A. 1999, ApJ, 521, L95
- Petrucci et al. (2013) Petrucci, P.-O., Paltani, S., Malzac, J., et al. 2013, A&A, 549, A73
- Piconcelli et al. (2007) Piconcelli, E., Bianchi, S., Guainazzi, M., Fiore, F., & Chiaberge, M. 2007, A&A, 466, 855
- Ponti et al. (2006) Ponti, G., Miniutti, G., Cappi, M., et al. 2006, MNRAS, 368, 903
- Ponti et al. (2012) Ponti, G., Papadakis, I., Bianchi, S., et al. 2012, A&A, 542, A83
- Puccetti et al. (2007) Puccetti, S., Fiore, F., Risaliti, G., et al. 2007, MNRAS, 377, 607
- Risaliti et al. (2010) Risaliti, G., Elvis, M., Bianchi, S., & Matt, G. 2010, MNRAS, 406, L20
- Risaliti et al. (2005) Risaliti, G., Elvis, M., Fabbiano, G., Baldi, A., & Zezas, A. 2005, ApJ, 623, L93
- Risaliti et al. (2009) Risaliti, G., Salvati, M., Elvis, M., et al. 2009, MNRAS, 393, L1
- Roming et al. (2005) Roming, P. W. A., Kennedy, T. E., Mason, K. O., et al. 2005, Space Sci. Rev., 120, 95
- Shih et al. (2002) Shih, D. C., Iwasawa, K., & Fabian, A. C. 2002, MNRAS, 333, 687
- Steenbrugge et al. (2009) Steenbrugge, K. C., Fenovčík, M., Kaastra, J. S., Costantini, E., & Verbunt, F. 2009, A&A, 496, 107
- Steenbrugge et al. (2005) Steenbrugge, K. C., Kaastra, J. S., Crenshaw, D. M., et al. 2005, A&A, 434, 569
- Steenbrugge et al. (2003) Steenbrugge, K. C., Kaastra, J. S., de Vries, C. P., & Edelson, R. 2003, A&A, 402, 477
- Strüder et al. (2001) Strüder, L., Briel, U., Dennerl, K., et al. 2001, A&A, 365, L18
- Titarchuk (1994) Titarchuk, L. 1994, ApJ, 434, 570
- Turner et al. (2001) Turner, M. J. L., Abbey, A., Arnaud, M., et al. 2001, A&A, 365, L27
- Turner et al. (2009) Turner, T. J., Miller, L., Kraemer, S. B., Reeves, J. N., & Pounds, K. A. 2009, ApJ, 698, 99
- Ursini et al. (2015) Ursini, F., Boissay, R., Petrucci, P.-O., et al. 2015, ArXiv e-prints
- Wakker et al. (2011) Wakker, B. P., Lockman, F. J., & Brown, J. M. 2011, ApJ, 728, 159
- Walton et al. (2014) Walton, D. J., Risaliti, G., Harrison, F. A., et al. 2014, ApJ, 788, 76
- Weymann et al. (1991) Weymann, R. J., Morris, S. L., Foltz, C. B., & Hewett, P. C. 1991, ApJ, 373, 23
- Zycki & Czerny (1994) Zycki, P. T. & Czerny, B. 1994, MNRAS, 266, 653