Proximity Driven Enhanced Magnetic Order at Ferromagnetic Insulator / Magnetic Topological Insulator Interface
Abstract
Magnetic exchange driven proximity effect at a magnetic insulator / topological insulator (MI/TI) interface provides a rich playground for novel phenomena as well as a way to realize low energy dissipation quantum devices. Here we report a dramatic enhancement of proximity exchange coupling in the MI/magnetic-TI EuS / Sb2-xVxTe3 hybrid heterostructure, where V doping is used to drive the TI (Sb2Te3) magnetic. We observe an artificial antiferromagnetic-like structure near the MI/TI interface, which may account for the enhanced proximity coupling. The interplay between the proximity effect and doping in a hybrid heterostructure provides insights into the engineering of magnetic ordering.
- PACS numbers
-
61.05.fj, 75.25.-j, 75.30.Gw, 75.70.Cn.
The time-reversal symmetry (TRS) breaking and surface bandgap opening of topological insulator (TI) is an essential step towards the observation of novel quantum phases and realization for TI-based devices Qi and Zhang (2011); Hasan and Kane (2010). In general, there are two approaches to break the TRS: transitional metal (TM) ion doping, where Cr or V are doped into the entire TI Wei et al. (2013); Chen et al. (2010); Li et al. (2015a), and magnetic proximity effect, where a magnetic insulator (MI) layer in proximity to TI induces exchange coupling Lang et al. (2014); Vobornik et al. (2011); Wei et al. (2013); Kandala et al. . Doping TM impurities into TI will introduce a perpendicular ferromagnetic (FM) anisotropy and provide a straightforward means to open up the bandgap of the TI’s surface state, with profound influence to its electronic structure Chen et al. (2010); Chang et al. (2015, 2013a); Xu et al. (2012); Hor et al. (2010); Chang et al. (2014a, 2013b). In particular, quantum anomalous Hall effect (QAHE), where quantum Hall plateau and dissipationless chiral edge channels emerge at zero external magnetic field, has recently been realized in Cr-doped and V-doped TIs Chang et al. (2015, 2013a); Qi et al. (2008); Yu et al. (2010); Liu et al. (2008); Kou et al. (2014); Checkelsky et al. (2014); Chang et al. (2014b). Ideally, compared to the doping method, the proximity effect has a number of advantages, including spatially uniform magnetization, better controllability of surface state, and freedom from dopant-induced scattering that degrades TI properties, as well as preserving TI intrinsic crystalline structure, etc. Li et al. (2015b); Lauter et al. (2014). However, due to the in-plane anisotropy and low Curie temperature of the common MI, such proximity effects are usually too weak to induce strong proximity magnetism in TI. In fact, compared to magnetically doped TI which can induce as large as a surface bandgap Chen et al. (2010), the EuS/TI system has only gap opening due to the strongly localized Eu-f orbitals Eremeev et al. (2013). Therefore, the enhancement of proximity magnetism is highly desirable to make it a valuable approach as doping hence takes full advantage.
In this Letter, we report significant enhancement of the proximity effect in MI EuS / magnetic-TI Sb2-xVxTe3 hybrid heterostructure. Using polarized neutron reflectometry (PNR), we inferred an increase of proximity magnetization per unit cell (u.c.) in TI, from to at doping level. High-resolution transmission electron microscopy (HRTEM) image identifies the TI/EuS interfacial sharpness and excludes false positive magnetism signal from interdiffused Eu ions into TI. Furthermore, the proximity effect enhancement is accompanied by a decrease in the interfacial magnetization of EuS, resulting in an exotic antiferromagnetic (AF) like structure. The existence of the “artificial” AF structure between FM EuS and the FM Sb2-xVxTe3 with different anisotropies is consistent with magnetometry measurements which shows exchange bias. Such artificial AF ordering in this FM / FM hybrid heterostructure may shed lights for designing novel magnetic phases and devices.
High-quality MI EuS / 15 quintuple layer (QL) magnetic TI Sb2-xVxTe3 hybrid heterostructures were grown by molecular beam epitaxy (MBE) under a base vacuum Torr, where magnetic TI thin films Sb2-xVxTe3 were grown on clean, heat-treated sapphire (0001) substrates with V-dopants coevaporated during TI growth. The EuS (111) layer was deposited in situ over the TI film using electron beam source. To understand the interplay between proximity effect and TM doping, EuS/ Sb2Te3, Sb2-xVxTe3 and Sb2-xVxTe3 samples were fabricated.
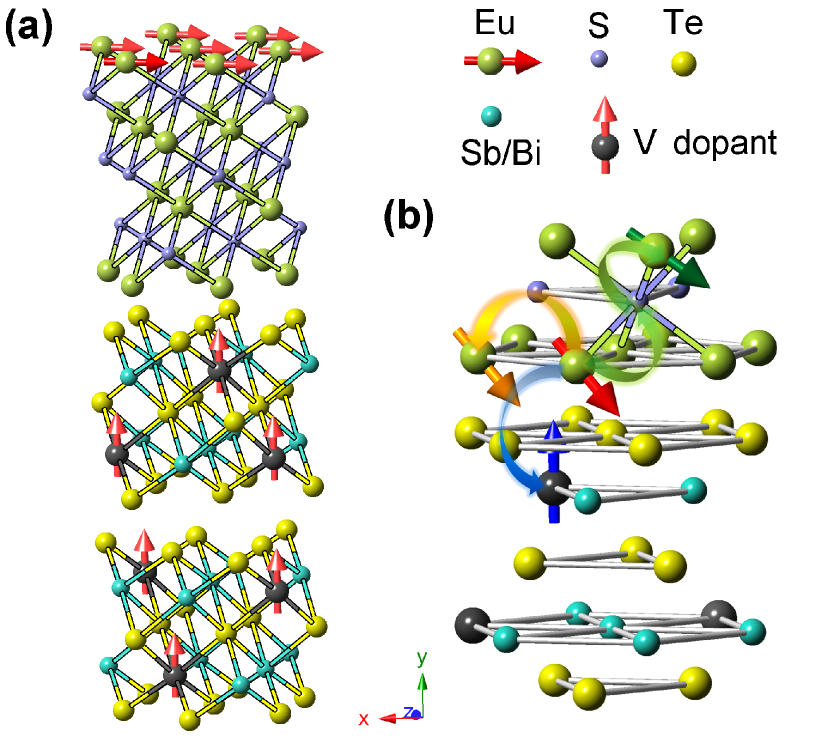
The atomic configuration of the MI / magnetic TI heterostructure is shown in Fig. 1 (a). The upper EuS has in-plane anisotropy Kuneš and Pickett (2005); Liu (1983); Franzblau et al. (1967); Von Molnar and Lawson (1965) within xz-plane, while the lower TM doped TI has easy axis out-of-plane Chang et al. (2013b, 2014b, a) along y-axis. The different anisotropy directions in the two layers, corroborated by a strong interfacial spin-orbit coupling, create a complex magnetic environment for the EuS near the interface (Fig. 1 b). The Heisenberg interaction, superexchange interaction Liu (1983); Boncher et al. (2014), coupling Lee and Liu (1983) and coupling with the TI’s spin texture may finally contribute to an overall augmentation of the proximity effect.
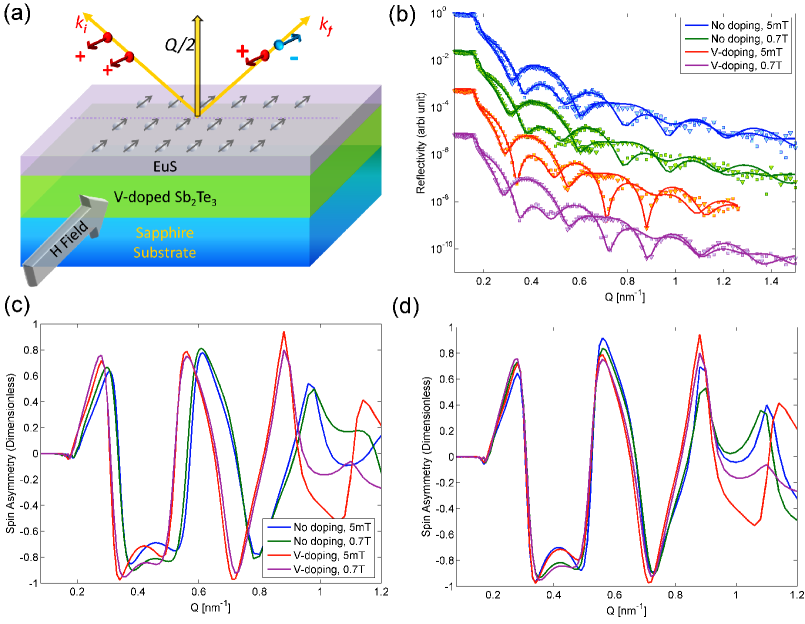
The PNR experiments were carried out using PBR beamline at the NIST Center for Neutron Research, from which the in-plane magnetization is extracted. The experimental setup is shown in Fig. 2(a), where the incident spin-polarized neutron beam is reflected by the heterostructure sample, while the spin non-flip reflectivity signals from both spin components ( and ) were collected under external guide magnetic field. The PNR refinement is based on a multilayered TI / proximity /interfacial EuS / main EuS model Lauter et al. (2014). To maximize the PNR information extraction, we did not compare the with and without proximity effect due to limited sensitivity. Instead, we presume the existence of the proximity coupling layer and optimize its magnitude.
The spin non-flip reflectivity curves for the MI/ magnetic TI sample EuS/Sb1.9V0.1Te3 and control sample MI/TI EuS/Sb2Te3, at low () and high () fields, are shown in Fig. 2 (b). The fitting and refinement of PNR is performed using the GenX program Björck and Andersson (2007). To directly infer the possible contribution of V-dopants, the corresponding spin asymmetries are plotted (Fig. 2c) for the raw data and thickness-adjusted data (Fig. 2d). In this way, the different features of the in Fig. 2 (d) are solely coming from the magnetic structure since the crystalline structure is taken to be identical. We see that at , SA for both samples with and without V-dopants overlap each other, but distinct with the curves, indicating an effect from guide field within this Q range; while at , a splitting of the curves for both samples at same guide field (eg. blue and red curves) is observed. This indicates the influence of the V-dopants to magnetic structure at high Q range (spatially localized) even without performing fitting.
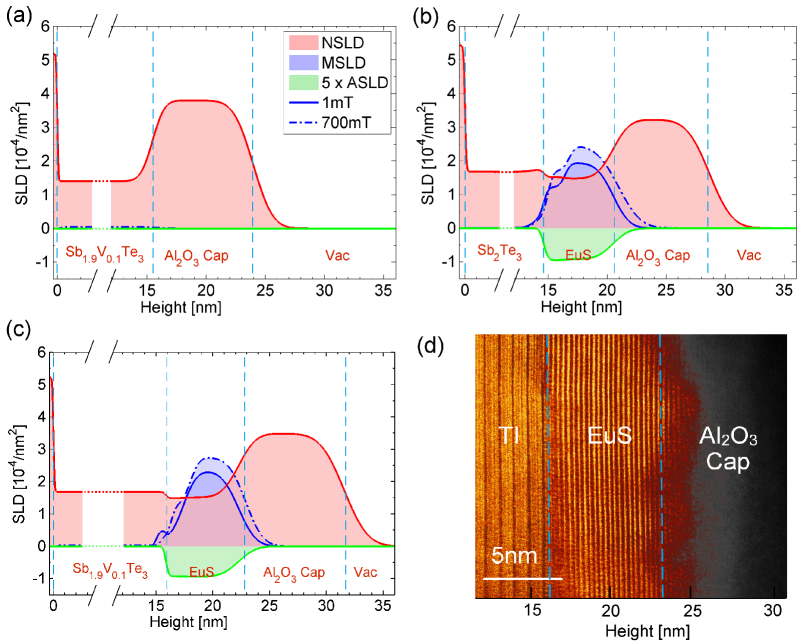
Results of fitting the PNR data are shown in Fig. 3. The substrate lies in the region below . Nuclear-SLD (NSLD, red curves) identifies the chemical compositional contrast, where the NSLDs for each compound layer are correctly reproduced from PNR fitting (sapphire substrate , Sb2Te3 , EuS and amorphous Al2O3 capping layer ). This further validates the fitting quality. In Fig. 3(a), without the EuS proximity layer, the V-dopants in the Sb1.9V0.1Te3 sample contribute to no more than in-plane magnetization at , indicating a very strong perpendicular FM anisotropy in V-doped TI. This is consistent with the result in the inset of Fig. 4 (a), and facilitates us in obtaining reliable PNR refinement by fixing the magnetization of the magnetic TI layer. The magnetic-SLD (MSLD) (blue curves) at = 5mT and 700mT in-plane guide fields at T = 5 K are also plotted. In Fig. 3 (b), for the EuS/pure TI sample, we see a penetration of magnetization into TI. Unlike the EuS region where strong absorption LSD (ASLD) is always accompanied due to the Eu ions’ large neutron absorption, the magnetization into TI does not show any absorption (), indicating that such magnetism in TI is not from ferromagnetic Eu ions interdiffused into Sb2Te3, but from proximity exchange effect. The free of interdiffusion is also consistent with our Transmission Electron Microscopy (TEM) result in Fig. 3(d), where a sharp interface between epitaxially grown EuS and Sb1.9V0.1Te3 is developed.
The magnetization at the interface in proximity structures is greatly enhanced when V-dopant is at present, from (Fig. 3b, without V-doping) to (Fig. 3c, V-doped), i.e. almost tripled. In both cases, the penetration depth of proximity is , consistent with Bi2Se3 / EuS interface Lauter et al. (2014). Besides, the in-plane magnetization of EuS drops dramatically near the interface, from without V-dopants to with V-doping, at . This is due purely to magnetic effect instead of interfacial roughness since the ASLD is flat near the TI interface. On the contrary, magnetization drop at EuS / Al2O3 interface () is due to the Stranski–Krastanov growth Pimpinelli and Villain (1998), leading to a thickness variation and formation of island. This is directly confirmed from Z-contrast high-angle angular dark field (HAADF) TEM image (Fig. 3(d)). At higher field , an increase of the in-plane EuS magnetism is accompanied with a drop of proximity effect into TI. Since only the perpendicular direction magnetism will contribute to the proximity effect Qi and Zhang (2011), a high in-plane guide field tends to align the EuS moment in-plane and reduce the proximity.
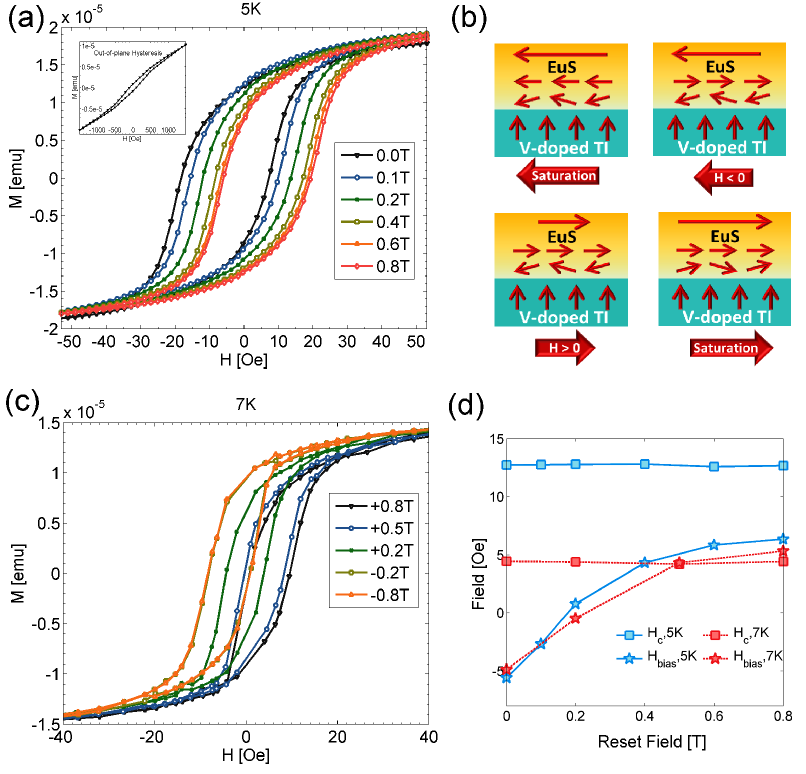
To understand the origin of the in-plane EuS magnetism drop near the interface, we examined the exchange bias (EB) of the magnetic hysteresis measurements. Fig. 4 plots the results of low-field in-plane hysteresis measurements of a 2nm EuS / 10QL BiVTe3 hybrid heterostructure instead of Sb2Te3 since both belong to Bi2Se3 TI family and share very similar crystalline structure. Despite Sb2Te3 is more suitable for PNR studies due to less interstitial V-defects, Bi2Te3 is more suitable for SQUID due to higher diamagnetic susceptibility. Fig. 4(a) shows that the EB can be switched from negative to positive by a field of T. Fig. 4(b, c) show the characteristics of the EB as a function of the resetting field, at 5K and 7K, respectively. We adopt the traditional approach for exchange bias (EB) measurement Kiwi (2001); Stamps (2000); Nogués and Schuller (1999) at various reset fields, where the EB was initially set negative by applying a field of T, which was followed by a positive resetting field and then measuring the low-field hysteresis Wen-Bin et al. (2014). This was repeated for resetting fields from 0 to + 0.8 T, where the bias is seen to shift from to Oe. Results of the exchange biasing strongly suggests the existence of an AF structure and a likely magnetic frustration Schlenker et al. (1986), and is quite striking since our system is only composed by two strong FMs. The possible configuration derived from EB is illustrated in Fig. 4(d), where V-doped TI keeps a perpendicular anisotropy, but an interfacial AF structure is created to cause the EB.
To further understand the implication of the results in Fig. 4, we develop a phenomenological energy model to describe the coupling between the FM and AF. The anisotropic energy for bulk EuS can be written as Franzblau et al. (1967)
| (1) |
where is the directional cosine along ith direction, is the saturation magnetism per area, is the thickness of FM layer and the anisotropic constants and at Franzblau et al. (1967). Since our interest is in thin film structures with a single symmetry axis (-axis in Fig. 1 a), eq. (1) could be rewritten as using a simplified model for hexagonal and cubic lattice Skomski (2008),
| (2) |
where , , is the angle between the magnetization and the symmetry axis. Since , corresponds in the present case for EuS showing easy-plane anisotropy within -plane. For a thin film, we further define . We require the surface anisotropy constant , since for thinner sample will approach zero from the negative side, indicating a rotation of the in-plane easy plane to an out-of-plane direction, resulting in a magnetic canting which is reasonable for compensated thin film interfaces Stamps (2000).
Taking into account the external magnetic field and the FM/AF coupling , the total energy could be written as
| (3) | |||||
At saturation field configuration and considering the energy extreme, we obtain the bias field and coercivity
| (4) |
respectively.
| -19.6 | -13.10 | -9.96 | |
| +16.6 | 7.41 | 4.29 | |
| N/A | 12.7 | 4.4 | |
| 13.8 | 9.3 | 7.2; 7.1 |
The anisotropic coefficients strongly depend on temperature Skomski (2008). In the mean-field approximation, the temperature dependence of anisotropy can be expressed using the Callen and Callen theory as Skomski et al. (2006)
| (5) |
where is the order of anisotropy constant, and . Assuming that the Curie temperature of EuS is , we obtain the temperature dependence of anisotropy constants as shown in Table 1. One remarkable feature for this model is that the surface anisotropy calculated from experimental values and eq. (4) coincides with the independent check using eq. (5), giving vs at . Finally, this yields a surface anisotropy by assuming a saturation and sample area. This term is the origin of magnetic canting of interfacial EuS.
Contrary to the strong -dependence of anisotropy, the bias field thus AF/FM coupling constant has a weak dependence with temperature, indicating an origin of FM/AF coupling different from magnetic crystalline anisotropym such as the prominent role of Spin-Orbit interaction and spin-momentum locking at the surface of the TI.
To summarize, we have reported a large enhancement of proximity exchange coupling strength in MI/magnetic-TI hybrid heterostructure. This overcomes the major disadvantage in MI/TI heterostructures where the proximity coupling strength is considered weak Eremeev et al. (2013). To our knowledge, this is also the first report combining TM doping and proximity effect to magnetize TIs. Here, the magnetic dopants magnetize the TI surface states, which are further coupled to the MI; whereas the magnetic TI has a strong perpendicular anisotropy that compensates the weakness of MI with in-plane anisotropy. The reduction of interfacial magnetism is consistent with the exchange bias result, where an AFM-like structure is artificially created, where a surface anisotropy is extracted. Despite this value being small compared to the stronger examples such as the Au/Co interface Bruno (1988), this approach provides fruitful insights to tailor new magnetic structure at TI/MI interfaces.
Acknowledgements.
M. L. would thank the helpful discussion with Prof. Albert Fert. J.S.M. and C.Z.C would thank support from the STC Center for Integrated Quantum Materials under NSF grant DMR-1231319, NSF DMR grants 1207469 and ONR grant N00014-13-1-0301. M. J. and D. H. acknowledge support from NSF DMR-907007 and NSF ECCS-1402738. L.W. and Y.Z. were supported by DOE-BES under Contract No. DE-AC02-98CH10886.References
- Qi and Zhang (2011) X.-L. Qi and S.-C. Zhang, Reviews of Modern Physics 83, 1057 (2011).
- Hasan and Kane (2010) M. Z. Hasan and C. L. Kane, Reviews of Modern Physics 82, 3045 (2010).
- Wei et al. (2013) P. Wei, F. Katmis, B. Assaf, et al., Physical Review Letters 110, 186807 (2013).
- Chen et al. (2010) Y. Chen, J.-H. Chu, J. Analytis, et al., Science 329, 659 (2010).
- Li et al. (2015a) M. Li, C.-Z. Chang, L. Wu, et al., Phys. Rev. Lett. 114, 146802 (2015a).
- Lang et al. (2014) M. Lang, M. Montazeri, M. C. Onbasli, Kou, et al., Nano Letters 14, 3459 (2014).
- Vobornik et al. (2011) I. Vobornik, U. Manju, Fujii, et al., Nano letters 11, 4079 (2011).
- (8) A. Kandala, A. Richardella, D. W. Rench, et al., .
- Chang et al. (2015) C.-Z. Chang, W. Zhao, D. Y. Kim, et al., Nat Mater 14, 473 (2015).
- Chang et al. (2013a) C.-Z. Chang, J. Zhang, X. Feng, Shen, et al., Science 340, 167 (2013a).
- Xu et al. (2012) S.-Y. Xu, M. Neupane, C. Liu, et al., Nature Physics 8, 616 (2012).
- Hor et al. (2010) Y. Hor, P. Roushan, H. Beidenkopf, et al., Physical Review B 81, 195203 (2010).
- Chang et al. (2014a) C.-Z. Chang, P. Tang, Y.-L. Wang, et al., Physical Review Letters 112, 056801 (2014a).
- Chang et al. (2013b) C.-Z. Chang, J. Zhang, M. Liu, et al., Advanced Materials 25, 1065 (2013b).
- Qi et al. (2008) X.-L. Qi, T. L. Hughes, and S.-C. Zhang, Physical Review B 78, 195424 (2008).
- Yu et al. (2010) R. Yu, W. Zhang, H.-J. Zhang, et al., Science 329, 61 (2010).
- Liu et al. (2008) C.-X. Liu, X.-L. Qi, X. Dai, et al., Physical Review Letters 101, 146802 (2008).
- Kou et al. (2014) X. Kou, S.-T. Guo, Y. Fan, et al., Physical review letters 113, 137201 (2014).
- Checkelsky et al. (2014) J. Checkelsky, R. Yoshimi, A. Tsukazaki, et al., Nature Physics 10, 731–736 (2014).
- Chang et al. (2014b) C.-Z. Chang, P. Wei, and J. S. Moodera, MRS Bulletin 39, 867 (2014b).
- Li et al. (2015b) M. Li, W. Cui, J. Yu, et al., Phys. Rev. B 91, 014427 (2015b).
- Lauter et al. (2014) V. Lauter, F. Katmis, B. Assaf, and J. Moodera, in APS March Meeting Abstracts, Vol. W (2014) p. 42.00007.
- Eremeev et al. (2013) S. Eremeev, V. Men’shov, V. Tugushev, et al., Physical Review B 88, 144430 (2013).
- Kuneš and Pickett (2005) J. Kuneš and W. E. Pickett, Physica B: Condensed Matter 359, 205 (2005).
- Liu (1983) L. Liu, Solid State Communications 46, 83 (1983).
- Franzblau et al. (1967) M. Franzblau, G. E. Everett, and A. Lawson, Physical Review 164, 716 (1967).
- Von Molnar and Lawson (1965) S. Von Molnar and A. Lawson, Physical Review 139, A1598 (1965).
- Boncher et al. (2014) W. Boncher, H. Dalafu, N. Rosa, and S. Stoll, Coordination Chemistry Reviews (2014).
- Lee and Liu (1983) V.-C. Lee and L. Liu, Solid State Communications 48, 795 (1983).
- Björck and Andersson (2007) M. Björck and G. Andersson, Journal of Applied Crystallography 40, 1174 (2007).
- Pimpinelli and Villain (1998) A. Pimpinelli and J. Villain, Physics of Crystal Growth (Cambridge University Press, 1998) cambridge Books Online.
- Kiwi (2001) M. Kiwi, Journal of Magnetism and Magnetic Materials 234, 584 (2001).
- Stamps (2000) R. Stamps, Journal of Physics D: Applied Physics 33, R247 (2000).
- Nogués and Schuller (1999) J. Nogués and I. K. Schuller, Journal of Magnetism and Magnetic Materials 192, 203 (1999).
- Wen-Bin et al. (2014) R. Wen-Bin, H. Mao-Cheng, Y. Biao, et al., Chinese Physics B 23, 107502 (2014).
- Schlenker et al. (1986) C. Schlenker, S. Parkin, J. Scott, and K. Howard, Journal of magnetism and magnetic materials 54, 801 (1986).
- Skomski (2008) R. Skomski, Simple models of magnetism (Oxford University Press Oxford, 2008).
- Skomski et al. (2006) R. Skomski, O. Mryasov, J. Zhou, and D. J. Sellmyer, Journal of applied physics 99, 08E916 (2006).
- Bruno (1988) P. Bruno, Journal of Physics F: Metal Physics 18, 1291 (1988).