The ALMA Patchy Deep Survey: A blind search for [C II] emitters at
Abstract
We present a result of a blind search for [C II] 158 m emitters at using ALMA Cycle 0 archival data. We collected extra-galactic data covering at GHz (band 7) from 8 Cycle 0 projects from which initial results have been already published. The total number of fields is 243 and the total on-source exposure time is 19.2 hours. We searched for line emitters in continuum-subtracted data cubes with spectral resolutions of 50, 100, 300 and 500 km s-1. We could not detect any new line emitters above a 6- significance level. This result provides upper limits to the [C II] luminosity function at over or star formation rate, Myr-1. These limits are at least 2 orders of magnitude larger than the [C II] luminosity functions expected from the UV luminosity function or from numerical simulation. However, this study demonstrates that we would be able to better constrain the [C II] luminosity function and to investigate possible contributions from dusty galaxies to the cosmic star-formation rate density by collecting Cycle 1+2 archival data as the ALMA Patchy Deep Survey.
keywords:
galaxies: formation – cosmology: observations – cosmology: early universe| Project ID (Regiona) | Targets | # of Fields | Antennas | RMSc | Synthesised beam | Bandwidth | Ref.d | |
|---|---|---|---|---|---|---|---|---|
| (min) | (mJy) | (FWHM) | (GHz) | |||||
| 2011.0.00020.S (EA) | NGC1614 | 1 | 51 | 7.5 | 1 | |||
| 2011.0.00039.S (EU) | SBS0335052 | 1 | 243 | 7.5 | 2 | |||
| 2011.0.00097.S (NA) | COSMOS | 114 | 279 | 8 | 3 | |||
| 2011.0.00101.S (EA) | GRBs | 2 | 91 | 8 | 4 | |||
| 2011.0.00108.S (EA) | NGC1097 | 1 | 59 | 7.5 | 5 | |||
| 2011.0.00208.S (EU) | NGC1433 | 1 | 101 | 7.5 | 6 | |||
| 2011.0.00294.S (EU) | ECDFS | 120e | 244 | 8 | 7 | |||
| 2011.0.00467.S (EA) | VV114 | 3 | 85 | 7.5 | 8 |
aThe ALMA Regions, EA: East Asia, EU: Europe, NA: North America.
bThe total on-source time (minutes).
cThe 1- sensitivity at 300 km s-1 spectral resolution.
d1: Imanishi & Nakanishi (2013), 2: Hunt et al. (2014), 3: Scoville et al. (2014), 4: Wang, Chen, & Huang (2012), 5: Fathi et al. (2013), Izumi et al. (2013), 6: Combes et al. (2013), 7: Coppin et al. (2012), Swinbank et al. (2012, 2014), Karim et al. (2013), Huynh et al. (2013), Hodge et al. (2013), Wang et al. (2013), Decarli et al. (2014), 8: Iono et al. (2013), Sliwa et al. (2013), Tamura et al. (2014)
eThe data of two SMGs are excluded.
1 Introduction
The [C II] 2PP1/2 fine-structure transition at 1900.5469 GHz (157.74 m) is a dominant coolant of the inter-stellar medium (ISM) in galaxies (e.g., Crawford et al., 1985; Colbert et al., 1999; Díaz-Santos et al., 2013, 2014). The [C II] line is one of the brightest lines at far-infrared (FIR) and is expected to be a tracer of star formation rate in local to distant galaxies (e.g., Smail et al., 2011; De Looze et al., 2011, 2014; Sargsyan et al., 2012, 2014).
Since the emission line can hold up to 1% of the bolometric luminosity of a galaxy, it is also very bright, allowing ’blind’ redshifts to be measured. Indeed, ALMA observations of sub-millimetre galaxies (SMGs) serendipitously detected [C II] emission from two SMGs at (Swinbank et al., 2012). They obtained the first constraint to the [C II] luminosity function () at , using the original survey area with APEX/LABOCA (LESS, Weiß et al., 2009) and the [C II] redshift coverage in the 7.5 GHz bandwidth. However, their constraint was only lower limit because their targets are continuum-selected objects and they could miss continuum-faint [C II] emitters.
The [C II] luminosity function may be a useful tool to estimate the cosmic star-formation rate density at , and the evolution of star-formation rate density can provide tests of galaxy formation models (e.g., Behroozi, Wechsler, & Conroy, 2013). However, at , the contribution from dusty galaxies to the cosmic star formation rate density is still uncertain (e.g., Burgarella et al., 2013; Dowell et al., 2014; Madau & Dickinson, 2014; Swinbank et al., 2014). In order to obtain better constraint to the [C II] luminosity function at , we carried out a blind search for [C II] emitters at using ALMA Cycle 0 archival data. Throughout this Letter, we adopt a cosmology with km s-1 Mpc-1, , and .
2 Data and Results
In ALMA science archive, we searched Cycle 0 Projects covering GHz (in band 7), which corresponds to the [C II] redshift range of . We collected 8 extra-galactic projects from which initial results have been already published. We only used the published data because we were able to know the data quality from the papers before we downloaded the data from the archive. We summarise the properties of the data sets in Table 1. The data contain very deep single pointing and shallow multiple pointings. The data with 7.5 GHz bandwidth were taken with spectral mode (FDM mode, the spectral resolution is 0.98 MHz or 0.85 km s-1) and the data with 8 GHz bandwidth were taken with continuum mode (TDM mode, the spectral resolution is 31.2 MHz or 27 km s-1).111In TDM mode, the usable bandwidth is also GHz after excluding the edges of the spectral windows with high noise. The total number of fields is 243 after excluding the data sets of the two [C II]-detected SMGs at (Swinbank et al., 2012). The total on-source exposure time of the data is 19.2 hours. The primary beam size is FWHM and the synthesised beam size ranges from . We note that, in our procedure, we potentially miss spatially extended [C II] emitter whose size is much larger than the synthesised beam size.
We used the ALMA data reduction package CASA222http://casa.nrao.edu/ (McMullin et al., 2007) for continuum subtraction and imaging. We used the calibrated data product provided by the archive, without any additional re-calibration of the data. In order to ensure that the calibrations were correctly applied to the data products, we used clean to image the phase calibrator from each of the datasets. We confirmed that the phase calibrator is detected as a spatially un-resolved source at the phase centre and the derived flux density is consistent with the flux densities listed in the ALMA calibrator database. We used uvcontsub to subtract the continuum from the visibilities using line-free parts of the original targets with the multiple spectral windows. The continuum subtraction procedure is necessary to subtract possible side lobes of a bright continuum source and to avoid to detect positive noise peaks on the bright continuum source as line emitters. We used clean to construct data cubes with natural weighting to maximise the sensitivity. We adopted a pixel size of , which is smaller than the smallest synthesised beam size of in the data.
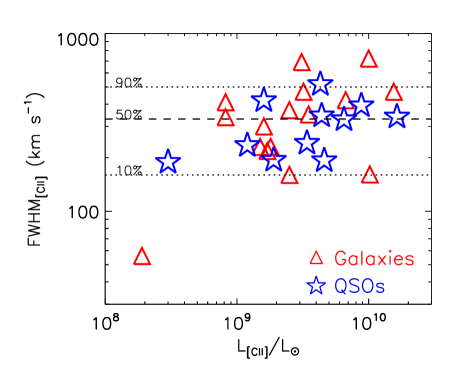
In order to determine the binning size of the data cubes, we checked the [C II] velocity range of high- galaxies/QSOs in literature. Figure 1 show a distribution of the [C II] velocity width (FWHM) of 27 [C II]-detected galaxies/QSOs at (Cox et al., 2011; Wagg et al., 2010; Wagg et al., 2012; Swinbank et al., 2012; Gallerani et al., 2012; Iono et al., 2006; Carilli et al., 2013; De Breuck et al., 2011, 2014; Neri et al., 2014; Rawle et al., 2014; Wang et al., 2013; Riechers et al., 2013, 2014; Maiolino et al., 2005, 2009, 2012; Walter et al., 2009; Willott, Omont, & Bergeron, 2013; Venemans et al., 2012). The [C II] velocity width ranges from km s-1 for a [C II] luminosity range of . The median [C II] velocity width is FWHM 300 km s-1. The 90 per cent of the sample are distributed in the range of km s-1. Therefore, we made data cubes with four different spectral resolutions (50, 100, 300, and 500 km s-1) to search for line emitters in this velocity range.
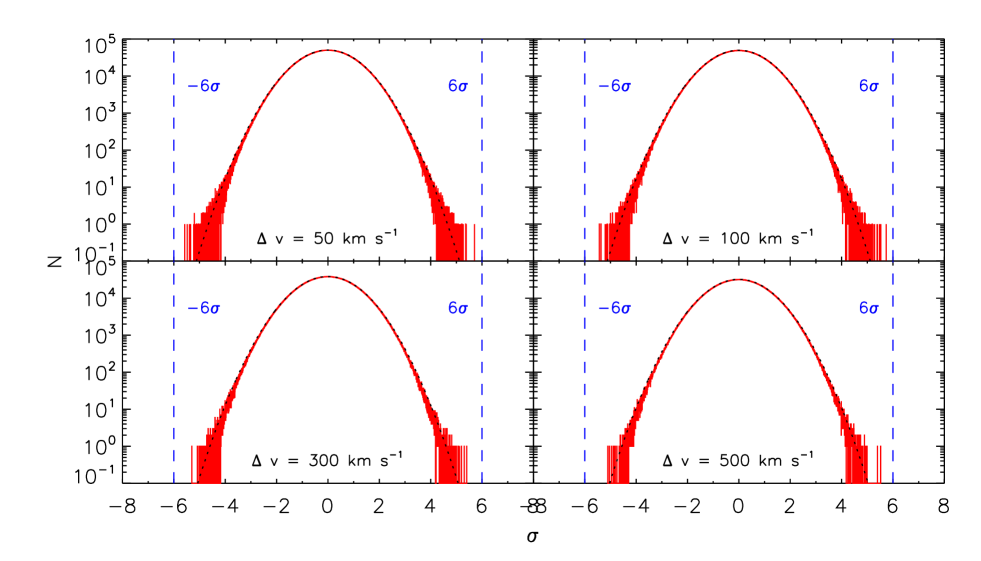
Figure 2 shows flux distributions of the data cubes within the primary beam before primary beam correction. The flux is normalised by using the rms of each binned channel. The blue dashed vertical lines indicate - and 6-, which is used as a detection threshold of line emitters. The overall shapes of the normalised flux distributions are well fitted with a Gaussian (The dotted curves). However, the negative tails extend to larger than the 5-. Therefore we set a threshold of 6- for our line detection conservatively. In this search, we could not detect any line emitters above the 6- significance level. We note that we excluded data with emission lines from the original targets and channels with very high noise, often seen at the edge of spectral windows.
We tested the reliability of our line emitter search as follows. Based on the data re-calibrated by Hodge et al. (2013), Swinbank et al. (2012) detected the [C II] emission lines at 7.0- from ALESS 65.1 with and at 5.3- from ALESS 61.1 with , respectively. In our procedure, based on the data without re-calibration, we detected the emission line at 6.2- from ALESS 65.1 with and merginally detected the emission line at 3.8- from ALESS 61.1 with . Although the line luminosities measured in the two different procedures agree well, the significances in our procedure are somewhat less than those in Swinbank et al. (2012). These differences may come from different methods of data calibration and reduction. This test demonstrated that our procedure can detect [C II] emitters if they exist in the data cubes.
| km s-1 | km s-1 | km s-1 | km s-1 | |||||
| () | (cMpc3) | (cMpc-3) | (cMpc3) | (cMpc-3) | (cMpc3) | (cMpc-3) | (cMpc3) | (cMpc-3) |
| — | — | |||||||
aThe survey volumes are calculated after the primary beam correction.
b1 upper limits from non-detection (Gehrels, 1986).
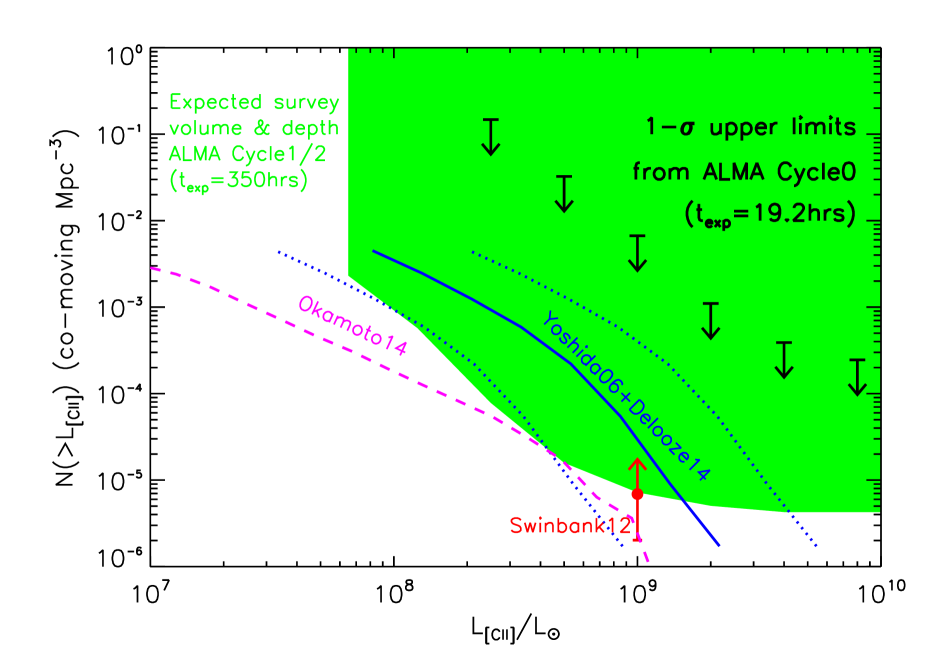
The non-detection of new line emitters provides upper limits for the [C II] luminosity function at . We listed the survey depths, survey volumes, and 1- upper limits in Table 3. We calculated the survey volumes as a function of survey depth.333Data cubes with higher spectral resolutions have higher sensitivities for narrower emission lines and therefore have larger survey volumes for a given line luminosity limit. We took into account the primary beam correction for the calculation because the line sensitivity is not homogeneous even in the same channel. We assume that line emitters are spatially unresolved in the data cubes. The 1- confidence upper limits on the space densities of [C II] emitters are calculated using Poisson statistics by Gehrels (1986). We plot the upper limits for the km s-1 case as arrows in Figure 3. We note that, in addition to [C II], [O III] 88 m, [N II] 122 m, [O I] 145 m, and [N II] 205 m at high redshift (), and high-J CO at lower redshift (i.e. for ) could be observed in ALMA band 7 (e.g. Swinbank et al., 2012; Carilli & Walter, 2013; Ono et al., 2014). However, the upper limits for the [C II] luminosity function are not affected from the other possible line emitters at different redshifts.
3 Discussions and Summary
For comparison, we plot the [C II] luminosity function expected from the UV luminosity function from Yoshida et al. (2006) in Figure 3. We adopted a dust attenuation in the UV, at (Burgarella et al., 2013), the relationship between UV luminosity density () and star-formation rate (SFR), SFR(M☉ yr-1) (ergs s-1 Hz-1) by Kennicutt & Evans (2012), calibration for high- galaxies, log(M☉ yr-1) log, by De Looze et al. (2014). We also compared with the [C II] luminosity function at predicted from a numerical simulation (Okamoto, Shimizu, & Yoshida, 2014) with the same empirical calibration. The current upper limits are at least orders of magnitude larger than the expected [C II] luminosity functions. Given the depth and sensitivity improvements with ALMA in Cycle 1 and 2, we expect to be able to detect [C II] emitters in blind searches as ALMA Patchy Deep Survey (see the green region in Figure 3).
If we adopt a detection threshold of 5.5-, we could detect 6 emitter candidates. If these sources are real, we would have a number density of [C II] emitters of Mpc-3 for L⊙. In this case, the [C II] luminosity function (or the SFR density) at would be orders of magnitude higher than those expected from UV observations. However, the negative tail of the noise distribution also extends to -5.5- and the number of negative sources is 2 below -5.5-. If we consider Poisson statistics, the 1- uncertainty of the false positive is . The number excess of the ”detected” sources is only - compared to the false positive. Therefore, the 5.5- detection threshold may be too aggressive to detect real source.
In summary, we carried out a blind search for [C II] emitters at using a part of ALMA Cycle 0 archival extra-galactic data. In the continuum-subtracted data cubes with spectral resolutions of 50-500 km s-1, we could not detect any new line emitters above a 6- significance level. However, we obtained the first upper limits to the [C II] luminosity function at over or star formation rate, Myr-1. These limits are at least 2 orders of magnitude larger than the [C II] luminosity functions expected from UV observations or numerical simulations. Future ALMA Patchy Deep Survey using archival data will be able to detect [C II] emitters in the blind searches and to study the cosmic star-formation rate density at .
Acknowledgments
We thank the referees for helpful comments which significantly improved the content and presentation of this paper. We also thank Natsuki Hayatsu, Naoki Yoshida, Ian Smail, Hiroshi Nagai, Daniel Espada, Ken Tatematsu, Soh Ikarashi and Mark Lacy for their help and discussions. This paper makes use of the following ALMA data:ADS/JAO.ALMA#2011.0.00020.S, #2011.0.00039.S, #2011.0.00097.S, #2011.0.00101.S, #2011.0.00108.S, #2011.0.00208.S, #2011.0.00294.S, and #2011.0.00467.S. ALMA is a partnership of ESO (representing its member states), NSF (USA) and NINS (Japan), together with NRC (Canada) and NSC and ASIAA (Taiwan), in cooperation with the Republic of Chile. The Joint ALMA Observatory is operated by ESO, AUI/NRAO and NAOJ. Data analysis were carried out on common use data analysis computer system at ADC/NAOJ. YM acknowledges support from JSPS KAKENHI Grant Number 20647268.
References
- Behroozi, Wechsler, & Conroy (2013) Behroozi P. S., Wechsler R. H., Conroy C., 2013, ApJ, 762, L31
- Burgarella et al. (2013) Burgarella D., et al., 2013, A&A, 554, A70
- Carilli et al. (2013) Carilli C. L., Riechers D., Walter F., Maiolino R., Wagg J., Lentati L., McMahon R., Wolfe A., 2013, ApJ, 763, 120
- Carilli & Walter (2013) Carilli C., Walter F., 2013, arXiv, arXiv:1301.0371
- Colbert et al. (1999) Colbert J. W., et al., 1999, ApJ, 511, 721
- Combes et al. (2013) Combes F., et al., 2013, A&A, 558, A124
- Coppin et al. (2012) Coppin K. E. K., et al., 2012, MNRAS, 427, 520
- Cox et al. (2011) Cox P., et al., 2011, ApJ, 740, 63
- Crawford et al. (1985) Crawford M. K., Genzel R., Townes C. H., Watson D. M., 1985, ApJ, 291, 755
- De Breuck et al. (2011) De Breuck C., Maiolino R., Caselli P., Coppin K., Hailey-Dunsheath S., Nagao T., 2011, A&A, 530, L8
- De Breuck et al. (2014) De Breuck C., et al., 2014, arXiv, arXiv:1404.2295
- Decarli et al. (2014) Decarli R., et al., 2014, ApJ, 780, 115
- Díaz-Santos et al. (2013) Díaz-Santos T., et al., 2013, ApJ, 774, 68
- Díaz-Santos et al. (2014) Díaz-Santos T., et al., 2014, ApJ, 788, L17
- De Looze et al. (2014) De Looze I., et al., 2014, arXiv, arXiv:1402.4075
- De Looze et al. (2011) De Looze I., Baes M., Bendo G. J., Cortese L., Fritz J., 2011, MNRAS, 416, 2712
- Dowell et al. (2014) Dowell C. D., et al., 2014, ApJ, 780, 75
- Fathi et al. (2013) Fathi K., et al., 2013, ApJ, 770, L27
- Gallerani et al. (2012) Gallerani S., et al., 2012, A&A, 543, A114
- Gehrels (1986) Gehrels N., 1986, ApJ, 303, 336
- Hodge et al. (2013) Hodge J. A., et al., 2013, ApJ, 768, 91
- Hunt et al. (2014) Hunt L. K., et al., 2014, A&A, 561, A49
- Huynh et al. (2013) Huynh M. T., et al., 2013, MNRAS, 431, L88
- Imanishi & Nakanishi (2013) Imanishi M., Nakanishi K., 2013, AJ, 146, 47
- Iono et al. (2006) Iono D., et al., 2006, ApJ, 645, L97
- Iono et al. (2013) Iono D., et al., 2013, PASJ, 65, L7
- Izumi et al. (2013) Izumi T., et al., 2013, PASJ, 65, 100
- Karim et al. (2013) Karim A., et al., 2013, MNRAS, 432, 2
- Kennicutt & Evans (2012) Kennicutt R. C., Evans N. J., 2012, ARA&A, 50, 531
- Madau & Dickinson (2014) Madau P., Dickinson M., 2014, arXiv, arXiv:1403.0007
- Maiolino et al. (2005) Maiolino R., et al., 2005, A&A, 440, L51
- Maiolino et al. (2009) Maiolino R., Caselli P., Nagao T., Walmsley M., De Breuck C., Meneghetti M., 2009, A&A, 500, L1
- Maiolino et al. (2012) Maiolino R., et al., 2012, MNRAS, 425, L66
- McMullin et al. (2007) McMullin J. P., Waters B., Schiebel D., Young W., Golap K., 2007, ASPC, 376, 127
- Neri et al. (2014) Neri R., Downes D., Cox P., Walter F., 2014, A&A, 562, A35
- Okamoto, Shimizu, & Yoshida (2014) Okamoto T., Shimizu I., Yoshida N., 2014, PASJ, 66, 70
- Ono et al. (2014) Ono Y., Ouchi M., Kurono Y., Momose R., 2014, arXiv, arXiv:1403.4360
- Rawle et al. (2014) Rawle T. D., et al., 2014, ApJ, 783, 59
- Riechers et al. (2013) Riechers D. A., et al., 2013, Natur, 496, 329
- Riechers et al. (2014) Riechers D. A., et al., 2014, arXiv, arXiv:1404.7159
- Sargsyan et al. (2012) Sargsyan L., et al., 2012, ApJ, 755, 171
- Sargsyan et al. (2014) Sargsyan L., Samsonyan A., Lebouteiller V., Weedman D., Barry D., Bernard-Salas J., Houck J., Spoon H., 2014, arXiv, arXiv:1405.5759
- Scoville et al. (2014) Scoville N., et al., 2014, ApJ, 783, 84
- Sliwa et al. (2013) Sliwa K., et al., 2013, ApJ, 777, 126
- Smail et al. (2011) Smail I., Swinbank A. M., Ivison R. J., Ibar E., 2011, MNRAS, 414, L95
- Swinbank et al. (2012) Swinbank A. M., et al., 2012, MNRAS, 427, 1066
- Swinbank et al. (2014) Swinbank A. M., et al., 2014, MNRAS, 438, 1267
- Tamura et al. (2014) Tamura Y., Saito T., Tsuru T. G., Uchida H., Iono D., Yun M. S., Espada D., Kawabe R., 2014, ApJ, 781, L39
- Venemans et al. (2012) Venemans B. P., et al., 2012, ApJ, 751, L25
- Wagg et al. (2010) Wagg J., Carilli C. L., Wilner D. J., Cox P., De Breuck C., Menten K., Riechers D. A., Walter F., 2010, A&A, 519, L1
- Wagg et al. (2012) Wagg J., et al., 2012, ApJ, 752, L30
- Walter et al. (2009) Walter F., Riechers D., Cox P., Neri R., Carilli C., Bertoldi F., Weiss A., Maiolino R., 2009, Natur, 457, 699
- Wang et al. (2013) Wang R., et al., 2013, ApJ, 773, 44
- Wang et al. (2013) Wang S. X., et al., 2013, ApJ, 778, 179
- Wang, Chen, & Huang (2012) Wang W.-H., Chen H.-W., Huang K.-Y., 2012, ApJ, 761, L32
- Weiß et al. (2009) Weiß A., et al., 2009, ApJ, 707, 1201
- Willott, Omont, & Bergeron (2013) Willott C. J., Omont A., Bergeron J., 2013, ApJ, 770, 13
- Yoshida et al. (2006) Yoshida M., et al., 2006, ApJ, 653, 988