Upward curvature of the upper critical field and the V-shaped pressure dependence of in the noncentrosymmetric superconductor PbTaSe2
Abstract
The temperature evolution of the upper critical field in the noncentrosymmetric superconductor PbTaSe2 was determined via resistivity measurements down to 0.5 K. A pronounced positive curvature in the - phase diagram was observed in the whole temperature range below . The Seebeck coefficient in the temperature range 5K350K was found to be negative in sign, modest in magnitude and non-linear in temperature. In addition, the superconducting transition temperature under hydrostatic pressure shows a marked non-monotonic variation, decreasing initially with the applied pressure up to 5-10 kbar but then rising with further pressurization. The underlying physical mechanisms of all these findings have been discussed.
pacs:
74.62.Fj, 74.25.fc, 74.25.fg1 Introduction
Superconductors lacking inversion symmetry have attracted tremendous research interest since the discovery of superconductivity in the noncentrosymmetric (NCS) CePt3Si [1]. In the presence of inversion symmetry, Cooper pairs are either spin-singlet or spin-triplet, i.e, having well-defined parity. However, in NCS superconductors, the link between spatial symmetry and the Cooper pair spins may be broken and the admixture of singlet-triplet pairing is possible [2, 3, 4]. This is because the antisymmetric spin-orbit coupling (SOC) in the NCS superconductors may split the Fermi surface into two sheets with distinct spin helicities [2, 5]. The splitting of the Fermi surface therefore favors both the intra- and inter-band pairing, resulting in the admixture of spin-singlet and spin-triplet components, with the ratio of these two being tunable by the strength of SOC [2, 6]. Recently, NCS superconductors with strong SOC were proposed as potential platforms to realize so-called topological superconductivity [7, 8, 9]. The combination of strong SOC and broken inversion symmetry can give rise to topological superconductivity of class DIII [9].
The NCS compound PbTaSe2 was recently reported to be superconducting below 3.7 K [10]. The crystal structure of PbTaSe2 consists of stacked hexagonal TaSe2 layers alternating with Pb monolayers. In the TaSe2 layer, the Ta atom is located offset from the inversion center. Electronic structure calculations reveal a single Dirac cone in the Brillouin zone which is gapped by 0.8 eV due to large inherent SOC, in analogy to some topologically nontrivial materials [10]. On the other hand, the broken inversion symmetry of the crystal structure along with the large SOC manifests itself as a large band splitting of order of several tenths of an eV. All these features, namely, the lack of inversion symmetry and the strong SOC, appear to fulfill the necessary ingredients for realizing a parity-mixed superconducting state and topological superconductivity. Nevertheless, the superconducting and normal state properties of this material, which may provide valuable clues to the pairing mechanism, and potentially identify possible topological states, have not yet been well characterized.
With this aim in mind, we use electric and thermal transport as a probe to study the superconducting and normal state properties of PbTaSe2. The upper critical field of PbTaSe2 was determined by resistivity measurements down to 0.5 K [11, 12], and revealed a prominent upward curvature, regardless of the criteria used to determine . Detailed modelling of the data further suggests two-band superconductivity in PbTaSe2. The thermoelectric power (TEP) shows the nonlinearity in and the dominance of negative charge carriers. Remarkably, our pressure study demonstrates a clear V-shaped pressure dependence of , similar to that recently observed in AFe2As2 (A=K, Rb, Cs) [13, 14, 15]. The origin of this V-shaped diagram in PbTaSe2 is possibly due to a Lifshitz transition under pressure, in contrast to the change of pairing symmetry in AFe2As2 (A=K, Rb, Cs). Our findings may impose important constraints on any theory of exotic superconductivity in this system and provide some useful indications for the presence or absence of topological states.
2 Experiment
Polycrystalline samples of PbTaSe2 were prepared by a solid state reaction in evacuated quartz tubes, following similar procedures as given in Ref. [10]. Good crystallinity of the samples was identified by a x-ray powder diffractometer. Traces of an impurity phase of nonsuperconducting tantalum oxide, were still detectable. Resistivity was measured by a standard four-probe lock-in technique in a Quantum Design PPMS equipped with a 9 Tesla magnet. For the TEP measurements, a modified steady-state method was used in which a temperature gradient, measured using a constantan-chromel differential thermocouple, was set up across the sample via a chip heater attached to one end of the sample [16, 17, 18]. The thermopower voltage was read out by a nanovoltmeter K2182A from Keithley Instruments. For the hydrostatic pressure measurements, a commercial piston-type cell from Quantum Design was used, and Daphne 7373 oil was applied as the pressure transmission media. For the resistivity curves under pressure, the same contacts were used throughout the measurements such that the geometric errors in the contact size were identical for different pressures.
3 Results And Discussion
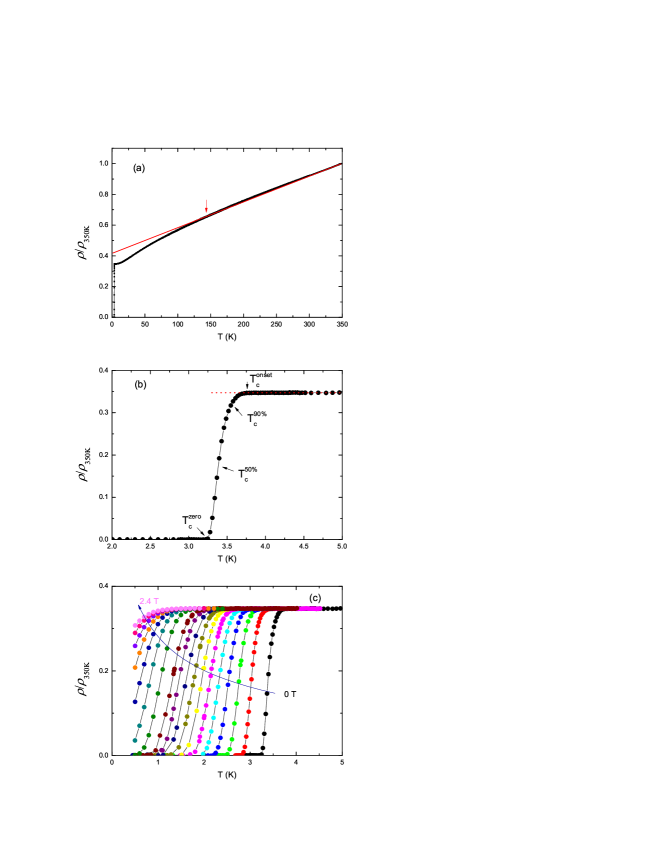
Figure 1(a) presents the zero-field resistivity of PbTaSe2 sample from 350 K down to 2 K. Zero resistivity of the superconducting transition is clearly seen, with the low- transition expanded in Fig. 1(b). We also note that our transition is slightly broader and the residual resisitivity ratio (RRR) is somewhat smaller than that reported in Ref. [10], mostly because of the higher disorder level or slight off-stoichiometry of Se in our samples, considering the high vapor pressure of Se in the reaction. The high- resistivity rises linearly with temperature above 150 K. This is consistent with its Debye temperature =143 K estimated from the heat capacity measurement, indicating the dominance of electron-phonon scattering at this -range [19]. The superconducting transition at various magnetic fields was studied by the fixed-field temperature sweeps down to 3He temperatures, presented in Fig. 1(c). In this study, four different criteria have been used to extract the critical temperature at each magnetic field, as exemplified in Fig. 1(b). These criteria include: The onset , 90% of the normal state , middle point and the zero resistance .
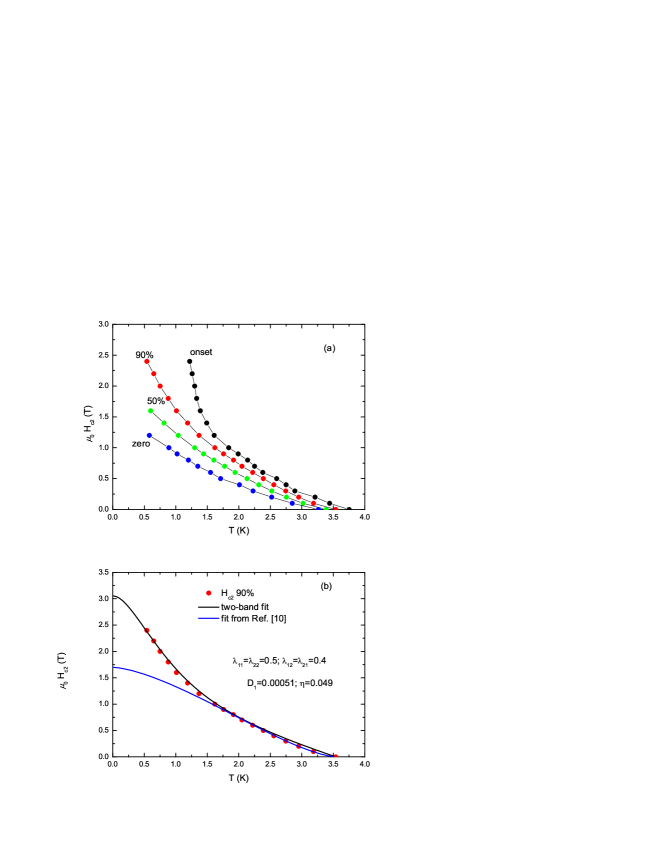
The resultant - diagram from these four criteria is cumulatively presented in Fig. 2(a). This diagram features, unlike most of superconductors whose has a negative/downward curvature, the evident upward curvatures for all four lines. Note this positive curvature is present for all below and it becomes very steep for the line at low . This overall upward curvature can not be explained by the Ginzburg-Landau theory, nor by the one-band Werthamer-Helfand-Hohenberg (WHH) model [20]. In Ref. [10], the formula =(0)(1-3/2)3/2 was applied to fit the data between 2.4 K to . However, we show in Fig. 2(b) that this formula actually deviates from the experimental data below 1.8 K. Instead, it is possible to capture the whole data set with the two-band theory, as the upward has also been observed in some two-gap superconductors, e.g., LaFeAsO0.89F0.11 [21], MgB2 [22] and Ca10(Pt4As8)((Fe1-xPtx)2As2)5 [23]. To analyze our experimental data on a quantitative footing, we now fit the curve with the two-band theory outlined in Ref. [24]. The equation of for a two-band superconductor is given by:
| (1) |
where =2(-)/, =1+(-)/, =1-(-)/, =, =, and . here is the digamma function. , denote the intraband coupling constants, and , are the interband coupling constants. and are the diffusivity of each band. The small may imply a much stronger scattering on one of the bands. Hence, there are totally six free parameters in the fitting process, , , , , and . Within this theoretical framework, we fit our experimental data from the 90 of criterion, as shown in Fig. 2(b). This two-band theory can overall fit the experimental data within the error bar and the resultant parameters are given in the figure. As can be seen, the intraband coupling slightly dominates the interband coupling while 1, indicating that electrons on one band are more scattered than on the other. However, it can not be concluded that the two-band superconductivity is wholly responsible for the upward curvature of in this material, in view of the number of free parameters in the fit. In fact, we also fit the data from 50 of criterion and obtain ==0.5, ==0.4, =0.000575 and =0.071, also suggestive of the much stronger scattering on one band. Although these data can not exclusively rule out other possible scenarios, which will be discussed later, they do indicate that two-band superconductivity appears to be a plausible mechanism in PbTaSe2 [25].
Let us discuss other possible scenarios for the upward curvature in . In the organic superconductor (TMTSF)2PF6, also has a pronounced upward curvature and no sign of saturation was observed down to 0.1 K [26]. However, its at K exceeds the Pauli paramagnetic limit by a factor of 2-3. Therefore, the upward curvature was attributed to the signature of spin-triplet pairing. In the case of PbTaSe2, its at 0.5 K is still much lower than its Pauli limit, suggesting that the orbital effect dominates in limiting its . One theory accounting for the strong upward curvature observed in the cuprates [27, 28] was associated with the quantum critical point in these systems [29]. In our system, however, there is no clear sign to show it is in proximity to the quantum critical regime.
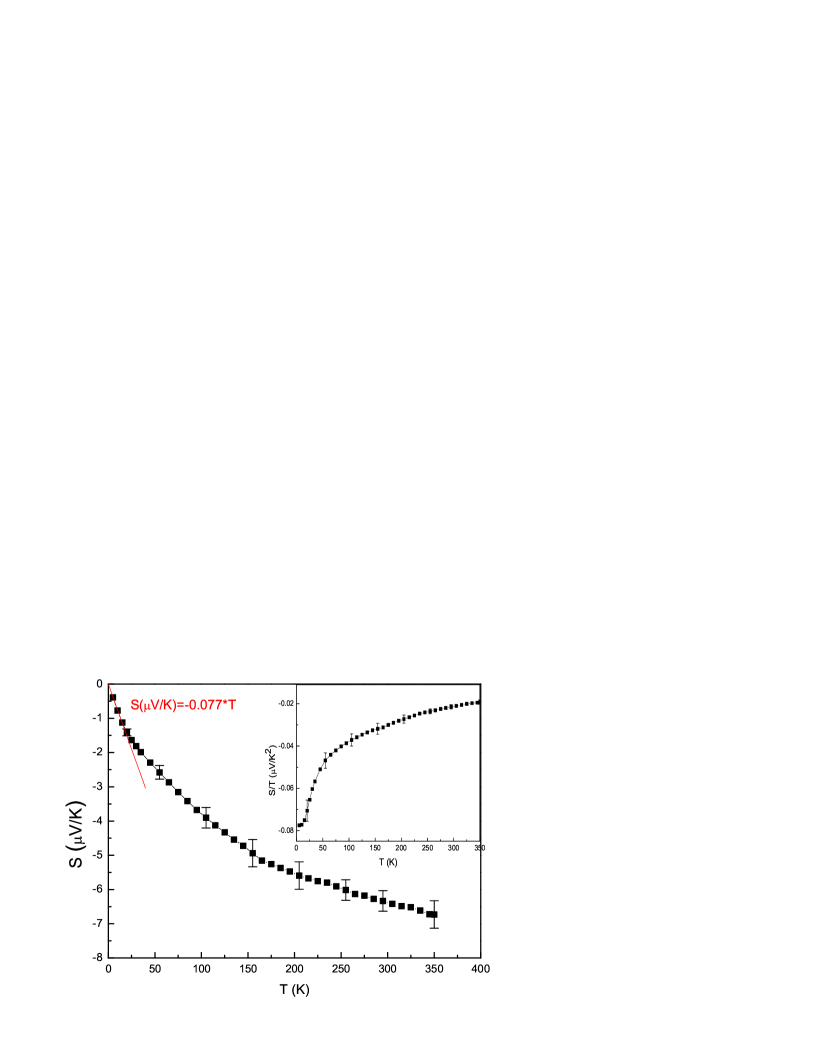
The Seebeck coefficient or TEP reveals important aspects of charge conduction in a material [30, 31]. Figure 3 shows the Seebeck coefficient of PbTaSe2 from 350 K down to 5 K. Evidently, its TEP, of modest magnitude, is negative over the entire -range studied, indicating the dominance of electron carriers. In a single-band metal, according to the Sommerfeld theory, TEP is given by =-, where is the Fermi energy [19, 32]. This leads to a -linear Seebeck coefficient. In reality, the situation may become complicated due to the presence of other excitations. In a metal with both electrons and holes, the electron and hole partial Seebeck coefficients add together according to their weights in conduction [30, 31], i.e., =()+(). and are the Sommerfeld values (both linear in ) given above. Provided that electron and hole partial weights in conduction also change with , a nonlinear-in- Seebeck coefficient can naturally emerge. Indeed, from ab initio calculations [10], the Fermi surface of PbTaSe2 consists of both electron and hole pockets. On the other hand, since the electron pocket dominates, we may apply the single-band Sommerfeld equation quoted above to make a crude estimate of the Fermi energy of this material. From Fig. 3, the linear fit at low gives 480 meV.
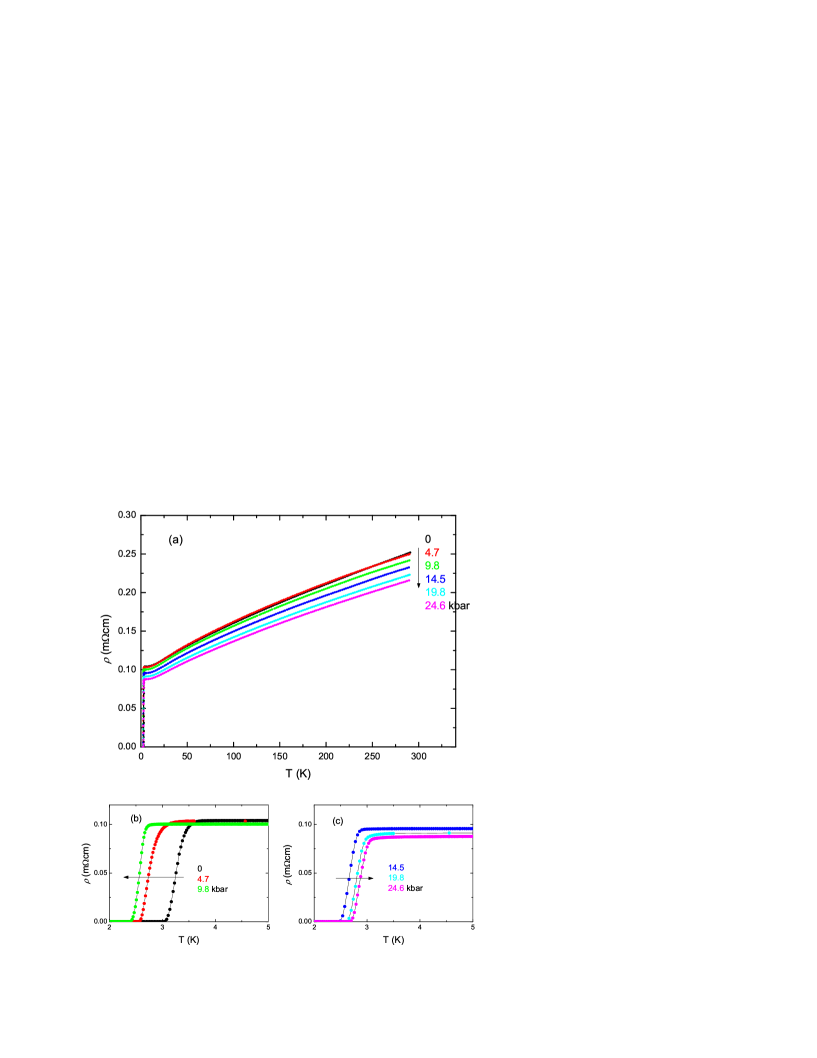
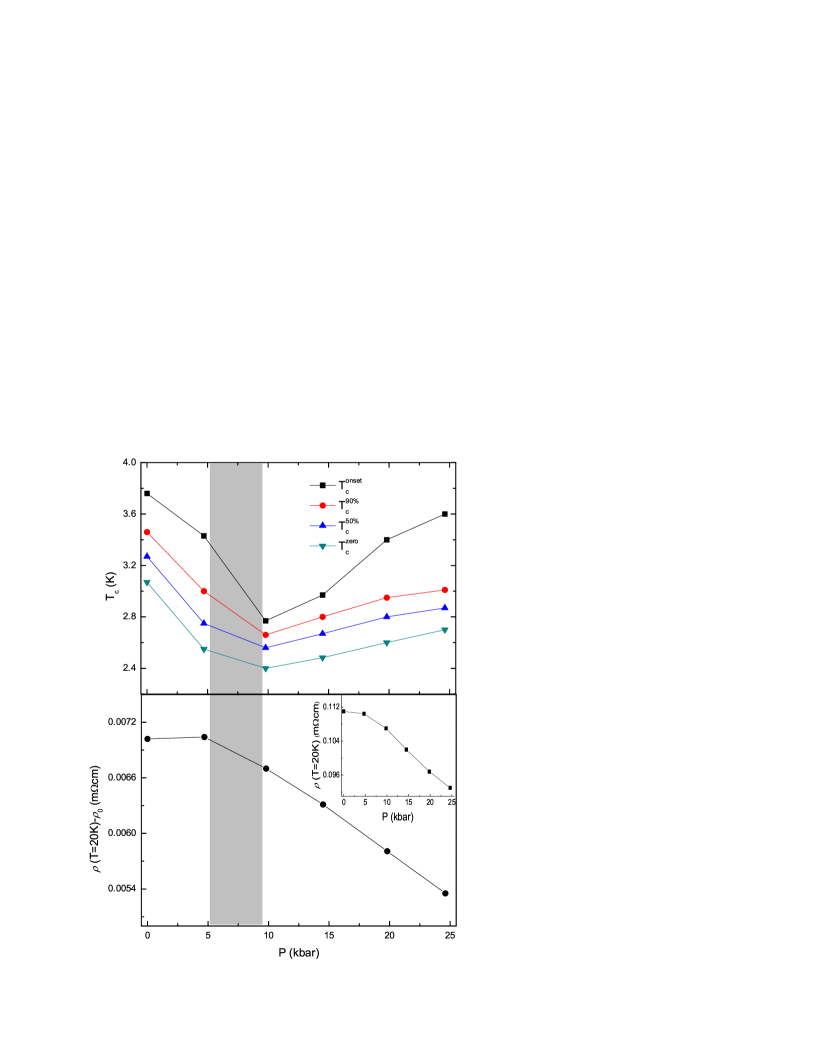
Shown in Fig. 4(a) is the pressure dependence of the resistivity of PbTaSe2 up to 25 kbar. With increasing pressure, the resistivity of the sample decreases systematically, while the pressure seems to have little bearing on its overall dependence. The resistivity at room temperature changes by about 15 at 25 kbar. Interestingly, although the metallicity of the sample is enhanced by the pressure, its shows a nonmonotonic variation, from an initial decrease with pressure to an increase once across a critical pressure, as demonstrated in Fig. 4(b) and 4(c). Note that of this sample is about 0.2 K lower than that presented in Fig. 1(b). This discrepancy may arise from the sample off-stoichiometry even if they were harvested from the same batch. Utilizing the same criteria as in Fig. 1(b), we plot the pressure dependence of in Fig. 5(a). Remarkably, regardless of the criteria used, is firstly reduced by the pressure up to 5-10 kbar, after which it starts to reverse to higher , similar to the effects of hydrostatic pressure on iron-based superconductors AFe2As2 (A=K, Rb, Cs) [13, 14, 15].
The origin of this reversal under pressure has been extensively discussed by F. Tafti et al. in their works [13, 14, 15]. This includes a change of the pairing symmetry or a Lifshitz transition across , i.e., an abrupt change of Fermi surface topology. In AFe2As2 (A=K, Rb, Cs), they argued that the V-shaped pressure dependence of was the result of a change in pairing symmetry from -wave state below to an above . A Lifshitz transition was ruled out in their data, as there were no visible changes in either the Hall or resistivity data across . Following the same procedure given in Ref. [15], we plot the inelastic scattering, defined as (T=20 K)- where is the residual resistivity at each pressure, as a function of pressure in Fig. 5(b). We should mention that the choice of =20 K is arbitrary but any other cuts above do not affect the results. The plot of (20K) in the inset also shows a similar dependence. In contrast to AFe2As2 (A=K, Rb, Cs), the inelastic scattering in PbTaSe2 displays a sharp drop at a critical pressure somewhere between 5 kbar to 10 kbar (the shaded area in the figure), where also shows a sharp inversion. This makes a compelling case that the reversal in this system is most likely due to a Lifshitz transition around (5-10 kbar).
4 Conclusion
To summarize, we report a strong positive curvature in the - diagram of the NCS superconductor PbTaSe2. Its Seebeck coefficient was found to be negative in sign and to vary non-linearly with . All these experimental data appear to be consistent with a picture of two-band superconductivity in PbTaSe2, while other possible mechanisms have also been discussed. Interestingly, the recent theoretical proposal of the large Seebeck coefficient arising from topological Dirac fermions has not been seen in our samples [33]. The pressure dependence of the superconducting transition shows a clear ’V’ shape, which most likely results from a Lifshitz transition under pressure. Further studies are highly desired to explore the possible parity-mixed state by using ultralow- thermal conductivity and/or penetration depth measurements.
5 Acknowledgement
The authors would like to thank N. E. Hussey, C. M. J. Andrew, C. Lester, A. F. Bangura, Xin Lu, Zengwei Zhu, Xiaofeng Jin for valuable discussions. This work was supported by the National Key Basic Research Program of China (Grant No. 2014CB648400) and by NSFC (Grant No. 11474080, 11104051, 11104053). X.X. would also like to acknowledge the auspices from the Distinguished Young Scientist Funds of Zhejiang Province (LR14A040001).
References
References
- [1] Bauer E, Hilscher G, Michor H, Paul C, Scheidt E W, Gribanov A, Seropegin Y, Noel H, Sigrist M and Rogl P 2004 Phys. Rev. Lett. 92 027003
- [2] Yuan H Q, Agterberg D F, Hayashi N, Badica P, Vandervelde D, Togano K, Sigrist M and Salamon M B 2006 Phys. Rev. Lett. 97 017006
- [3] Chen J, Jiao L, Zhang J L, Chen Y, Yang L, Nicklas M, Steglich F and Yuan H Q 2013 Phys. Rev. B 88 144510
- [4] Tafti F F et al 2013 Phys. Rev. B 87 184504
- [5] Shimozawa M, Goh S K, Endo R, Kobayashi R, Watashige T, Mizukami Y, Ikeda H, Shishido H, Yanase Y, Terashima T, Shibauchi T and Matsuda Y 2014 Phys. Rev. Lett. 112 156404
- [6] Nishiyama M, Inada Y and Zheng G Q 2007 Phys. Rev. Lett. 98 047002
- [7] Chadov S, Qi X, Kbler J, Fecher G H, Felser C and Zhang S C 2010 Nat. Mater. 9 541
- [8] Lu C K and Yip S K 2010 Phys. Rev. B 82 104501
- [9] Hasan M Z and Kane C L 2010 Rev. Mod. Phys. 82 3045
- [10] Ali M N, Gibson Q D, Klimczuk T and Cava R J 2014 Phys. Rev. B 89 020505
- [11] Niu C Q, Yang J H, Li Y K, Chen B, Zhou N, Chen J, Jiang L L, Chen B, Yang X X, Cao C, Dai J and Xu X 2013 Phys. Rev. B 88 104507
- [12] Zhou N, Xu X, Wang J R, Yang J H, Li Y K, Guo Y, Yang W Z, Niu C Q, Chen B, Cao C and Dai J 2014 Phys. Rev. B 90 094520
- [13] Tafti F F et al 2013 Nat. Phys. 9 349
- [14] Tafti F F et al 2014 Phys. Rev. B 89 134502
- [15] Tafti F F et al 2015 Phys. Rev. B 91 054511
- [16] Xu X, Bangura A F, Niu C Q, Greenblatt M, Yue S, Panagopoulos C and Hussey N E 2012 Phys. Rev. B 85 195101
- [17] Wakeham N, Bangura A F, Xu X, Mercure J F, Greenblatt M and Hussey N E 2011 Nat. Commun. 2 396
- [18] Bangura A F, Xu X, Wakeham N, Peng N, Horii S and Hussey N E 2013 Sci. Rep. 3 3261
- [19] Ashcroft and Mermin, Solid State Physics (Cornell University Press, Cornell, 1975)
- [20] Werthamer N R, Helfand E and Hohenberg P C 1966 Phys. Rev. 147 295
- [21] Hunte F et al 2008 Nature 453 903
- [22] de Lima O F, Ribeiro R A, Avila M A, Cardoso C A and Coelho A A 2001 Phys. Rev. Lett. 86 5974
- [23] Mun E, Ni N, Allred J M, Cava R J, Ayala O, McDonald R D, Harrison N and Zapf V S 2012 Phys. Rev. B 85 100502
- [24] A. Gurevich 2003 Phys. Rev. B 67 184515
- [25] In principle, the Hall effect may be used to identify the multiband behaviors. However, the Hall signal in this material is difficult to measure, possibly because of two reasons. First, in the Hall measurements, the sample needs to be thin in order to get large Hall signals, however, our sample is very hard to be cleaved or polished to a thin plate. Second, in a two-carrier model, the Hall coefficient at low fields is given by =, where and are the conductivity and Hall coefficient of carriers, respectively (Note that and are opposite in sign). The resultant Hall effect may become very small due to the substantial cancellation of hole and electron components.
- [26] Lee I J, Naughton M J, Danner G M and Chaikin P M 1997 Phys. Rev. Lett. 78 3555
- [27] Mackenzie A P, Julian S R, Lonzarich G G, Carrington A, Hughes S D, Liu R S and Sinclair D C 1993 Phys. Rev. Lett. 71 1238
- [28] Osofsky M S et al 1993 Phys. Rev. Lett. 71 2315
- [29] Kotliar G and Varma C M 1996 Phys. Rev. Lett. 77 2296
- [30] Cohn J L, White B D, dos Santos C A M and Neumeier J J 2012 Phys. Rev. Lett. 108 056604
- [31] Cohn J L, Moshfeghyeganeh S, dos Santos C A M and Neumeier J J 2014 Phys. Rev. Lett. 112 186602
- [32] K. Behnia 2009 J. Phys.: Condens. Matter 21 113101
- [33] Xu Y, Gan Z and Zhang S C 2014 Phys. Rev. Lett. 112 226801