Synchronization and Phase Noise Reduction in Micromechanical Oscillators Arrays Coupled through Light
Abstract
Synchronization of many coupled oscillators is widely found in nature and has the potential to revolutionize timing technologies. Here we demonstrate synchronization in arrays of silicon nitride micromechanical oscillators coupled in an all-to-all configuration purely through an optical radiation field. We show that the phase noise of the synchronized oscillators can be improved by almost 10 dB below the phase noise limit for each individual oscillator. These results open a practical route towards synchronized oscillator networks.
Nano- and micromechanical oscillator arrays have the potential to enable high power and low noise integrated frequency sources that play a key role in sensing and the essential time keeping of modern technology craighead_nanoelectromechanical_2000 ; zhang_rapid_2006 ; shim_synchronized_2007 ; bargatin_large-scale_2012 ; nguyen_mems_2007 . The challenge with building scalable oscillator arrays is that micromechanical oscillators fabricated on a chip fundamentally have a spread of mechanical frequencies due to unavoidable statistical variations in the fabrication process bargatin_large-scale_2012 ; matheny_phase_2014 ; bagheri_photonic_2013 ; zhang_synchronization_2012 ; agrawal_observation_2013 . This dispersion in mechanical frequencies has a detrimental effect on the coherent operation in arrays of micromechanical oscillators. Here we show that arrays consisting of three, four and seven dissimilar microscale optomechanical oscillators can be synchronized to oscillate in unison coupled purely through a common optical cavity field using less than a milliwatt of optical power. We further demonstrate that the phase noise of the oscillation signal can be reduced by a factor of below the thermomechanical phase noise limit of each individual oscillator as oscillators are synchronized, in agreement with theoretical predictions pikovsky_synchronization:_2003 ; chang_phase_1997 . The highly efficient, low loss and controllable nature of light mediated coupling could put large scale nano- and micromechanical oscillator networks in practice heinrich_collective_2011 ; holmes_synchronization_2012 ; shah_master-slave_2015 ; safavi-naeini_two-dimensional_2014 ; aspelmeyer_cavity_2014 ; botter_optical_2013 ; shkarin_optically_2014 .
Synchronization is a ubiquitous phenomenon found in coupled oscillator systems pikovsky_synchronization:_2003 ; strogatz_sync:_2003 . Heart beat is a result of synchronized motion of pace maker cells peskin_mathematical_1975 , circadian rhythm arises because of coordinated body physiology reppert_coordination_2002 and global positioning system relies on synchronized operation of clocks. On the nanoscale, synchronization has been experimentally demonstrated in nanomechanical systems coupled through mechanical connections shim_synchronized_2007 , electrical capacitors agrawal_observation_2013 , off-chip connections matheny_phase_2014 and through an optical cavity bagheri_photonic_2013 ; zhang_synchronization_2012 . However, these demonstrations were limited to only two oscillators. Achieving synchronization in large micromechanical oscillator networks requires scalable oscillator units and efficient and controllable coupling mechanisms heinrich_collective_2011 ; holmes_synchronization_2012 ; lauter_pattern_2015 .
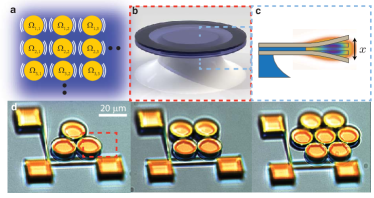
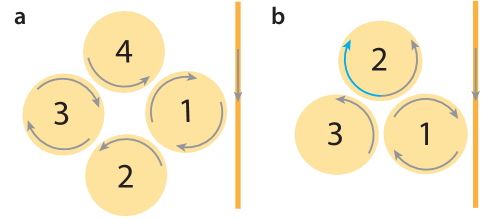
Here we experimentally demonstrate that arrays of free running micromechanical oscillators can be synchronized when coupled purely through a common electromagnetic field as predicted by theories heinrich_collective_2011 ; holmes_synchronization_2012 . A conceptual view of an array of mechanical resonators coupled through light is illustrated in Figure 1a. Each optomechanical oscillator (OMO) possesses a slightly different frequency of mechanical oscillation () and is only connected through a common optical field (blue background). When a continuous wave laser is coupled to a common electromagnetic field mode spanning several micromechanical oscillators, the light can provide both the drive for self-sustaining oscillations and the necessary coupling between the individual oscillators for synchronization through optical forces. When the laser power is just above the self-sustaining oscillation threshold of the mechanical oscillators, they are expected to vibrate at their natural frequencies . When the laser power is high so that the optically mediated coupling is strong enough to overcome the difference in , the mechanical oscillators can reach synchronization.
The effective coupling between the mechanical resonators can be visualized through the following equation
| (1) | |||
where ,, are the mechanical displacement, damping and the mechanical frequency of the th OMO and is the amplitude of the coupled optical supermode that spatially spans all cavities in the array. It is clear from the equation above that the optical force () depends on the energy stored in the optical supermode which is affected by the displacement of each individual cavity. Therefore the optical field provides an effective nonlinear mechanical coupling between the different oscillators that form the basis for synchronization zhang_synchronization_2012 ; bagheri_photonic_2013 ; holmes_synchronization_2012 . The onset of synchronization, which intrinsically relies on nonlinearity cross_synchronization_2004 , could therefore be captured as () is increased through increasing the optical driving power bagheri_photonic_2013 .
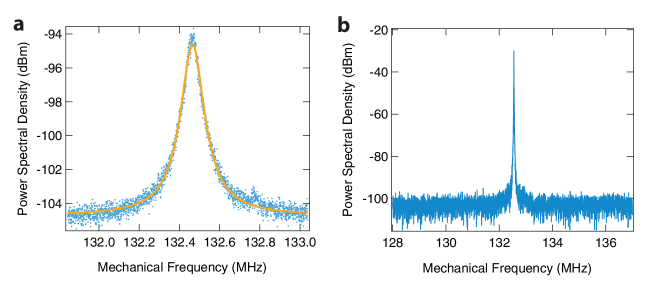
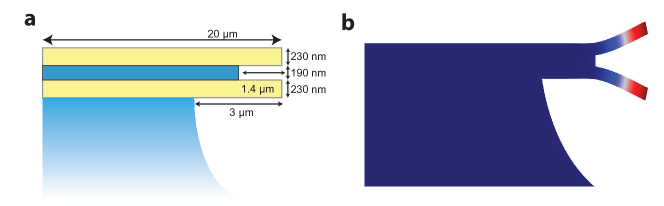
The individual oscillator we use is a double-disk OMO (Figures 1b and 1c) composed of two free-standing silicon nitride circular edges that support high quality () factor optical and mechanical modes zhang_eliminating_2014 ; lin_mechanical_2009 . The co-localized modes shown in Figure 1c lead to a strong coupling between the optical and the mechanical degree of freedom. When the cavity is excited by a continuous wave laser above the oscillation threshold, the free-standing edges oscillate coherently and modulate the laser producing a radio frequency (RF) tone at the mechanical frequency of the vibrating edges. Fabrication variation causes the mechanical frequency of different OMOs in our arrays to spread around MHz centered at 132.5 MHz seeSI .
We fabricate micromechanical oscillator arrays with double-disk OMOs that are optically coupled through the evanescent field. The OMOs are physically separated by a narrow gap ( nm) which precludes any mechanical connections while the optical evanescent field can still propagate through the gap. Mechanical coupling through the substrate connection is negligible as the mechanical mode we excite is a high mode that is well isolated from the substrate zhang_eliminating_2014 .
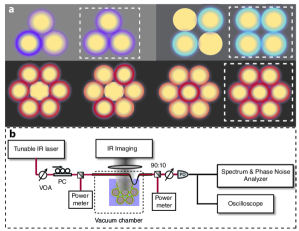
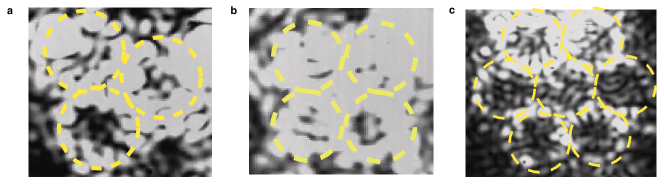
We excite the optical supermode that spatially span over all cavities to ensure that there is optical coupling among all cavities (Fig. 2a dashed boxes). The strong optical coupling between the optical modes of each individual cavity leads to the formation of optical supermodes that have different optical frequencies and spatial geometries seeSI . Figure 2a illustrates the spatial intensity profile of different optical supermodes when the optical resonant frequency of individual cavity is identical. The higher intensity regions are illustrated by higher opacity of the halos around the cavities. We position a tapered optical fiber to the close proximity of one OMO in the arrays to couple light to the spatial evenly distributed optical modes (dashed lines in Fig. 2a) while using an infrared (IR)-camera to monitor the scattered intensity from the arrays making sure all OMOs are excited. We monitor the transmission through the tapered fiber by an amplified photodiode and feed the electrical signal to a spectrum analyzer.
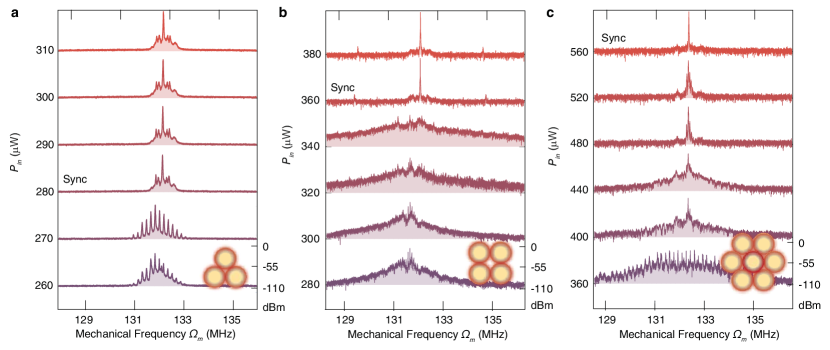
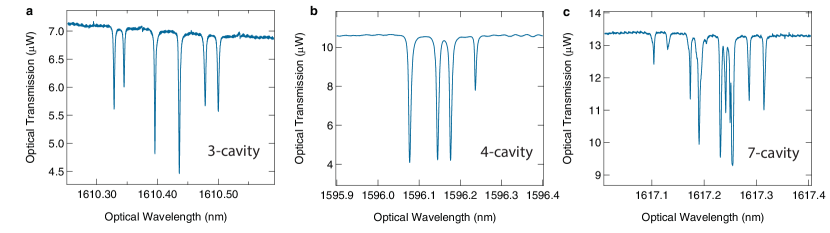
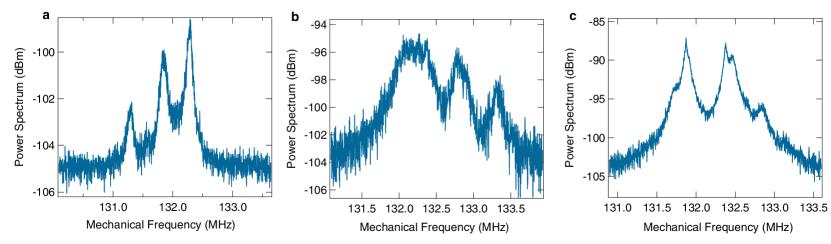
We show the onset of synchronization by increasing the excitation laser power which effectively increases the coupling between the OMOs. The laser wavelength is blue detuned relative to the resonance of the optical supermode that evenly spans all the OMOs (Fig. 2a dashed boxes) enabling optomechanical amplification. In the three coupled OMO array, as the laser power increases well beyond the oscillation threshold for each individual oscillator, the radio frequency (RF) spectrum of the OMOs show many strong oscillation peaks and a broad noise floor (Fig. 3a). The distinct oscillation peaks form because is different for each OMO and they beat to generate many RF tones hossein-zadeh_observation_2008 ; huang_internal_2012 . The increase in the noise floor is likely due to finite interaction between the mechanical modes mediated by the optical field but not yet strong enough to transition into a locked state bagheri_photonic_2013 ; okawachi_octave-spanning_2011 ; delhaye_self-injection_2014 . As the laser power further increases to W, the onset of synchronization (Fig. 3a) is evident as the peaks on the RF spectrum merge into a single large peak and the noise floor is reduced. The much weaker sidebands around the main oscillation signal are due to the much weaker oscillatory motion induced by thermal force displacing the OMOs from the synchronized state bagheri_photonic_2013 . In four and seven coupled OMO arrays, similar to the three-cavity system, we observe beating between different mechanical modes and a broad noise floor when the optical power is below the synchronization threshold. As the laser power is increased, a single oscillation peak appears accompanied with a sudden drop in the noise floor signifying the onset of synchronization (Fig. 3b,c).
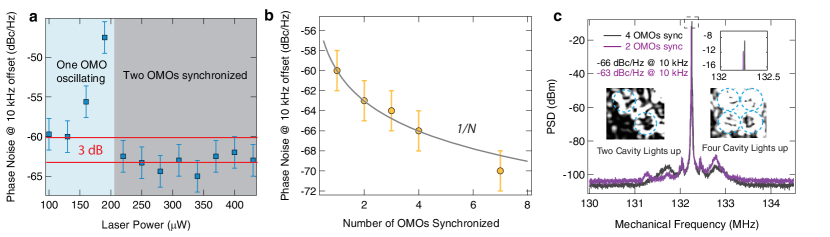
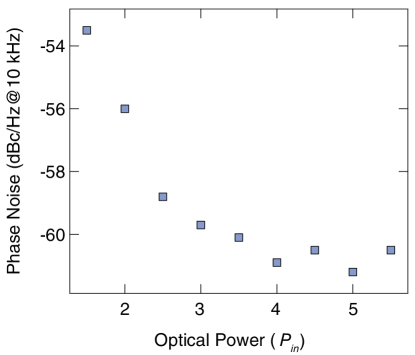
We show that in large arrays of OMOs, the phase noise of the synchronized signal can be reduced below the thermomechanical noise limit of an individual OMO by almost 10 dB. The phase noise of the modulated output light is expected to drop as the oscillators are synchronized matheny_phase_2014 ; pikovsky_synchronization:_2003 ; chang_phase_1997 . We measure the phase noise of our oscillators at 10 kHz offset from the carrier oscillation frequency, where the phase noise of our oscillator is dominated by thermomechanical fluctuation fong_phase_2014 ; tallur_phase_2010 ; hossein-zadeh_characterization_2006 ; seeSI , a fundamental limit imposed to the mechanical oscillator due to the thermal bath of the environment. In figure 4a, we show the measured phase noise in a OMO array zhang_synchronization_2012 . As shown in figure 4a, the single OMO phase noise seeSI at low optical power is dBc/Hz and gradually increases as the laser power is increased. The increase of phase noise is due to phase slipping between the two OMOs matheny_phase_2014 . As the coupling between the OMOs increases with increasing laser power, they synchronize. As expected, we observe the phase noise drops by dB as the two OMOs move from one OMO oscillating state to a synchronized oscillation state. Since the oscillators are nearly identical, synchronized oscillations can be viewed as two oscillators operating coherently providing a larger effective mass while not reducing the oscillation frequency tallur_phase_2010 . In figure 4c, we show the measured phase noise of each large array of oscillators by driving the system at high optical powers at the optimal optical detuning where the phase noise is a minimum seeSI . The lowest phase noise measured in each array of different sizes is plotted in figure 4b. The measured phase noise follows the dependence predicted by theory pikovsky_synchronization:_2003 ; chang_phase_1997 ; tallur_phase_2010 ; cross_improving_2012 .
The drop in phase noise can also be used to determine the number of synchronized OMOs in a single array oscillating in different states. We measure the phase noise in the array as the oscillators change from a state where only two OMOs are oscillating to a state where all four OMOs are oscillating, as we infer from the light scattering intensities captured on the IR camera. Figure 4c shows the power spectrum of the transmitted light when the laser is tuned from an optical mode that spans two cavities to an optical mode that spans all four cavities (Fig. 2a) while staying at the same optical power. Following the transition, the four OMO oscillation state shows an increase of dB in the oscillation signal and dB drop in the phase noise. At the same time, all four resonators light up on the IR camera. The drop in phase noise and the change of scattering intensity on the IR camera strongly indicate that the array changes from two to four synchronized oscillators.
In conclusion, we demonstrate synchronization in integrated arrays of micromechanical oscillators coupled through a common optical field. We show the onset of synchronization in the arrays by tracking the emergence of a single oscillation frequency in the optical power spectrum. Synchronization is further corroborated by the drop in phase noise in the oscillator arrays. The reduction of phase noise with oscillator array size and the scalability of our devices could enable low noise and high power integrated frequency sources. Our work paves a path towards large scale monolithically fabricated oscillator networks that have the potential to compete with the performance of bulk resonators and to exhibit rich nonlinear dynamics opening the door to novel metrology, communication and computing techniques hoppensteadt_synchronization_2001 ; mari_measures_2013 .
We acknowledge Richard Rand and Gustavo Wiederhecker for fruitful discussion about our results. The authors gratefully acknowledge support from DARPA for award No. W911NF-11-1-0202. The authors also acknowledge Applied Optronics and from DARPA for award No. W911NF-14-C0113. This work was performed in part at the Cornell NanoScale Facility, a member of the National Nanotechnology Infrastructure Network, which is supported by the National Science Foundation (Grant ECCS-0335765). This work made use of the Cornell Center for Materials Research Facilities supported by the National Science Foundation under Award Number DMR-1120296. The authors also acknowledge Paul McEuen for use of lab facilities.
References
- 1 Craighead, H. G. Science 290(5496), 1532–1535 November (2000).
- 2 Zhang, J., Lang, H. P., Huber, F., Bietsch, A., Grange, W., Certa, U., Mckendry, R., Güntherodt, H.-J., Hegner, M., and Gerber, C. Nat Nano 1(3), 214–220 December (2006).
- 3 Shim, S.-B., Imboden, M., and Mohanty, P. Science 316(5821), 95–99 April (2007).
- 4 Bargatin, I., Myers, E. B., Aldridge, J. S., Marcoux, C., Brianceau, P., Duraffourg, L., Colinet, E., Hentz, S., Andreucci, P., and Roukes, M. L. Nano Lett. 12(3), 1269–1274 March (2012).
- 5 Nguyen, C.-C. IEEE Transactions on Ultrasonics, Ferroelectrics, and Frequency Control 54(2), 251–270 February (2007).
- 6 Matheny, M. H., Grau, M., Villanueva, L. G., Karabalin, R. B., Cross, M., and Roukes, M. L. Phys. Rev. Lett. 112(1), 014101 January (2014).
- 7 Bagheri, M., Poot, M., Fan, L., Marquardt, F., and Tang, H. X. Phys. Rev. Lett. 111(21), 213902 November (2013).
- 8 Zhang, M., Wiederhecker, G. S., Manipatruni, S., Barnard, A., McEuen, P., and Lipson, M. Phys. Rev. Lett. 109(23), 233906 December (2012).
- 9 Agrawal, D. K., Woodhouse, J., and Seshia, A. A. Phys. Rev. Lett. 111(8), 084101 August (2013).
- 10 Pikovsky, A., Rosenblum, M., and Kurths, J. Synchronization: A Universal Concept in Nonlinear Sciences. Cambridge University Press, April (2003).
- 11 Chang, H.-C., Cao, X., Mishra, U. K., and York, R. IEEE Transactions on Microwave Theory and Techniques 45(5), 604–615 May (1997).
- 12 Heinrich, G., Ludwig, M., Qian, J., Kubala, B., and Marquardt, F. Phys. Rev. Lett. 107(4), 043603 July (2011).
- 13 Holmes, C. A., Meaney, C. P., and Milburn, G. J. Phys. Rev. E 85(6), 066203 June (2012).
- 14 Shah, S. Y., Zhang, M., Rand, R., and Lipson, M. Phys. Rev. Lett. 114(11), 113602 March (2015).
- 15 Safavi-Naeini, A. H., Hill, J. T., Meenehan, S., Chan, J., Gröblacher, S., and Painter, O. Phys. Rev. Lett. 112(15), 153603 April (2014).
- 16 Aspelmeyer, M., Kippenberg, T. J., and Marquardt, F. Rev. Mod. Phys. 86(4), 1391–1452 December (2014).
- 17 Botter, T., Brooks, D. W. C., Schreppler, S., Brahms, N., and Stamper-Kurn, D. M. Phys. Rev. Lett. 110(15), 153001 April (2013).
- 18 Shkarin, A., Flowers-Jacobs, N., Hoch, S., Kashkanova, A., Deutsch, C., Reichel, J., and Harris, J. Phys. Rev. Lett. 112(1), 013602 January (2014).
- 19 Strogatz, S. Sync: The Emerging Science of Spontaneous Order. Hyperion, March (2003).
- 20 Peskin, C. S. and Sciences, C. I. o. M. Mathematical aspects of heart physiology. Courant Institute of Mathematical Sciences, New York University, (1975).
- 21 Reppert, S. M. and Weaver, D. R. Nature 418(6901), 935–941 August (2002).
- 22 Lauter, R., Brendel, C., Habraken, S. J. M., and Marquardt, F. arXiv:1501.01509 [cond-mat, physics:nlin] January (2015). arXiv: 1501.01509.
- 23 Cross, M. C., Zumdieck, A., Lifshitz, R., and Rogers, J. L. Phys. Rev. Lett. 93(22), 224101 November (2004).
- 24 Zhang, M., Luiz, G., Shah, S., Wiederhecker, G., and Lipson, M. Applied Physics Letters 105(5), 051904 August (2014).
- 25 Lin, Q., Rosenberg, J., Jiang, X., Vahala, K. J., and Painter, O. Phys. Rev. Lett. 103(10), 103601 August (2009).
- 26 See supplemental information at url for additional data and theoretical analysis, which includes Refs. 37, 38, 39.
- 27 Hossein-Zadeh, M. and Vahala, K. J. Applied Physics Letters 93(19), 191115 November (2008).
- 28 Huang, C., Fan, J., Zhang, R., and Zhu, L. Applied Physics Letters 101(23), 231112 December (2012).
- 29 Okawachi, Y., Saha, K., Levy, J. S., Wen, Y. H., Lipson, M., and Gaeta, A. L. Optics Letters 36(17), 3398 September (2011).
- 30 Del’Haye, P., Beha, K., Papp, S. B., and Diddams, S. A. Phys. Rev. Lett. 112(4), 043905 January (2014).
- 31 Fong, K. Y., Poot, M., Han, X., and Tang, H. X. Phys. Rev. A 90(2), 023825 August (2014).
- 32 Tallur, S., Sridaran, S., Bhave, S., and Carmon, T. In Frequency Control Symposium (FCS), 2010 IEEE International, 268–272, June (2010).
- 33 Hossein-Zadeh, M., Rokhsari, H., Hajimiri, A., and Vahala, K. J. Phys. Rev. A 74(2), 023813 August (2006).
- 34 Cross, M. C. Phys. Rev. E 85, 046214 Apr (2012).
- 35 Hoppensteadt, F. and Izhikevich, E. IEEE Transactions on Circuits and Systems I: Fundamental Theory and Applications 48(2), 133–138 February (2001).
- 36 Mari, A., Farace, A., Didier, N., Giovannetti, V., and Fazio, R. Phys. Rev. Lett. 111(10), 103605 September (2013).
- 37 Haus, H. A. Waves and fields in optoelectronics. Prentice-Hall, Englewood Cliffs, NJ, (1984).
- 38 Leeson, D. Proceedings of the IEEE 54(2), 329–330 February (1966).
- 39 Laurila, T., Joutsenoja, T., Hernberg, R., and Kuittinen, M. Applied Optics 41(27), 5632 September (2002).
S1 Supplemental Information
A Optical Transmission
The challenge in optically coupling large arrays of mechanical structures is the variation of the optical frequencies of each individual OMO due to variation in the exact fabricated dimensions. This can be in principle compensated by integrating optical tuning mechanisms such as heaters. In our device, we overcome this challenge by ensuring that the optical coupling is large compare to the frequency variation and the individual decay rate of each cavity. The optical coupling strength we designed ( GHz) is much larger than the optical decay rate of the cavity ( MHz) and to the cavity optical frequency spread from fabrication variations ( GHz). This ensures that the optical modes are strongly coupled which means the light travels between the cavities many times before it is lost via other channels.
We estimate the spatial structure of the optical supermodes using coupled mode theory 37. In the OMO array, the coupled modes can be solved essentially using the same method as described in previous work of two coupled double disk OMOs 8. The evolution and coupling of each individual optical mode is described by a matrix where its diagonal entries describe the eigenfrequencies and the off-diagonal entries describe the coupling between these modes. In the case for the three- and seven- OMO arrays arranged in a triangular lattice, we must consider both the clock-wise and counter-clock wise optical modes, as both will be excited through a laser coupled to one direction even without any backscatters (Fig. S1).
The coupled mode equation that governs the optical part reads
| (S1) |
where are the total damping rate and the resonant frequency of each individual optical mode . is the optical coupling strength between th and th OMO. is the optical power that excites the array of resonators through the first cavity. is the optical criticality factor, the ratio between the cavity damping rate and the external coupling rate. For triangular lattice cases, the matrix dimension is increased from to where the both the cw and ccw degrees of freedoms are taken into account. In the strong coupling regime (), individual optical modes hybridize and fully splits into optical supermodes where some supermodes span over all cavities. The spatial geometry of these supermodes can be analyzed through rewriting equation S1 in the optical supermode basis where indicates the relative optical field amplitude in cavity . To conveniently visualize the spatial geometry of the optical supermode, we approximate and of individual OMO being identical. We can then exactly diagonalize the coupling matrix in equation S1 through Jordan matrix decomposition to find the new optical supermodes basis in superposition of the individual optical mode . The geometric representation of the superposition is shown in figure 2 in the main text.
Figure S3 shows images from the IR camera when the supermodes spanning over all cavities are excited. It is clear from the image that all cavities light up with approximately equal intensities. The strong coupling is also visualized by the fully split optical supermodes shown in the optical transmission in figure S2.
B Mechanical modes
The mechanical modes of the double disk are the flapping mechanical mode where we can control the mechanical frequency of the mode by the undercut depth of the sacrificial silicon dioxide layer. In the particular device we used in the experiment, we fabricated the devices with mechanical frequencies near 132.5 MHz and quality factor near 1000 (Fig. S4). Typical optical quality factor of these devices is 500,000. interaction strength between the optical and the mechanical mode is characterized by the optomechanical coupling strength GHz/nm for our devices 8.
In the OMO arrays, when the system is coupled to a laser at very low power, we measure a distribution of mechanical frequencies corresponding to different OMOs. Figure S5 shows the mechanical spectrum in the three, four and seven cavity arrays respectively. In the three OMO array, the mechanical frequencies are clearly different whereas in the four and seven OMO arrays, the mechanical mode frequencies are different but also overlapping.
C Phase Noise
We measure the phase noise of our oscillator by feeding the output of the photodiode (New Focus 1811) to a spectrum analyzer (Agilent E4407B). To measure the phase noise at 10 kHz offset frequency, we utilize the spot frequency measurement option in the phase noise measurement module (Option 226) of the spectrum analyzer which enables fast noise spectral power measurement at a single offset frequency.
In synchronized oscillator arrays, the phase noise reduces as the number of synchronized oscillators increase. Experiments and theories 11, 10 show that the noise reduces as where is the number of synchronized oscillators. This can be intuitively understood as coordinated oscillators while having the same frequency but having an increased effective mass which improves their resistance to thermomechanical fluctuations. In our system, proving synchronization by studying the dynamics of individual cavities in the arrays is desirable but it is technically challenging given the compact size of the array. Therefore we choose the phase noise as a figure of merit as it is fundamentally limited by the thermomechanical process.
The phase noise performance of an optomechanical oscillator, when limited by thermomechanical noise, improves when the laser power is increased. At high laser driving powers, the phase noise roughly stays constant as the laser power is further increased. We calibrate the single oscillator phase noise performance by measuring the phase noise at 10 kHz carrier offset at different laser driving powers. Figure S6 clear shows that the phase noise does not vary significantly when the power is above . where W is the typical threshold power for a single OMO. This is in agreement with the experimental observation reported by Mani et. al 33. and theory by Fong et. al 31.
Leeson’s model 38 predicts the phase noise of self-sustaining oscillators from the linewidth of the oscillation signal. The linewidth () of a thermally limited oscillator is given by
| (S2) |
where is Boltzmann’s constant, is the temperature, is the output power of the oscillator and is the natural damping rate of the oscillator. Since the double disk we use have a small effective mass (Fig. S7), which means a low oscillator power, the phase noise is limited by thermomechanical noise. The oscillator power is given by,
| (S3) |
where is the maximum displacement amplitude of the oscillator. Equation (S2) can be represented as,
| (S4) |
In our experiment, since the offset frequency we are interested in is much larger than the linewidth () of our oscillator, the phase noise in dBc/Hz predicted by Leeson’s equation38 can be simplified as,
| (S5) |
Substituting the parameters ( K; pg; kHz) and pm to equation S5, we obtain a theoretical estimate of the thermomechanical noise limit of our oscillators which is dBc/Hz at kHz carrier frequency offset in good agreement with our experimental measurements and previous frequency dependent phase noise measurements 14.
We expect the laser noise to be a minor contribution to the phase noise of our OMOs at 10 kHz carrier offset. Although diode lasers typically have relatively high phase noise, at this frequency, the phase noise of the laser is not relevant because the optical force is only affected by laser intensity. The cavity decay rate ( MHz) is much higher than 10 kHz which means the laser phase noise does not get converted in to intensity noise due to the cavity response. Typical relative intensity noise (RIN) of external cavity tunable laser at low frequencies is below -100 dBc/Hz 39. We measure the RIN of the laser we use (Tunics Reference) at 50 W to be -112 dBc/Hz at 10 kHz offset through the photodiode (New Focus 1811) and the spectrum analyzer (Agilent E4407B). As laser shot noise is much lower than technical noise at this laser power and frequency, we expect minimal contribution from the shot noise of the laser. Our analysis is consistent with previous theory 31.