A Simple Way to Estimate the Soft X-ray Class of Far-Side Solar Flares Observed with STEREO/EUVI
Abstract
Around the peaks of substantial flares, bright artifact nearly horizontal saturation streaks (B-streaks) corresponding to the brightest parts of the flare sources appear in the STEREO/EUVI 195 Å images. We show that the length of such B-streaks can be used for the solution of an actual problem of evaluating the soft X-ray flux and class of far-side flares registered with double STEREO spacecraft but invisible from Earth. For this purpose from data on about 350 flares observed from January 2007 to July 2014 (mainly exceeding the GOES M1.0 level) both with GOES and STEREO, an empirical relation is established correlating the GOES 1–8 Å peak flux and the B-streak length. This allowed us for the same years to estimate the soft X-ray classes for approximately 65 strong far-side flares observed by STEREO. The results of this simple and prompt method are consistent with the estimations of Nitta et al. (Solar Phys., 288, 241, 2013) based on the calculations of the EUVI full-disk digital number output. In addition, we studied some features of the B-streaks in impulsive and long-duration flares and demonstrated that B-streaks in several consecutive EUVI images can be used to reconstruct a probable time history of strong far-side flares.
keywords:
STEREO; Extreme Ultraviolet; Solar Flares; Saturation Streaks; GOES; Soft X-Rays1 Introduction
S-Introduction
In October 2006, the double Solar Terrestrial Relations Observatory (STEREO; \openciteKaiser2008) was launched, and at the end of January 2007 the two spacecraft separated and entered into heliocentric orbits near 1 AU in opposite directions. The Ahead (A) probe leads the Earth, while the Behind (B) probe lags behind the Earth, drifting about per year from the Sun–Earth line. In February 2011, the two STEREO spacecraft were already in the quadrature with the Earth, providing the first ever complete view of the Sun. At the end of July 2014, the two spacecraft were located on the opposite sides of the Earth’s orbit; STEREO-A was ahead of the Earth by , and STEREO-B was behind the Earth. Each STEREO spacecraft is equipped with an almost identical set of extreme ultraviolet, optical, radio, and in situ instruments. In particular, the Sun Earth Connection Coronal and Heliospheric Investigation suit (SECCHI; \openciteHoward2008) includes the Extreme Ultraviolet Imager (EUVI; \openciteWuelser2004) providing solar images in four channels of 171, 195, 284, and 304 Å.
With an increase of the longitudinal separation between the two STEREO spacecraft and each of them with the Sun–Earth line, the number of flares registered with the A and/or B probes but invisible from Earth has been growing. Among the problems in studies of the backside flares is classifying their importance, which would allow one to compare them with flares recorded by near-Earth satellites. STEREO observations and information about the importance of far-side flares are significant for investigations of such solar activity phenomena as flares themselves, eruptions, large-scale coronal waves, coronal mass ejections (CMEs), solar energetic particles (SEPs). These observational studies are promising to achieve further progress in understanding and modeling these phenomena as well as space weather forecasting (e.g., \openciteHudson2011; \openciteLugaz2012; \openciteWebb2012; Nitta et al. 2013a; 2013b; \openciteAschwanden2014; \openciteLi2014; \openciteRichardson2014; \openciteKwon2015). Currently, in addition to the classification of flares based on the intensity and emission area in the H line, the soft X-ray flare (SXR) classification is generally accepted and widely used. The C, M, and X SXR classes of flares are determined according to the peak fluxes measured by the Geostationary Operational Environmental Satellite (GOES; \openciteGarcia1994) 1–8 Å detectors in the ranges of (1–10) , , and W m-2, respectively.
Nitta2013a addressed the problem of classification of the STEREO backside flares calculating the EUVI 195 Å full-disk emission fluxes as a total output of the charge-coupled device (CCD) camera in units of digital data number (DN) per second. Using data from June 2010 to September 2012, the authors selected the flares that were recorded by GOES and simultaneously were observed with one or both STEREO spacecraft and found an empirical relation between the observed GOES 1–8 Å peak fluxes and the calculated EUVI 195 Å full-disk DN output. Using this relation, one can estimate the GOES peak X-ray flux of sufficiently intense backside flares observed only by STEREO. \inlineciteNitta2013a presented a list of 16 such major far-side flares detected with this procedure.
In the present paper, we propose a somewhat simpler technique for estimations of the X-ray class of STEREO flares. The technique is based on the measurements of the length of a bright artifact saturation streak, which appears in the EUVI 195 Å images nearly along its East–West axis around the peaks of sufficiently strong flares (Figure \irefF-different_flares). Such a streak is a consequence of the so-called blooming, i.e., saturation of CCD cells, corresponding to the brightest part of a flare source, and spilling of excessive electrons from these cells along CCD columns (see \openciteWuelser2004). Similar overexposure effects occur also in the Extreme ultraviolet Imaging Telescope (EIT; \openciteDelab1995) images gathered with SOHO (e.g., \openciteAndrews2001) and in the Atmospheric Imaging Assembly (AIA; \openciteLemen2012) images obtained with SDO Schwartz, Torre, and Piana (2014).
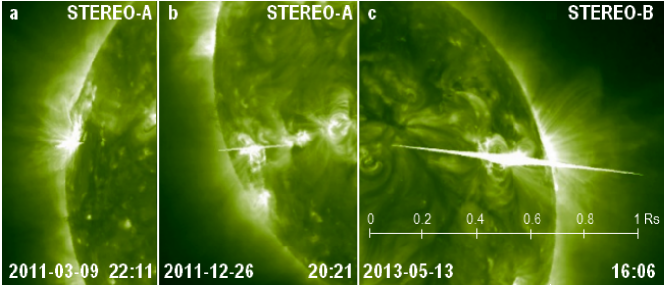
Henceforth we will refer to the blooming streaks as B-streaks. The B-streaks affect the images of flare cores around the peak time. These sources and moments are most interesting physically. The B-streaks are considered usually as a serious interference for the image processing and studies. Our analysis shows however that B-streaks contain useful information about the flare importance and the brightest EUV sources in general. This idea is based on the fact that the larger emission flux produces the stronger blooming in CCD cells, and therefore a longer B-streak is formed (see Figure \irefF-different_flares). In the next section \irefS-Approach, we describe our approach and data selected for the analysis. Section \irefS-Relations is devoted to strong flares observed with both GOES and one or two STEREO spacecraft. These concurrent observations allowed us to obtain an empirical relation between the relative lengths of B-streaks and the SXR fluxes (i.e., the GOES classes) of the STEREO flares. In Section \irefS-Strong_Flares, we present illustrations and a list of major backside flares (mainly above the M3.0 class), registered by STEREO spacecraft in 2007–2014. We also compare the SXR classes of far-side flares evaluated by \inlineciteNitta2013a, using the calculated DN fluxes in the EUVI 195 Å channel, and those estimated with our technique. The paper ends in Section \irefS-Summary with a summary and concluding remarks.
2 Approach and Data
S-Approach
In order to judge to what extent B-streaks are suitable for an assessment of the SXR class of backside flares, it is necessary to analyze the relationship between these parameters for coincident flares observed simultaneously with GOES and one or both STEREO spacecraft. Proceeding from the STEREO trajectories, it is clear that initially the number of such coincident flares was large, but then gradually decreased. After February 2011, when the two STEREO spacecraft were in the near-quadrature configuration relative to the Sun–Earth line, only those flares were observed both with GOES and one of the STEREO probes that were sufficiently removed from the central meridian visible from Earth. In 2013 and 2014, only near-the-limb flares, from the Earth view, could be observed with GOES and one of the STEREO spacecraft; the west- and east-limb GOES flares were observed with A and B stations, respectively.
We have analyzed the NOAA GOES flare list up to July 2014, i.e., during the ascent and maximum phases of Solar Cycle 24, (ftp://ftp.ngdc.noaa.gov/STP/space-weather/solar-data/solar-features/solar-flares/x-rays/goes/) and selected for further analysis practically all coincident flares above the M1.0 class. The exceptions were a small number of flares overlapping in time, but occurring in different active regions; flares with obvious partial limb occultation for either STEREO or GOES; and some M1–M2 flares, in which a relatively short B-steak was not discernible against extended pre-existing structures. In addition to strong flares, a certain amount of C-class flares with a visible B-streak was randomly chosen to be included in our analysis. We considered these events to reveal more clearly the tendency of the increasing length of the EUV B-streak with an increasing SXR flare importance.
For the considerations of B-streaks we used EUVI images in the 195 Å channel, which encompasses the Fe xii line with a peak temperature of MK, because these images were produced mostly every 5 min (sometimes the cadence was 2.5 or 10 min). More importantly, this channel has some sensitivity to the emission of high-temperature plasma due to the secondary peak around 15 MK in the Fe xxiv line at 192 Å that makes the 195 Å channel the closest analog of the SXR GOES monitors (see \openciteNitta2013a). As the main quantitative parameter characterizing B-streaks, we took its maximum length, , measured in fractions of the solar radius, , in the same EUVI image, i.e., the ratio. As will be shown later, the length of a B-streak can considerably exceed in major flares.
We endeavored to develop a method, which would be as simple as possible. For this reason, we did not analyze the source FITS files, and used instead the EUVI 195 Å images in JPEG and movies in MPEG, which are available at http://stereo-ssc.nascom.nasa.gov/browse/. They are already processed with the standard SolarSoft routine secchi_prep.pro, and rotated so that solar north is up. In spite of their non-linear brightness scale, most B-streaks are clearly discernible in the movies. We also use the images to measure the B-streak length, especially for weak flares. The observed B-streak length is expected to depend on the exposure time, . For each image, information on can be found at http://sharpp.nrl.navy.mil/cgi-bin/swdbi/secchi˙flight/img˙short/form, using the full-page output. It turned out that more often the EUVI telescopes operated with s. The 16 s exposure time was almost regularly used in early observations until January 2010. Later on, s had only the images recorded every even hour at the 16th minute, i.e., at 00:16, 02:16, 04:16, and so on (all times hereafter refer to UT). We corrected all the considered images to s. Namely, if the longest B-streak occurred in an image with s, we halved its length and compared it with B-streaks in adjacent images. We then excluded flares (mainly of C-class) in which after such a correction the maximum relative length of B-streaks, , was less than 0.1. The reason is that short B-streaks in such events could become visible against the background of other flare structures just because s.
| GOES SXR | STEREO | ||||||||
|---|---|---|---|---|---|---|---|---|---|
| No. | Date | Time | Class | Flux | Location | AR | A/B | Time | |
| UT | UT | ||||||||
| (1) | (2) | (3) | (4) | (5) | (6) | (7) | (8) | (9) | (10) |
| 17 | 2010-02-06 | 18:59 | M2.9 | 29 | N21 E17 | 11045 | A | 19:03 | 0.34 |
| 27 | 2010-02-12 | 11:26 | M8.3 | 83 | N26 E11 | 11046 | B | 11:26 | 0.54 |
| 77∗ | 2011-03-09 | 22:12 | C9.4 | 9.4 | N08 W04 | 11166 | A | 22:11 | 0.11 |
| 78 | 2011-03-09 | 23:23 | X1.5 | 150 | N08 W09 | 11166 | A | 23:26 | 0.27 |
| 99 | 2011-07-30 | 02:09 | M9.3 | 93 | N16 E19 | 11261 | B | 02:11 | 0.60 |
| 107 | 2011-08-09 | 08:05 | X6.9 | 690 | N17 W69 | 11263 | A | 08:06 | 1.59 |
| 112 | 2011-09-06 | 22:18 | X2.1 | 210 | N14 W18 | 11283 | A | 22:21 | 0.61 |
| 113 | 2011-09-07 | 22:38 | X1.8 | 180 | N14 W28 | 11283 | A | 22:41 | 0.61 |
| 121 | 2011-09-22 | 11:01 | X1.4 | 140 | N13 E78 | 11302 | B | 10:56 | 0.19 |
| 123 | 2011-09-24 | 09:40 | X1.9 | 190 | N12 E60 | 11302 | B | 09:41 | 0.77 |
| 142 | 2011-11-03 | 20:27 | X1.9 | 190 | N22 E63 | 11339 | B | 20:26 | 0.53 |
| 157 | 2011-12-26 | 20:30 | M2.3 | 23 | S21 W42 | 11387 | A | 20:21 | 0.26 |
| 171 | 2012-01-27 | 18:37 | X1.7 | 170 | N27 W71 | 11402 | A | 18:51 | 0.40 |
| 177∗ | 2012-03-05 | 04:09 | X1.1 | 110 | N16 E54 | 11429 | B | 04:16 | 0.25 |
| 189∗ | 2012-03-07 | 00:24 | X5.4 | 540 | N17 E27 | 11429 | B | 00:26 | 0.66 |
| 233 | 2012-07-06 | 23:08 | X1.1 | 110 | S18 W52 | 11515 | A | 23:11 | 0.42 |
| 275 | 2012-10-23 | 03:17 | X1.8 | 180 | S13 E52 | 11598 | B | 03:21 | 0.47 |
| 294∗ | 2013-05-13 | 02:17 | X1.7 | 170 | N12 E78 | 11748 | B | 02:16 | 0.42 |
| 295∗ | 2013-05-13 | 16:01 | X2.8 | 280 | N11 E85 | 11748 | B | 16:06 | 0.95 |
| 296 | 2013-05-14 | 01:11 | X3.2 | 320 | N13 E81 | 11748 | B | 01:11 | 0.77 |
| 297 | 2013-05-15 | 01:48 | X1.2 | 120 | N12 E64 | 11748 | B | 01:46 | 0.37 |
| 307 | 2013-10-25 | 08:01 | X1.7 | 170 | S04 E72 | 11882 | B | 08:03 | 0.38 |
| 308 | 2013-10-25 | 15:03 | X2.1 | 210 | S03 E68 | 11882 | B | 15:01 | 0.64 |
| 315∗ | 2013-10-28 | 02:03 | X1.0 | 100 | N04 W66 | 11875 | A | 02:06 | 0.24 |
| 319 | 2013-10-29 | 21:54 | X2.3 | 230 | N08 W86 | 11875 | A | 21:56 | 0.58 |
| 321 | 2013-11-19 | 10:26 | X1.0 | 100 | S13 W79 | 11893 | A | 10:26 | 0.38 |
| 337 | 2014-02-25 | 00:49 | X4.9 | 490 | S12 E82 | 11990 | B | 00:51 | 0.56 |
| 346 | 2014-04-25 | 00:27 | X1.3 | 130 | S15 W90 | 12046 | A | 00:26 | 0.59 |
| 347 | 2014-06-10 | 11:42 | X2.2 | 220 | S15 E80 | 12087 | B | 11:41 | 0.27 |
| 348 | 2014-06-10 | 12:52 | X1.5 | 150 | S17 E82 | 12087 | B | 12:56 | 0.23 |
The list of events selected for our analysis contains about 275 flares, whose GOES importance was M1 or higher, and 75 C-class flares. The complete list of flares observed with both GOES and STEREO/EUVI is accessible at http://www.izmiran.ru/~ichertok/STEREO/. Table \irefT-GOES_STEREO presents some flares extracted from this list and contains, in particular, those events that will be mentioned below, as well as a number of major flares. Column 1 presents the serial number of a flare in the complete list. Columns 2–7 contain information on GOES SXR observations of a flare in 1–8 Å, including date; peak time; COES class; corresponding SXR flux, , in units of W m-2; coordinates; and the NOAA number of an active region. Columns 8–10 specify STEREO A or B spacecraft; the observation time of the B-streak (rounded to 1 min); and its maximum relative length, .
3 Relation between the GOES Flux and EUVI B-streak
S-Relations
In the preceding section, was mentioned how to correct for the EUVI exposure time. Some other factors can affect the relations between the lengths of the EUVI B-streaks and the GOES SXR fluxes. These are:
– Different temperature responses of the SXR GOES detectors and the EUVI 195 Å channel, as mentioned in section \irefS-Approach.
– Possible time difference between the flare peak in SXR and EUV emissions.
– Limited imaging rate of the EUVI (section \irefS-Approach) and possible related omissions of flare peaks.
– Significant differences between impulsive (compact) flares and long-duration events (LDEs, which are usually associated with big CMEs; see below).
– A difference (though small) between the distances of the STEREO-A and B spacecraft from the Sun.
– Particularities of the B-streak formation in the blooming process.
– We measure the longest B-streak only, although several B-streaks occur in some flares (mainly LDEs; see below).
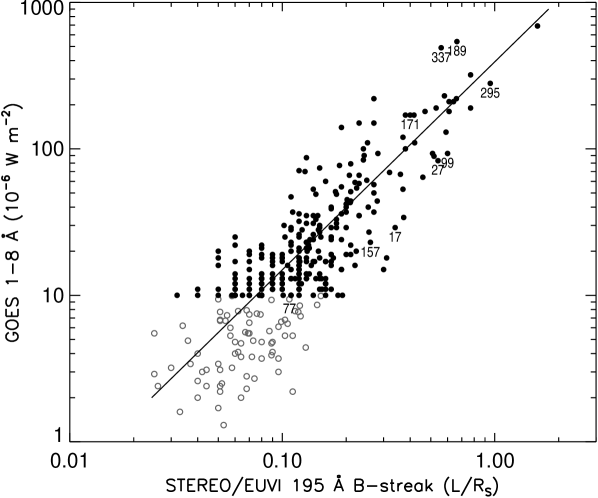
We disregard these factors for simplicity of the method. Nevertheless, as Figure \irefF-scatter_plot shows, a clear relationship does indeed exist between the maximum relative length of the B-streak, , and the peak GOES 1–8 Å flux, . On average, when increases from 0.03 to 1.5, rises from 3 to 600 (hereafter is expressed in the unit of W m-2) that corresponds to the SXR flare class from C3 to X6. The C-class flares confirm the trend which M- and X-class flares show. We remind that only a limited number of C flares is presented here which were selected randomly and had a conspicuous B-streak. The visibility of short B-streaks is obviously hampered, because pre-flare and flaring structures have some longitudinal extent, too. Therefore, the points of C-class flares in Figure \irefF-scatter_plot are biased to relatively longer B-streaks due to their visual selection and the limited number of events. Further we consider only the most powerful flares above the M1.0 level. Because we do not control any of the variables in the relationship, the geometric mean regression method was chosen to obtain an empirical dependence between these quantities. Using this method, we obtained a power-law regression equation to fit the relation between the length of the B-streak and the SXR flux,
| (1) |
(the line in Figure \irefF-scatter_plot). The correlation coefficient between and is . For the majority of the M1.0 flares, deviations of the SXR flux from the regression line down or up do not exceed a factor of 2. Equation (\irefE-regression) can be used for estimations of the SXR fluxes and GOES classes of far-side flares observed by STEREO but invisible from Earth. We will return to this issue in section \irefS-Strong_Flares.
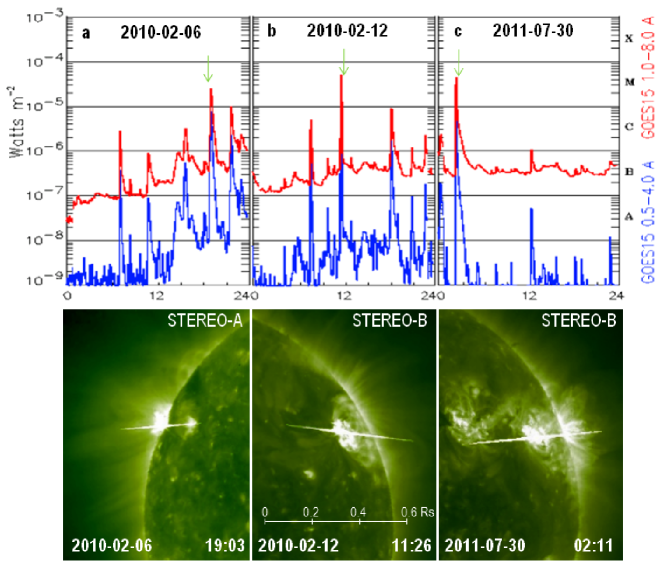
Our analysis shows that many impulsive and LDE flares are characterized by different B-streaks. As Figure \irefF-imp_flares demonstrates, in the standard 3-day GOES plots, impulsive flares look like spikes almost without any distinct decay phase. In such flares, the whole duration and decay times measured when the flux level decays to a point halfway between the maximum flux and the pre-flare background level, are 10–20 min and 3–10 min, respectively. Such a B-streak is visible usually only in 2–3 EUVI frames of the 5-min cadence. Figure \irefF-imp_flares illustrates that impulsive flares produce a single, thin and relatively long B-streak (see Figure \irefF-scatter_plot and Table \irefT-GOES_STEREO). This is due to the fact that almost the entire flux from such flares is emitted by a single compact core corresponding to a few pixels. Accordingly, such events reside under the regression line in Figure \irefF-scatter_plot.
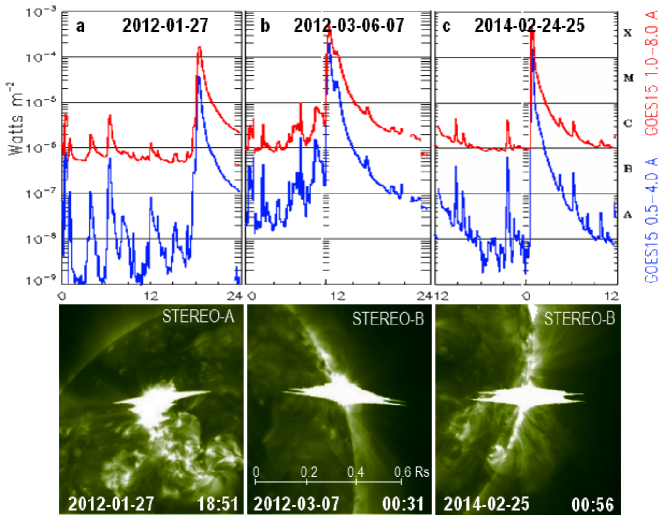
In contrast, LDE flares produce relatively short, but thick B-streaks with two or more blooming elements (Figure \irefF-LDE_flares). Apparently, a number of bright source kernels corresponding to these blooming elements contribute to their peak fluxes. In its most developed form, such a multi-element blooming structure does not always temporally coincide to the appearance of the longest B-streak. In the event shown in Figure \irefF-LDE_flaresa, several short blooming elements almost merged into one thick B-streak, while in the flares presented in Figures \irefF-LDE_flaresb and \irefF-LDE_flaresc, the thick part of the B-streak and diffuse core are contained between two thin blooming elements. The LDE flares have noticeably longer durations of 35–75 min and decay times of 15–45 min; their multi-element B-streaks are visible in larger numbers of EUVI images (up to 10). Let us remind that in such events we take into account only one, the longest B-streak. Feasible summation of the lengths of all visible B-streaks is not always unambiguous, and would complicate the method proposed. The fact that we consider only one streak can be the reason why the mentioned LDE events are located above the regression line in Figure \irefF-scatter_plot.
Based on the fact that the longest B-streaks indicate the brightest flare sources, it is interesting to consider the time difference, , between the observation of such a B-streak in a STEREO/EUVI image, , and a flare peak in the soft X-ray GOES data, . The corresponding histogram for M1.0 flares is presented in Figure \irefDelay. The time difference does not exceed min in the majority of events, being mainly due to the limited imaging rate of EUVI. Practically in all flares with , the longest B-streak was observed near the GOES SXR peak. Obviously, should be small in short-duration flares. Pre-flare heating of brightened erupting filaments or their static extensions produce earlier B-streaks ().
On the other hand, there is a noticeable percentage of LDEs, in which the longest EUV B-streaks were observed with a considerable delay after the SXR peak. Delayed B-streaks with min occurred a few times more often than advancing B-streaks with min. Such multiple, relatively short B-streaks in LDEs are produced by many loops of large long-lived arcades. The situation in LDEs is more complex than in impulsive events. Some delayed B-streaks can probably be caused by local brightenings due to the overlap of slowly moving flare loops. Some other delayed B-streaks can be due to subsidiary flare episodes on the background of the long-lasting post-eruption energy release late in such events, almost all of which are associated with big CMEs.

4 Powerful Far-Side Flares
S-Strong_Flares
In this section, we present powerful far-side flares which were not visible from Earth but were found due to B-streaks through a visual inspection of daily STEREO/EUVI movies and images of 2007–2014. Almost no such far-side flares were found in 2007–2009 for two reasons. Firstly, major flares occurred rarely during this period of low activity. Secondly, two parts of the solar surface invisible from Earth but observed with STEREO spacecraft were still small. The longitudinal extent of these parts gradually increased, and early in 2011 the whole far-side of the Sun became accessible to STEREO observations. In 2014, both STEREO probes were located almost exactly behind the Sun, and almost all far-side flares were observed by the two spacecraft simultaneously.
| Estimated SXR | ||||||||
|---|---|---|---|---|---|---|---|---|
| Date | Time | A/B | Location | AR | Flux | Class | Nitta et al. | |
| UT | class range | |||||||
| (1) | (2) | (3) | (4) | (5) | (6) | (7) | (8) | (9) |
| 2010-01-17 | 03:56 | B | S25 E128 | 11041 | 0.54 | 163 | X1.6 | M3.4–M9.6 |
| 2010-01-19 | 13:41 | B | S25 E95 | 11041 | 0.33 | 81.2 | M8.1 | – |
| 2010-01-19 | 20:36 | B | S25 E92 | 11041 | 0.37 | 95.6 | M9.6 | – |
| 2010-07-29 | 08:31 | A | N29 W136 | – | 0.23 | 48.6 | M4.9 | – |
| 2010-08-31 | 20:56 | A | S22 W146 | 11100 | 0.49 | 142.4 | X1.4 | M8.4–X2.5 |
| 2010-09-01 | 21:51 | A | S22 W162 | 11100 | 0.42 | 114.4 | X1.1 | M5.4–X1.6 |
| 2010-11-03 | 12:16 | B | S19 E98 | 11121 | 0.26∗ | 57.8 | M5.8 | – |
| 2011-03-21 | 02:16 | A | N17 W129 | 11169 | 0.05∗ | 5.6 | C5.6 | M1.3–X1.3 |
| 2011-06-03 | 21:06 | A | N15 W143 | 11222 | 0.24 | 51.7 | M5.2 | – |
| 2011-06-04 | 07:06 | A | N15 W144 | 11222 | 0.32 | 77.7 | M7.8 | M5.2–X1.6 |
| 2011-06-04 | 21:51 | A | N17 W148 | 11222 | 1.20 | 508 | X5.1 | X4.0–X12 |
| 2011-08-31 | 20:06 | A | N23 W119 | 11278 | 0.30 | 70.9 | M7.1 | – |
| 2011-09-03 | 02:46 | A | N22 W148 | 11278 | 0.31 | 74.3 | M7.4 | – |
| 2011-10-18 | 23:46 | A | N15W 130 | – | 0.33 | 81.2 | M8.1 | – |
| 2011-10-19 | 06:21 | A | N14 W134 | – | 0.27∗ | 61.1 | M6.1 | – |
| 2011-10-20 | 03:21 | A | N18 W101 | 11318 | 0.20 | 39.9 | M4.0 | |
| 2011-10-23 | 23:16 | A | N19 W151 | 11318 | 0.32 | 77.7 | M7.8 | M5.3–X1.6 |
| 2011-10-26 | 22:57 | B | N18 E167 | 11339 | 0.42 | 114 | X1.1 | – |
| 2011-11-03 | 22:41 | B | N09 E154 | – | 0.09 | 12.8 | M1.3 | M4.7–X1.4 |
| 2012-03-26 | 22:56 | B | N18 E123 | 11451 | 0.49 | 142.4 | X1.4 | M8.2–X2.5 |
| 2012-04-26 | 15:51 | A | S23 W123 | 11462 | 0.26 | 57.8 | M5.8 | – |
| 2012-04-27 | 16:06 | A | S22 W136 | 11462 | 0.32 | 77.7 | M7.8 | – |
| 2012-04-29 | 12:46 | B | N12 E163 | 11467 | 0.77 | 270 | X2.7 | M8.3–X2.5 |
| 2012-06-12 | 05:06 | A | S15 W126 | 11495 | 0.22 | 45.7 | M4.6 | – |
| 2012-07-02 | 08:36 | B | S16 E133 | 11520 | 0.26 | 57.8 | M5.8 | – |
| 2012-07-15 | 15:51 | A | S20 W173 | 11515 | 0.22 | 45.7 | M4.6 | – |
| 2012-07-23 | 02:36 | A | S15 W133 | 11520 | 0.18 | 34.3 | M3.4 | M8.2–X2.5 |
| 2012-08-19 | 18:16 | A | S22 W178 | 11538 | 0.24∗ | 51.7 | M5.2 | – |
| 2012-08-21 | 20:16 | B | S22 E158 | 11538 | 0.28∗ | 64.3 | M6.4 | M6.8–X2.0 |
| 2012-09-11 | 07:56 | B | S22 E178 | 11576 | 0.90 | 338 | X3.4 | X1.3–X3.9 |
| 2012-09-12 | 22:56 | B | S21 E157 | 11576 | 0.30 | 70.9 | M7.1 | – |
| 2012-09-14 | 20:52 | B | N09 E140 | 11575 | 0.27 | 61.1 | M6.1 | – |
| 2012-09-15 | 11:26 | B | N09 E131 | 11575 | 0.24 | 51.7 | M5.2 | – |
| 2012-09-19 | 11:16 | A | S16 E169 | 11582 | 0.51 | 151 | X1.5 | M9.1–X2.7 |
| 2012-09-20 | 15:01 | B | S15 E156 | 11582 | 2.38 | 1343 | X13 | X5.8–X18 |
| 2012-09-22 | 03:06 | B | S16 E135 | 11582 | 0.38 | 99.2 | M9.9 | M8.4–X2.5 |
| 2012-09-27 | 10:36 | A | S24 W154 | 11574 | 0.30 | 70.9 | M7.1 | – |
| 2012-10-08 | 13:56 | B | S29 E107 | 11590 | 0.50 | 146 | X1.5 | – |
| 2012-10-19 | 17:31 | A | S21 W156 | 11582 | 0.21 | 42.7 | M4.3 | – |
| Estimated SXR | ||||||||
|---|---|---|---|---|---|---|---|---|
| Date | Time | A/B | Location | AR | Flux | Class | Nitta et al. | |
| UT | class range | |||||||
| (1) | (2) | (3) | (4) | (5) | (6) | (7) | (8) | (9) |
| 2013-04-24 | 21:46 | A | N09 W169 | 11719 | 0.23 | 48.6 | M4.9 | – |
| 2013-05-01 | 02:31 | B | N15 E115 | 11739 | 0.32 | 77.7 | M7.8 | – |
| 2013-10-05 | 06:56 | B | S23 E125 | 11865 | 0.23 | 48.6 | M4.9 | – |
| 2013-10-31 | 20:25 | A | N12 W139 | 11880 | 0.51 | 151 | X1.5 | – |
| 2013-11-02 | 04:26 | A | N03 W139 | 11875 | 0.83 | 301 | X3.0 | – |
| 2013-11-04 | 05:21 | A | N01 W165 | 11875 | 0.21 | 42.7 | M4.3 | – |
| 2013-11-21 | 00:56 | A | S23 W123 | 11901 | 0.42 | 114 | X1.1 | – |
| 2013-11-21 | 16:26 | A | S22 W132 | 11901 | 0.25 | 54.7 | M5.5 | – |
| 2014-01-06 | 07:56 | A | S15 W113 | 11936 | 0.67 | 222 | X2.2 | – |
| 2014-01-26 | 08:37 | B | S16 E107 | 11967 | 0.42 | 114 | X1.1 | – |
| 2014-01-31 | 15:07 | B | S14 E155 | 11974 | 0.30 | 70.9 | M7.1 | – |
| 2014-02-10 | 18:16 | A | N13 W161 | – | 0.34∗ | 84.7 | M8.5 | – |
| 2014-02-11 | 13:26 | A | N09 W112 | 11968 | 0.46 | 130 | X1.3 | – |
| 2014-02-14 | 01:36 | A | N08 W137 | 11968 | 0.28 | 64.3 | M6.4 | – |
| 2014-02-14 | 08:26 | A | S13 W143 | 11967 | 0.39 | 103 | X1.0 | – |
| 2014-02-20 | 03:16 | A | S17 E142 | 11990 | 0.25 | 54.7 | M5.5 | – |
| 2014-03-04 | 18:26 | A | N13 W171 | – | 0.74 | 256 | X2.6 | – |
| 2014-03-05 | 13:26 | A | N13 W179 | – | 1.43 | 651 | X6.5 | – |
| 2014-03-06 | 12:21 | A | N12 E166 | 12007 | 0.34∗ | 84.7 | M8.5 | – |
| 2014-03-09 | 02:51 | A | N17 W159 | 11986 | 0.23 | 48.6 | M4.9 | – |
| 2014-05-01 | 09:31 | A | N03 E148 | 12056 | 0.78 | 275 | X2.8 | – |
| 2014-05-09 | 02:31 | A | S11 W119 | 12051 | 0.35 | 88.3 | M8.8 | – |
| 2014-06-16 | 02:16 | A | S13 W103 | 12080 | 0.20∗ | 39.9 | M4.0 | – |
| 2014-06-17 | 09:01 | A | S13 W123 | 12080 | 0.28 | 64.3 | M6.4 | – |
| 2014-06-30 | 17:01 | B | S21 E125 | – | 0.26 | 57.8 | M5.8 | – |
| 2014-09-01 | 11:01 | B | N14 E129 | 12158 | 0.39 | 103 | X1.0 | – |
| 2014-09-01 | 22:21 | B | S14 E121 | 12157 | 0.22 | 45.7 | M4.6 | – |
The SXR fluxes (GOES classes) of such backside flares were estimated from the relative lengths of the longest B-streaks using equation (\irefE-regression). We restricted ourselves to flares with , which corresponds to the GOES class of M4.0. The results are presented in Table \irefT-strong_flares, where for each of the detected events the following information is listed: the date (column 1); time of the longest B-streak (2); the STEREO A or B probe, in whose images the streak was measured (3); approximate coordinates of the flare (4); the NOAA number of active region (5) assigned before its disappearance behind the west limb (mainly for A-probe) or after its appearance at the east limb (mainly for B-probe); the value of the parameter (6); the estimated peak SXR flux in units of W m-2 (7), and the flare GOES class (8). In accordance with the small statistical errors of the parameters found in evaluating equation (\irefE-regression), the 95% confidence interval of the estimated flare class is rather narrow for short B-streaks and broadens gradually with an increase of . For example, the confidence interval is M2.6–M4.7 for an M3.5 flare and X10–X18 for an X13 flare.
Column 9 of Table \irefT-strong_flares presents probable ranges of the GOES classes for major far-side flares of 2010–2012 estimated by \inlineciteNitta2013a from the calculated total DN output. We included all of the 16 backside flares listed by the authors, although three of these flares had . In two of these events (2011-03-21, 02:11 and 2011-11-03, 22:41), the longest B-streaks were even shorter, , but their blooming consisted of many elements, that is typical for LDE flares associated with large CMEs. The third flare of 2012-07-23, 02:36 with is particularly noteworthy and will be discussed below. As Table \irefT-strong_flares shows, our analysis of EUVI B-streaks revealed 63 far-side flares above the M4.0 level, including 22 X-class flares, in addition to 94 and 28 flares of the same classes registered by GOES during the ascending and maximum phases of the current solar cycle (until September 2014). Table \irefT-strong_flares demonstrates that our estimations of the GOES classes for 13 other major backside flares listed by \inlineciteNitta2013a are close to their results as well. In the majority of cases, our estimated GOES importance falls within the range specified by these authors.
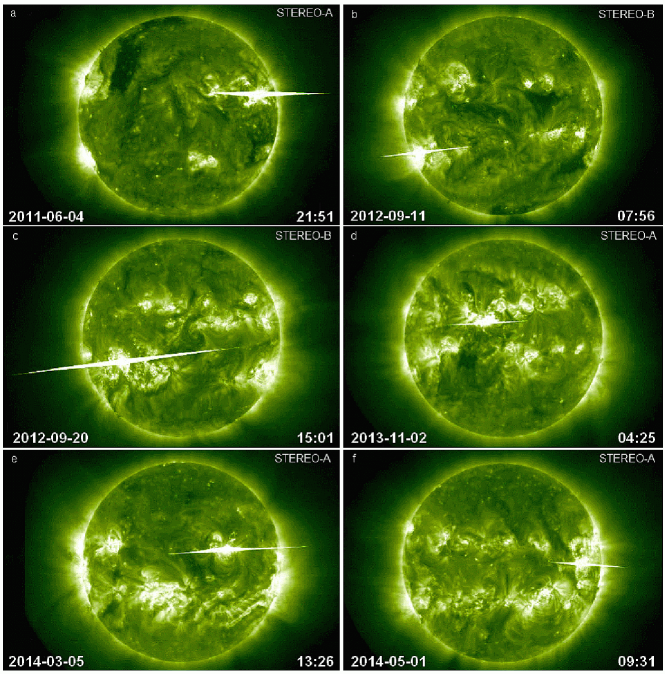
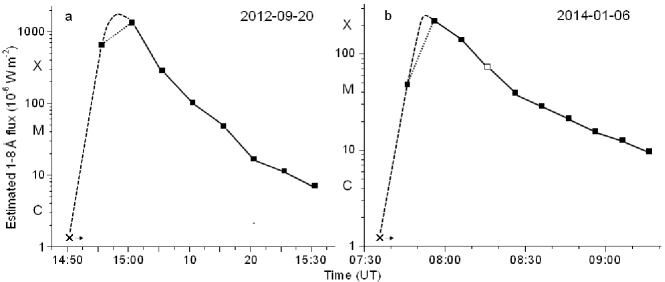
Figure \irefF-major_flares illustrates B-streaks in six of the strongest backside flares observed by STEREO/EUVI. Shown in Figure \irefF-major_flaresc is the 2012-09-20 flare with the longest B-streak exceeding the solar diameter; in this case that corresponds to the estimated SXR class of X13. This event turned out to be not only the most powerful far-side flare but the strongest flare of the Solar Cycle 24 until the present time. This conclusion and evaluation of the flare class are consistent with the results of \inlineciteNitta2013a obtained through the calculations of the full-disk EUVI total DN output. With an example of this event, we can demonstrate that B-streaks allow not only to estimate the SXR importance of large LDE flares but also to reconstruct their probable time history. For this purpose, it is sufficient to have visible B-streaks in several images, to measure their largest relative length, and to calculate the SXR flux using equation (\irefE-regression). As Figure \irefF-time_profilesa shows, the B-streaks in the 2012-09-20 event are clearly visible, at least, in eight frames of the 5-min cadence. At the growth phase, a long B-streak appears very sharply. The shape of the time profile indicates that the maximum flux occurred between two frames of 14:56 and 15:01. This suggests that the SXR class of this flare was still higher than the longest B-streak implies and seems to be about X20.
Two other far-side events induced interest as sources of outstanding space weather disturbances. The 2012-07-23 flare mentioned above is widely debated and considered as an utmost extreme eruptive event (e.g., \openciteNgwira2013; \openciteLiu2014; \openciteTemmer2015). The corresponding interplanetary CME (ICME) arrived at STEREO-A, which was located favorably, in a very short transit time of 19–21 hr and brought to 1 AU a record strong interplanetary magnetic field of 109 nT. If directed toward Earth, this ICME might cause a geomagnetic storm comparable to the famous Carrington storm of 1859. Meanwhile, the corresponding flare was fairly moderate; \inlineciteNitta2013a estimated its soft X-class to be in the M8.2–X2.5 range, and our estimation from the observed B-streak length leads to even lower values of about M5.4. The researchers of this event suggested that the extreme characteristics of the event were caused by a high initial CME speed (up to 3000 km s-1), week ICME drag deceleration in the solar wind determined by preceding solar eruptions, and by an enhancement of the magnetic field due to an interaction between two CMEs, which closely followed each other. Currently we are working on an alternative interpretation suggesting that the extremely high speed of CME/ICME and its strong interplanetary magnetic field were due to a large eruptive magnetic flux and a weak ICME expansion in propagation from the Sun to 1 AU, in accordance with patterns described by \inlineciteChertok2013 and \inlineciteGrechnev2014. The magnetic flux was estimated from the SDO/HMI magnetogram on 2012-07-12, when the parent active region was located near the center of the visible disk.
The 2014-01-06, 07:56 flare occurred at a heliolongitude of W113 and produced a 2.5% ground-level enhancement (GLE) of cosmic rays, only the second one in the unusual Solar Cycle 24. \inlineciteThakur2014 analyzed this proton event and kinematics of an accompanying CME and came to a conclusion that it was consistent with a particle acceleration by a CME-driven shock. On the other hand, a sufficiently long () multi-element B-streak existed in STEREO-A images for nearly one hour during this flare. A probable time history presented in Figure \irefF-time_profilesb demonstrates that the flare was a powerful LDE of X2 class. According to \inlineciteBelov2007, an X2 class flare can well be associated with a source of SEP with proton fluxes of J( MeV) pfu, J( MeV) pfu, and GLE of that are close to the observations. These parameters estimated from B-streaks are typical of flares related to small GLEs.
5 Summary and Concluding Remarks
S-Summary
We have demonstrated how a spurious instrumental effect, which strongly interferes solar flare imaging, can be used to obtain a useful information. Here we were dealing with the so-called blooming, arising from a significant saturation of the STEREO/EUVI 195 Å images in CCD cells corresponding to the cores of sufficiently strong flares. The saturated CCD cells lose their ability to accommodate any additional charge, causing them to spill over adjacent cells. As a result, one or several bright nearly horizontal streaks (B-streaks) are formed. We have shown that in spite of many unaccounted factors, the maximum relative length of the EUV B-streak, , correlates with the peak flare SXR flux, , measured by GOES. We have analyzed about 350 flares of 2007–2014 which were observed simultaneously by GOES and one of STEREO spacecraft, and found an empirical relation between and . This allowed us to propose a simple and prompt method for estimating the SXR class of far-side flares observed with STEREO but invisible for GOES.
The method consists of a direct measurement of the length of the longest B-streak in units of the solar radius in the routine EUVI 195 Å images or movies, accessible in near real time at http://stereo-ssc.nascom.nasa.gov/browse/, and the use of equation (\irefE-regression). It is necessary only to make sure that all the measurements were converted to the exposure time of 8 s. Prior to this, \inlineciteNitta2013a proposed a somewhat more laborious method for estimations of the SXR flux and class of far-side flares based on calculations of the EUVI full-disk total digital number output. It should be noted that if there is a temporal overlap between the flares in different active regions, then our method makes it possible to measure their B-streaks and to estimate their classes independent of each other.
Applying our method to the STEREO observations during the ascending and maximum phases of Solar Cycle 24 allowed us to find about 65 major backside flares with the EUVI B-streak lengths of and to estimate their SXR fluxes and classes. For the majority of 16 backside flares listed by \inlineciteNitta2013a for 2010–2012, our estimations are close to their results. Among these events, the 2012-09-20 flare turned out to be the strongest one in the current solar cycle. Its probable importance of about X13 was estimated from . We also briefly discussed two far-side events of interest for space weather. The 2012-07-23 eruption occurred in an active region with a large magnetic flux and under favorable location relative to the Earth could be a source of an extremely strong and prompt geomagnetic storm. Judging from the B-streak, the west behind-the-limb flare of 2014-01-06 was sufficiently intense and long-lasting to be connected with a source of the observed proton event including GLE.
Using the two LDE events as examples, we have demonstrated that by measuring the maximum B-streak length in a number of consecutive images one can reconstruct a probable time history of a flare. It is clear that these and other features found due to B-streaks require further detailed study. Hopefully, the proposed simple method of prompt estimations of the SXR class of the far-side STEREO flares from artifact B-streaks would be useful for solar studies and solar-terrestrial forecasting.
Acknowledgements
We are grateful to an anonymous reviewer for constructive comments, which helped us to improve the manuscript. The authors thank the GOES and STEREO teams for their open data used in our study. This research was supported by the Russian Foundation of Basic Research under grant 14-02-00367 and the Ministry of education and science of Russian Federation under projects 8407 and 14.518.11.7047.
References
- Andrews (2001) Andrews, M.D.: 2001, Sol. Phys. 204, 181. DOI: 10.1023/A:1014215923912
- Aschwanden et al. (2014) Aschwanden, M.J., Wülser, J.-P., Nitta, N.V., Lemen, J.R., Freeland, S., Thompson, W.T.: 2014, Sol. Phys. 289, 919. DOI: 10.1007/s11207-013-0388-3
- Belov et al. (2007) Belov, A., Kurt, V., Mavromichalaki, H., Gerontidou, M.: 2007, Sol. Phys. 246, 457. DOI: 10.1007/s11207-007-9071-x
- Chertok et al. (2013) Chertok, I.M., Grechnev, V.V., Belov, A.V., Abunin, A.A.: 2013, Sol. Phys. 282, 175. DOI: 10.1007/s11207-012-0127-1
- Delaboudinière et al. (1995) Delaboudinière, J.-P., Artzner, G.E., Brunaud, J., Gabriel, A.H., Hochedez, J.F., Millier, F., Song, X.Y., Au, B., Dere, K.P., Howard, R.A., et al.: 1995, Sol. Phys. 162, 291. DOI: 10.1007/BF00733432
- Garcia (1994) Garcia, H.A.: 1994, Sol. Phys. 154, 275. DOI: 10.1007/BF00681100
- Grechnev et al. (2014) Grechnev, V.V., Uralov, A.M., Chertok, I.M., Belov, A.V., Filippov, B.P., Slemzin, V.A., Jackson, B.V.: 2014, Sol. Phys. 289, 4653. DOI: 10.1007/s11207-014-0596-5
- Howard et al. (2008) Howard, R.A., Moses, J.D., Vourlidas, A., Newmark, J.S., Socker, D.G., Plunkett, S.P.: 2008, Space Sci. Rev. 136, 67. DOI: 10.1007/s11214-008-9341-4
- Hudson (2011) Hudson, H.S.: 2011, Space Sci. Rev. 158, 5. DOI: 10.1007/s11214-010-9721-4
- Kaiser et al. (2008) Kaiser, M.L., Kucera, T.A., Davila, J.M., St. Cyr, O.C., Guhathakurta, M., Christian, E.: 2008, Space Sci. Rev. 136, 5. DOI: 10.1007/s11214-007-9277-0.
- Kwon, Zhang, and Vourlidas (2015) Kwon, R.-Y., Zhang, J., Vourlidas, A.: 2015, ApJ 799, L29. DOI: 10.1088/2041-8205/799/2/L29
- Lemen et al. (2012) Lemen, J.R., Title, A.M., Akin, D.J., Boerner, P.F., Chou, C., Drake, J.F., Duncan, D.W., Edwards, C.G., Friedlaender, F.M., Heyman, G.F., et al.: 2012, Sol. Phys. 275, 17. DOI: 10.1007/s11207-011-9776-8
- Li et al. (2014) Li, Y., Luhmann, J.G., Lynch, B.J., Kilpua, E.K.J.: 2014, J. Geophys. Res. 119, 3237. DOI: 10.1002/2013JA019538
- Liu et al. (2014) Liu, Y.D., Luhmann, J.G., Kajdič, P., Kilpua, E.K.J., Lugaz, N., Nitta, N.V., Möstl, C., Lavraud, B., Bale, S.D., Farrugia, C.J., Galvin, A.B.: 2014, Nature Commun. 5, 3481. DOI: 10.1038/ncomms4481
- Lugaz et al. (2012) Lugaz, N., Kintner, P., Möst, C., Jian, L.K., Davis, C.J., Farrugia, C.J.: Solar Physics, 2012, Sol. Phys. 279, 497. DOI: 10.1007/s11207-012-0007-8.
- Ngwira et al. (2013) Ngwira, C.M., Pulkkinen, A., Leila Mays, M., Kuznetsova, M.M., Galvin, A.B., Simunac, K., Baker, D.N., Li, X., Zheng, Y., Glocer, A.: 2013, Space Weather, 11, 671. DOI: 10.1002/2013SW000990
- Nitta et al. (2013a) Nitta, N.V., Aschwanden, M.J., Boerner, P.F., Freeland, S.L., Lemen, J.R., Wuelser, J.-P.: 2013a, Sol. Phys. 288, 241. DOI: 10.1007/s11207-013-0307-7
- Nitta et al. (2013b) Nitta, N.V., Schrijver, C.J., Title, A.M., Liu, W.: 2013b, ApJ 776, 58. DOI: 10.1088/0004-637X/776/1/58
- Richardson et al. (2014) Richardson, I.G., von Rosenvinge, T.T., Cane, H.V., Christian, E.R., Cohen, C.M.S., Labrador, A.W., Leske, R.A., Mewaldt, R.A., Wiedenbeck, M.E., Stone, E.C.: 2014, Sol. Phys. 289, 3059. DOI: 10.1007/s11207-014-0524-8
- Schwartz, Torre, and Piana (2014) Schwartz, R.A., Torre, G., Piana, M.: 2014, ApJ 793, L23. DOI: 10.1088/2041-8205/793/2/L23
- Temmer and Nitta (2015) Temmer, M., Nitta, N.: 2015, Sol. Phys. 290, 919. DOI: 10.1007/s11207-014-0642-3
- Thakur et al. (2014) Thakur, N., Gopalswamy, N., Xie, H., Mäkelä, P., Yashiro, S., Akiyama, S., Davila, J.M.: 2014, ApJ 790, L13. DOI: 10.1088/2041-8205/790/1/L13
- Webb and Howard (2012) Webb, D.F., Howard, T.A.: 2012, Living Rev. Sol. Phys. 9, 3. DOI: 10.12942/lrsp-2012-3
- Wuelser et al. (2004) Wuelser, J.-P., Lemen, J.R., Tarbell, T.D., Wolfson, C.J., Cannon, J.C., Carpenter, B.A., Duncan, D.W., Gradwohl, G.S., Meyer, S.B., Moore, A.S., et al.: 2004, In: Fineschi, S., Gummin, M.A. (eds.): Telescopes and Instrumentation for Solar Astrophysics, Proc. SPIE 5171, 111. DOI: 10.1117/12.506877.