Role of spin-orbit coupling and evolution of the electronic structure of WTe2 under an external magnetic field
Abstract
Here, we present a detailed study on the temperature and angular dependence of the Shubnikov-de-Haas (SdH) effect in the semi-metal WTe2. This compound was recently shown to display a very large non-saturating magnetoresistance which was attributed to nearly perfectly compensated densities of electrons and holes. We observe four fundamental SdH frequencies and attribute them to spin-orbit split, electron- and hole-like, Fermi surface (FS) cross-sectional areas. Their angular dependence is consistent with ellipsoidal FSs with volumes implying a modest excess in the density of electrons with respect to that of the holes. We show that density functional theory (DFT) calculations fail to correctly describe the FSs of WTe2. When their cross-sectional areas are adjusted to reflect the experimental data, the resulting volumes of the electron/hole FSs obtained from the DFT calculations would imply a pronounced imbalance between the densities of electrons and holes. We find evidence for field-dependent Fermi surface cross-sectional areas by fitting the oscillatory component superimposed onto the magnetoresistivity signal to several Lifshitz-Kosevich components. We also observe a pronounced field-induced renormalization of the effective masses. Taken together, our observations suggest that the electronic structure of WTe2 evolves with the magnetic field. This evolution might be a factor contributing to its pronounced magnetoresistivity.
I Introduction
Transition metal dichalcogenides TMX2 (where TM stands for a transition metal, and X for a chalcogen) have become the subject of intense research activity since, as graphene, they can be exfoliated down to a single atomic layer reviews . Semiconducting compounds present remarkable optoelectronic propertieskis while the whole family displays a wide range of electronic states reviews ; from wide gap semiconductors such as trigonal 1T-HfS2gaiser , to band gaps comparable to Si such as in -MoTe2heinz , or Mott systems such as 1T-TaS2forro . Some compounds display charge-density wave(s) that coexist with superconductivity as in H-NbSe2NbSe2 , while others are semi-metals such as -MoTe2 or WTe2cava .
WTe2, which crystallizes in a distorted, orthorhombic variant of the CdI2 structure with octahedral coordination around W, was recently reported to display an extremely pronounced and non-saturating magnetoresistance whichcava . Following simple arguments already discussed by Pippardpippard , this effect was attributed to a nearly perfect compensation between the density of electrons and holes. Evidence for electron/hole compensation was recently provided by angle-resolved photoemission (ARPES) experiments claiming to observe electron- and hole-like Fermi surface pockets of almost the same sizepletikosic . These results contrast markedly with a subsequent ARPES studyjiang which claim to observe up to 9 FS sheets, including a hole-pocket at the Brillouin zone center or the -point, and two hole-pockets and two electron-pockets on each side of and along the -X direction. The same study finds evidence for spin-orbit split bands and for an opposite texture between the spin and the angular orbital momentum around the -point which should suppress carrier backscatteringjiang . The application of a magnetic field would not only alter the spin texture, it would also displace, through the Zeeman effect, the spin-split bands relative to the Fermi level, opening backscattering channels and hence increasing the resistivity. Similar arguments were invoked to explain the pronounced magnetoresistivity observed in Cd3As2ong .
Electrical transport studies focused on the Shubnikov-de Haas-effect yielding results xiang_three_pockets ; behnia ; zhao ; cai which contrast markedly with both ARPES studies. The first study reports the observation of just 3 Fermi surface pockets in marked contrast with band structure calculations which always predict an even number of FS pockets for bulk WTe2pletikosic ; behnia ; Lv . Subsequent studies, more in line with the calculations, observe 4 Fermi surface pockets, or two sets of concentric electron- and hole-like FSsbehnia ; zhao ; cai at either side of the point. The angular dependence of the observed frequencies, or of the FS cross-sectional areas obtained from the Onsager relation, suggests ellipsoidal pockets with volumes yielding an excess of 4 % in the density of holes when compared that of the electrons. This imbalance would be comparable to that of elemental Bi which, in contrast to WTe2, displays a saturating magnetoresistancefauque .
Subsequent calculations bernevig confirm the previously reported FS geometry pletikosic ; behnia ; Lv , while analyzing the topological properties of its electronic structure around the Fermi level. Ref. bernevig, finds a linear touching between hole and electron Fermi-surfaces leading to Berry phase curvature singularities, or to two sets of four Weyl-points in the first Brillouin zone, each Weyl-point characterized by topological charges of . At the moment it remains unclear how such electronic structure would contribute to WTe2 pronounced magnetoresistivity. Ref. bernevig, also finds that its FS is particularly sensitive to the exact position of the Fermi level , with small displacements in leading to topological Lifshitz transitions, in agreement with our DFT calculations being discussed within this manuscript.
Here, we present angle- and temperature-dependent magnetoresistivity measurements in fields up to T on WTe2 single-crystals, in an attempt to elucidate the number of Fermi surface sheets. In parallel, we performed density-functional theory (DFT) calculations incorporating the spin-orbit effect. By adjusting the position of the chemical potential we attempted to precisely describe the geometry of the measured Fermi surfaces. In agreement with a previous reportbehnia we observe four fundamental Shubnikov-de-Haas frequencies, or Fermi surface cross-sectional areas, which we ascribe to spin-orbit split electron- and hole-pockets. As argued in Ref. behnia, , their angular dependence can be described in terms of ellipsoidal FSs. Therefore, we find that the DFT calculations are unable to correctly describe the angular dependence of the FS cross-sectional areas, particularly in what concerns the hole-pockets. For fields aligned along the and the axis we observe the effective masses to become renormalized, i.e. considerably heavier as the field increases. As the FFT spectrum of the oscillatory signal, taken on a limited field window, is unable to resolve all cross-sectional areas, we fit it to five and four Lifshitz-Kosevich components. Our fits clearly indicate that one cannot fit the SdH signal over the entire field range by maintaining the frequencies and the effective masses as constants. Good fits are obtained within a limited field range, confirming that the effective masses (and likely the cross-sectional areas) are field-dependent.
II Experimental
WTe2 was grown via a chemical vapor transport technique using chlorine as the transport agent: W (99.999 %) and Te (99.9999 %) were heated up to a peak temperature of 750 ∘C at a rate of 100 ∘C/h, and subsequently cooled down to room temperature at a rate of 10 ∘C/h. The obtained powder was ground with a mortar and pestle and heated again following the the same temperature profile. The remaining product was subsequently combined with TeCl4 (99.999 %, 1.5 mg/cm3) and heated up to a peak temperature of 750 ∘C at a rate of 100 ∘C/h under a temperature gradient of 50 ∘C. The crystals used for this study displayed resistivity ratios in excess of 102. Subsequent crystals grown via the Te flux method, yielded much higher RRRs () and show similar behavior (see supplementary information).
The synthesis procedure yielded platelet like single crystals, several millimeters in length and typically a millimeter wide, making the a-, b-, and the c-axis easily distinguishable. The stoichiometric composition was determined by energy dispersive X-ray spectroscopy and single-crystal X-ray refinement. A conventional four terminal configuration was used for the resistivity measurements which were performed under high magnetic-fields either by using a 35 T resistive magnet or a Physical Property Measurement System (PPMS).
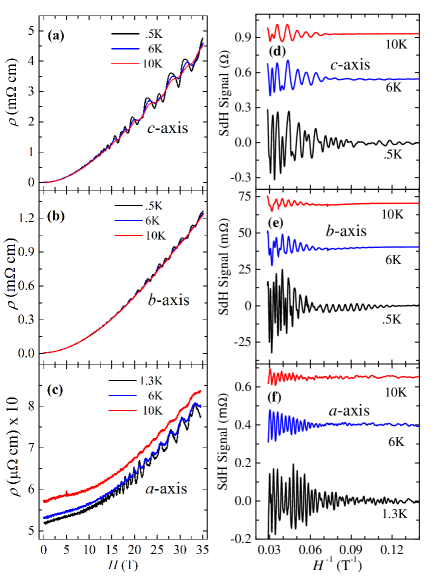
Figures 1 (a), (b), and (c) show the resistivity of a WTe2 single-crystal as a function of the magnetic field applied along the a, b, and c-axis respectively, for several temperatures and with the electrical current applied along the a-axis. In agreement with previous reportscava ; behnia , fields along the c-axis yield the largest magnetoresistivity, although in our crystals the anisotropy in magnetoresistivity between fields along the c- and the b-axis is just a factor of 4 and not beyond one order of magnitudebehnia . The smallest change in resistivity is observed for fields applied along the a-axis, since in this configuration the Lorentz force is expected to vanish. For all three sets of data the oscillatory component superimposed onto the smoothly increasing background corresponds to the Shubnikov-de-Haas effect. Figures 1 (d), (e), (f), display the oscillatory component superimposed onto as a function of the inverse field , for fields oriented along all three crystallographic axes and for several temperatures (from the curves in (a), (b) and (c), respectively). To obtain the oscillatory component, the smoothly varying background was fit to a polynomial which was subsequently subtracted from the raw data.
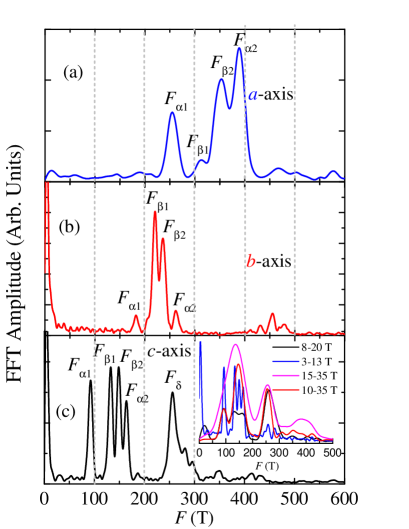
Figures 2 (a), (b), and (c) show the fast Fourier transform (FFT) of the SdH oscillatory signal displayed in Figs. 1 (d), (e), and (f), respectively. As seen, for fields along all three crystallographic axes four fundamental frequencies are clearly observed. This is in agreement with the observations of Ref. behnia, but contrasts markedly with both ARPES studies pletikosic, ; jiang, . For fields along the -axis one observes peak frequencies at F T, F T, F T, and F T, respectively. As we discuss below, and based on DFT calculations, the and the frequencies are identified with spin-orbit split hole- and electron-pockets, respectively. The indexes 1 and 2 distinguish the smaller from the larger spin-orbit split Fermi surfaces. The DFT calculations indicate the presence of identical sets of electron and hole pockets at either side of the point making it a total of 8 Fermi surface sheets in the first Brillouin zone. We see a gradual increase in the frequencies as the crystal is rotated from c- towards the b-axis or the a-axis. For fields along the b-axis the peaks are shifted towards F T, F T, F T, and F T, respectively. For fields along the a-axis the peaks are observed at F T, F T, F T, and F T, respectively. Ref. jiang, claims the existence of 9 Fermi surface pockets in contrast to the eight pockets implied by our experiments when combined with the calculations described below. Here, we just mention that another very small electron pocket do emerge at the point by shifting the Fermi level in the DFT calculations with respect to the position required to match our observations. Indeed this would lead to a total number of 9 Fermi surface sheets. Nevertheless, their cross-sectional areas would strongly disagree with our experimental observations. Furthermore, the different ARPES studies pletikosic ; jiang disagree among themselves on the existence of this extra pocket. As we show below, the DFT calculations indicate that the geometry of the Fermi surface(s) is extremely sensitive with respect to small displacements of the Fermi level, i.e. of the order of 20 meV, which is comparable to the experimental resolution of ARPES. The distinction among the ARPES results is attributable to the resolution between the different set-ups.
For fields along the c-axis one also observes a pronounced fifth peak, F T, which clearly corresponds to . This frequency was previously attributed to magnetic breakdown or to the magnetic field-induced carrier tunneling between both orbitsbehnia . However, the fact that the amplitude of the peak associated with Fδ is more pronounced than peaks associated with the fundamental orbits, such as , contradicts this scenario, unless both FS sheets were in close proximity at the point of nearly touching. In fact, as seen in the inset of Fig. 2 (c), which displays the FFT spectra acquired under distinct field intervals, this orbit becomes progressively more pronounced at higher fields, which is consistent with magnetic breakdown. However, as illustrated by the FFT spectrum extracted from the field interval ranging from 8 to 20 T, the amplitude of can, in some field intervals, become more pronounced than the amplitude of all other fundamental peaks. This suggests that the Zeeman-effect is altering the geometry of the -pockets, hence decreasing their (spin-orbit induced) splitting in some region(s) of k-space. Our DFT analysis, discussed below, is indeed consistent with this possibility. This would imply that the electronic structure at the Fermi level evolves with field due to the Zeeman-effect. We considered this hypothesis and evaluated the possibility of studying in detail the evolution of the SdH frequencies, and of the concomitant effective masses, as a function of the field. But as illustrated by the inset of Fig. 2 (c), the resolution among peaks in the FFT spectra, or the peak sharpness, decreases considerably when the very low field interval is excluded from the oscillatory signal, thus preventing such a detailed analysis.
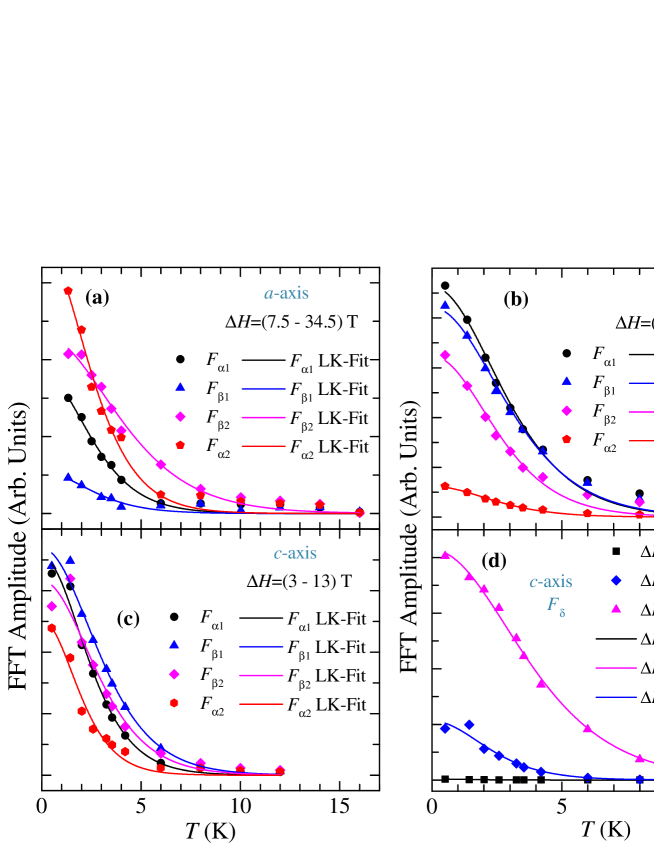
Figures 3 (a), (b), and (c) display the amplitude of each peak observed in the FFT spectra as a function of the temperature , for fields along the , , and the axis, respectively. Solid lines are fits to the Lifshitz-Kosevich formula (where , with being the effective mass and the average field value), from which we extract the effective masses. As seen, the fits are excellent and yield precise values for . More importantly, according to the fits in Fig. 3 (d), the effective mass of , or , is found to evolve as a function of the field: i.e. for ranging from 3 to 13 T, for fields between 8 and 20 T, for fields ranging from 15 to 35 T. In Table I below summarizes the experimental information extracted from this study, including effective masses for and to the axis, in each case extracted from two intervals in field, i.e. a low field region and the whole field window up to 35 T. As seen, the effective masses extracted from the whole field range are approximately a factor of 2 heavier than those extracted from the low field region, clearly indicating a renormalization of the effective mass induced by the application of a magnetic field. In the same table we include the results of an attempt to match the experimentally determined FSs with those determined from the DFT calculations by independently adjusting the position of the electron- and hole-bands relative to the Fermi level.
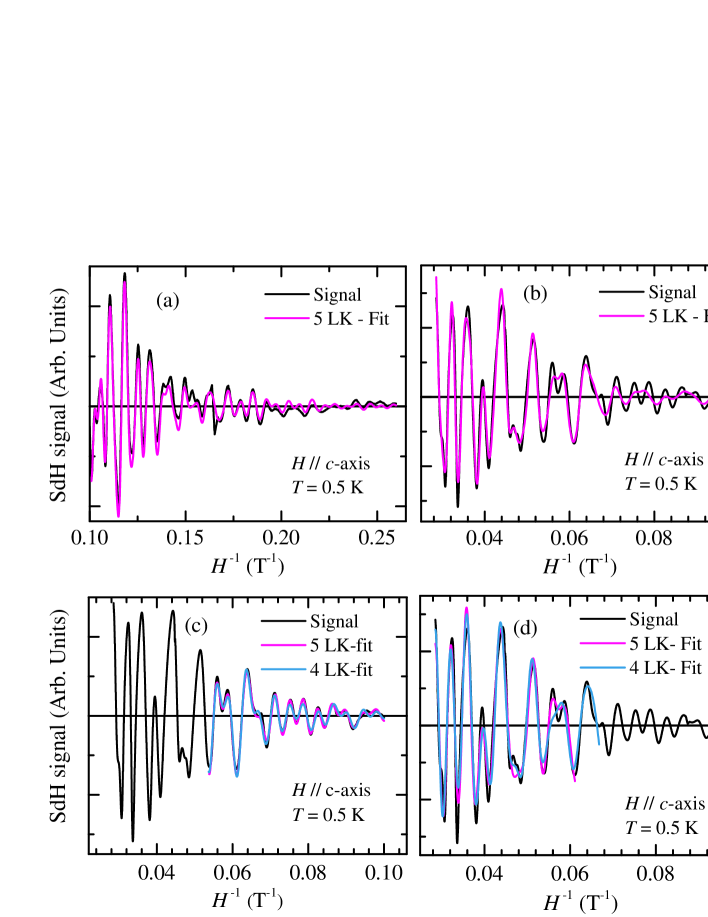
A renormalization of the effective masses necessarily implies the evolution of the electronic structure at the Fermi level due to the application of an external field. Such an evolution is likely to affect the geometry of the Fermi surface. To test this hypothesis in Fig. 5 we attempt to fit the oscillatory component, or the SdH signal superimposed onto the magnetoresistivity to the five frequencies observed in the FFT spectrum. However as illustrated by Figs. 5 (a) and (b) it is not possible to fit the SdH signal over the entire field range to 5 Lifshitz-Kosevich components (4 fundamental frequencies plus ), each composed of a sinusoidal term whose amplitude is normalized by , the exponential Dingle factor (whose argument is effective mass and scattering rate dependent) and the temperature factor , where is a constant. As seen in Fig. 5 (a), for fields below T one can fix the frequencies to the values obtained from the FFT spectrum and obtain a good fit of the experimental data over an extended range in if one considers the experimental noise and a less than perfect background subtraction. However, as seen in Fig. 5 (b) if one attempts the same exercise for fields beyond 10 T one cannot converge to a fit describing the oscillatory signal over the entire range. This is particularly surprising given that this window in inverse field is shorter than the interval previously used for Fig. 5(a). As illustrated by Figs. 5 (c) and (d) it is nevertheless possible to converge to good fits if one splits this interval into two intervals, i.e. from 10 to 18.6 T and from 18.6 to 35 T. For fields beyond 10 T we were unable to simultaneously resolve and ; the fits systematically converge to an average value between both frequencies and to another frequency around 400 T (curiously detected in the FFT spectra shown in the inset of Fig. 2(c)). This is likely attributable to the limited interval in . Hence, we have re-done the analysis after removing one LK component (blue traces) which does not compromise the fits. The important observation is that increases from 93 T (in the field interval 3.5 to 10 T) to 103 T ( 18.6 to 35 T), from 132 to 145 T and to 187 T. One could argue that the fits of the highest field oscillatory data are not excellent and hence question the validity of the obtained frequencies. However, here we have shown that it is not possible to fit the entire field range with fixed frequencies and effective masses: the Dingle and temperature factors also depend on the field interval chosen for the fits. Together with the previously shown effective mass renormalization, this indicates that the electronic structure of WTe2 evolves with field due to the Zeeman splitting.
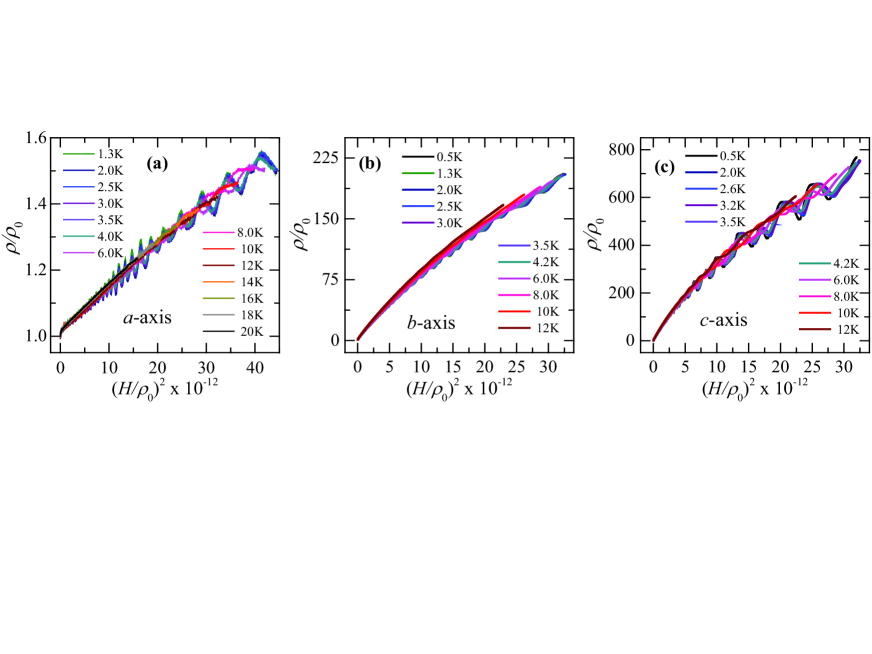
In Fig. 4 we show Kohler plots of the resistivity normalized by its zero field value as a function of the square of the field normalized by and for fields along all three crystallographic orientations. Recently, it was claimedzhao that WTe2 would not obey the Kohler rulepippard , leading to an anomalous linear magnetoresistance for currents parallel to the field. However, as seen in Fig. 4, our data clearly follows Kohler scaling with very mild deviations for fields along the axis, and only for the curves taken at higher temperatures. At lower fields, and for fields along the axis, indeed . Since for this current/field configuration the Lorentz force is nearly zero, which leads to no orbital magnetoresistivity, a very careful experimental effort, such as very precise field-alignment and homogeneous current distribution will be required to characterize this effect. The fact that WTe2 nearly obeys Kohler rule for all three crystallographic orientations implies that its orbital magnetoresistivity is dominated by scattering by phonons and impurities.
III DFT calculations and the evolution of the Fermi surfaces
One of the main goals of this study is to compare the geometry of the experimentally detected FSs with those resulting from ab-initio calculations such as the ones included in Refs. cava, ; pletikosic, ; behnia, ; Lv, . Notice that the initial calculations cava ; pletikosic ; Lv ignored spin-orbit coupling, implying the existence of one hole- and one electron-like pocket. This would be at odds with the results reported by Ref. behnia, . In this paper, electronic structure calculations were performed by using the Vienna ab-initio simulation package Shishkin3 ; Fuchs ; Shishkin2 ; Shishkin1 (VASP) within the generalized gradient approximation (GGA). We have included the contribution of spin-orbit coupling in our calculations. The Perdew-Burke-Ernzerhof (PBE) exchange correlation functional PBE and the projected augmented wave (PAW) methodology Blochl was used to describe the core electrons. The 5d and 6s electrons for W and the 5s and 5p electrons for Te were treated as valence electrons in all our calculations. The energy cut off for the plane-wave basis was chosen to be 600 meV. A total of 96 bands and a point mesh of were used for the self-consistent ground state calculations. A total of 100 points were chosen between each pair of special points in the Brillouin-zone for the band-structure calculations.
In order to obtain an accurate and detailed representation of the Fermi surface we have used a k-point mesh. The areas of the observed and calculated FS orbits are related to the SdH frequencies by the Onsager relation,
| (1) |
where Tm2 is the quantum of flux and is the area of the electron orbit perpendicular to the field. The effective masses of the electron- and the hole-pockets at these extremal orbits are determined by using the relation:
| (2) |
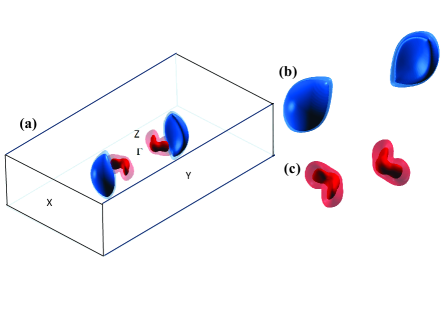
We have calculated the areas of the orbits by considering cuts of the Fermi surface with planes intersecting the Fermi surface perpendicularly to the a-, b- and the c-axis at various different angles. In an attempt to match the experimentally observed FSs with the calculated ones, we chose to adjust our calculations to the experimental cross-sections obtained for fields along the c-axis. For this, the energy of the electron pockets were down shifted with respect to the Fermi level by an amount of 25 meV, while the hole pockets were displaced upwards by 20 meV. The fermi surfaces were generated using the eigenvalues obtained from VASP and were visualized using the XCrysden software Kokalj . As seen in Fig. 6, the resulting Fermi surface is composed of two sets of spin-orbit split pockets at either side of the -point and along the -X direction, with the electron-like pockets being depicted in blue or clear blue color, and the hole-like in red or in clear and nearly transparent red.
In Table 2 below, we summarize the experimental results as well as those resulting from the DFT calculations. In particular, we present a comparison between the experimental effective masses , extracted from the fits in Fig. 3, and the band masses resulting from the DFT calculations. Here, the important observation is not only the marked contrast between the band masses and the experimental effective-masses with the band masses being systematically heavier (in particular for the -orbits), but also their field dependence. As seen in Table 2, the effective masses are strongly field dependent, increasing by nearly a factor of 2 when they are extracted from the whole field range as compared with the masses extracted from the low field region. This is a very clear indication for the role of the magnetic field in altering the electronic structure at the Fermi level and in leading to a concomitant increase in the density of states at the Fermi level . For samples that start to display quantum oscillatory behavior under fields T it is remarkable, as seen in the inset of Fig. 2 (c), that one cannot resolve all four peaks in the FFT spectrum when it is taken over a broad range in , such as T. However, as illustrated in the Supplemental Material supplemental through simple simulations of the experimental data, this just reflects the much lower number of oscillations within this inverse field range when compared to the number of oscillations observed in fields ranging from T up to 9 T.
| T | T | T | T | T | ||||||
|---|---|---|---|---|---|---|---|---|---|---|
| 1.37 | 0.84 | 0.72 | 0.57 | 0.78 | ||||||
| 1.32 | 1.02 | 1.1 | 1.14 | 2.31 | ||||||
| 1.02 | 0.56 | 0.43 | 0.84 | 3.9 | ||||||
| 0.97 | 0.57 | 0.51 | 1 | 5.14 |
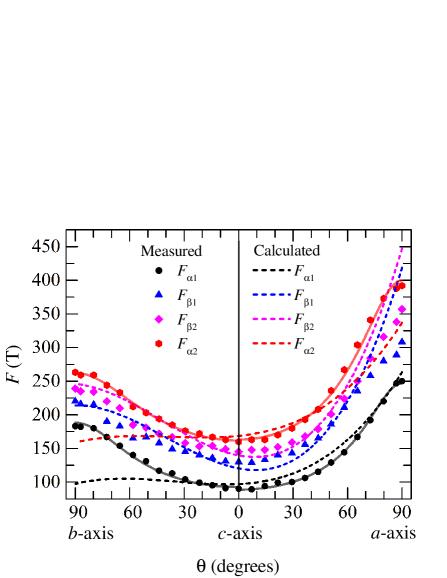
Table 2 also shows the density of carriers that one would extract from our experiments by assuming ellipsoidal FS pocketsbehnia . As discussed further below, we fit the observed angular dependence of the cross-sectional areas to ellipsoidal Fermi surfaces to extract the corresponding Fermi-vectors . The volume of each FS pocket is estimated through the expression for the volume of an ellipsoid, i.e. . To extract one renormalizes by the volume of the Brillouin zone. This simple estimation yields a % larger density of electrons with respect to that of the holes. However, and as we discuss below, the determination of is characterized by error bars in the order of %, implying an error of % in the calculation of the volume of each pocket. Hence, the frequencies or cross sectional areas extracted at low fields are consistent with near perfect compensation, if one assumed that and corresponded to hole pockets and and to electron pockets. Instead, if one assumed for example, that two lowest frequencies, i.e. and corresponded to the hole-pockets and the other two to electron pockets, which is the indexation suggested by Ref. cai, , one would obtain % more electrons than holes thus placing this system far from compensation. The other possible combination satisfying the indexation of Ref. cai, would yield % more carriers of one type with respect to the other. This would necessarily contradict the original claim in Refs. cava ; pletikosic of nearly perfect carrier compensation. Hence, our indexation is far more consistent with the pronounced magnetoresistivity displayed by this compound. The FSs calculated by DFT, and subsequently adjusted to match the experimental results, lead to a much worse situation, with the density of electrons becoming times larger than the density of holes.
In Fig. 7 the geometry of the FS is compared to the geometry of the DFT calculated FSs. Figure 7 shows the position of the four fundamental peaks found if the FFT spectra of the SdH signal as a function of the angle relative to the crystallographic c-axis. Here, corresponds to the c-axis and corresponds to either the a- or the b-axis. Dashed lines depict the angular dependence of the frequencies resulting from our DFT calculations for both the hole- and the electron-pockets including spin-orbit coupling. These curves were obtained by a polynomial fit of their calculated values at discrete angles. Our calculations yield a relatively good agreement with the experimentally obtained frequencies for fields along the c-axis, and a modest agreement with the angular dependence of the frequencies corresponding to the electron-pockets. Nevertheless, it shows a very poor agreement with the angular dependence associated with the hole-pockets. In fact the observed angular dependence imply very similar geometry for the electron- and the hole-pockets. Solid lines correspond to fits of the observed angular dependence assuming ellipsoidal FSs. As seen, and as already pointed out by Ref. behnia, , the experimental data can be well described in terms of ellipsoidal pockets. The corresponding Fermi vectors extracted from our fits are given in Table II. Typical error bars in are in the order of 1%. It is however quite remarkable that the DFT calculations fail to describe the electronic structure of this weakly correlated binary compound.
| (Å | (Å T | (Å | (Å-3) | |
|---|---|---|---|---|
| 0.04474 | 0.06112 | 0.12428 | 0.0014237 | |
| 0.05668 | 0.08578 | 0.13886 | 0.0020823 | |
| 0.05312 | 0.07437 | 0.12585 | 0.0024678 | |
| 0.05431 | 0.08112 | 0.13372 | 0.0028278 |
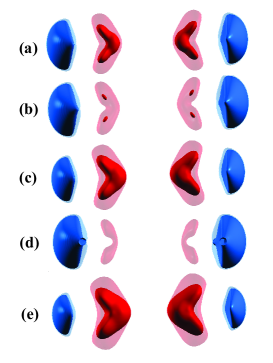
In Fig. 8 we illustrate the effect on the geometry of the FSs of displacing the position of the Fermi-level by 10 and 20 meV both above and below the Fermi surface. These displacements are intended to give us a rough idea of the role played by the Zeeman-effect on the geometry of the spin-orbit split FSs. The role of the Zeeman term is different for each one of the spin-orbit-coupling split pockets and different for electron and hole pockets and this effect is reversed when the magnetic field is applied in the opposite direction. Furthermore, the amount of the Zeeman splitting depends on since the mixing of the atomic orbitals in forming the Bloch states changes for different values of . Thus, we cannot infer the precise role of the Zeeman term by simply shifting the Fermi level as in Fig. 8. Nevertheless the results shown in Fig. 8 conveys the sensitivity of the geometry of Fermi surfaces sheets with respect to an applied field. Notice that the hole-pockets change significantly by displacing the Fermi level by a small amount in energy, i.e., of the order of just 10 meV, which would correspond to a Zeeman splitting of the order of 100 T. The change is more dramatic when the Fermi level is shifted upwards. This exercise implies that the Zeeman-effect could induce pronounced changes in the geometry of the FSs altering the balance between opposite spin carriers. Notice also how the hole-pockets extracted from the DFT calculations, which present a boomerang like cross-section, nearly touch at its vertex when the Fermi level is displaced. Non-concentric Fermi surfaces like these would favor the magnetic breakdown between both orbits as experimentally seen.
IV Summary
In summary, by analyzing the angular dependence of the Shubnikov-de-Haas oscillations in single-crystals, we detect four Fermi surface cross-sectional areas in the semi-metal WTe2. By following density functional theory calculations, we conclude that they correspond to spin-orbit split electron- and hole-pockets or two sets of concentric pockets at either side of the -point. Nevertheless, the experimentally observed angular dependence for the cross-sectional areas is poorly described by the DFT calculations. Their geometry is well-described in terms of ellipsoidal pockets as suggested by Ref. behnia, . The discrepancy between the ab-initio calculations and the experimentally determined cross-sectional areas is far more pronounced for the hole-pockets. We observed four SdH frequencies (and not three as claimed by Ref. xiang_three_pockets, ) which are in excellent agreement with those reported in Refs. behnia, ; cai, , indicating that the geometry of the extracted Fermi surfaces does not dependent on sample quality (for samples with resistivity ratios between ). We, as well as Ref behnia, , attribute the two middle frequencies to electron-pocket(s), with the other two corresponding to the hole one(s).
In contrast to Ref behnia, , we attribute this geometry to the spin-orbit splitting of the hole and electron Fermi-surfaces. On the other hand Ref. cai, , based on their pressure dependent studies combined with band structure calculations, attributes the middle two frequencies and to electron- and hole-orbits, respectively. Based on our angular-dependent study, this indexation would necessarily imply a sizeable difference in volumes between the electron- and the hole- Fermi surfaces, and therefore result in a pronounced lack of carrier compensation at zero-field. Here, we emphasize that our choice for the indexation of the Fermi surfaces in combination with the volumes of the extracted ellipsoidal Fermi surfaces, do not discard near perfect compensation between electron- and hole-densities at zero- or low fields.
By performing measurements up to higher fields we find experimentally that the effective masses in WTe2 are renormalized by the magnetic field, increasing considerably as the field increases. This is consistent with our fits of the oscillatory SdH signal as a function of the inverse field (to several Lifshitz-Kosevich components). These fits also indicate that the fundamental frequencies are evolving with field. Both observations point towards a magnetic field induced modification of the electronic structure at the Fermi level or a Fermi surface that is responsive to a magnetic field. Our DFT calculations as well as those in Ref. bernevig, indicate that the geometry of the Fermi surface in WTe2 is very sensitive to the exact position of the Fermi level. Therefore, it is not surprising to find that the spin-up and spin-down Fermi surfaces can be slightly modified by the Zeeman-effect, which apparently is displacing the (spin-dependent) density of states at the Fermi-level towards van-Hove singularities. We believe that this effect could have a relevant influence on the observed colossal magnetoresistivity of WTe2.
In a 3D Landau-Fermi liquid, the quasiparticle lifetime decreases with increasing quasiparticle energy difference from the Fermi energy pines . If, upon application of a strong magnetic field the Fermi surface was altered, one should expect a strong influence on the quasiparticle scattering rates and lifetimes, contributing perhaps in a non-trivial manner to the large magnetoresistance observed in WTe2.
Finally, the lack of agreement between our experimental observations and the band structure calculations has important implications. For example, the absence of a precise knowledge of the electronic structure at the Fermi level makes it difficult, or nearly impossible, to predict its topological properties bernevig .
V Acknowledgements
The NHMFL is supported by NSF through NSF-DMR-1157490 and the State of Florida. LB is supported by DOE-BES through award DE-SC0002613 and by Army Research Office through the MURI grant W911NF-11-10362.
References
- (1) M. Chhowalla, H. S. Shin, G. Eda, L. J. Li, K. P. Loh, H. Zhang, The chemistry of two-dimensional layered transition metal dichalcogenide nanosheets, Nature Chem. 5, 263 (2013);S. Z. Butler, S. M. Hollen, L. Y. Cao, Y. Cui, J. A. Gupta, H. R. Gutierrez, T. F. Heinz, S. S. Hong, J. X. Huang, A. F. Ismach, E. Johnston-Halperin, M. Kuno, V. V. Plashnitsa, R. D. Robinson, R. S. Ruoff, S. Salahuddin, J. Shan, L. Shi, M. G. Spencer, M. Terrones, W. Windl, J. E. Goldberger, Progress, Challenges, and Opportunities in Two-Dimensional Materials Beyond Graphene, ACS Nano 7, 2898 (2013).
- (2) Q. H. Wang, K. Kalantar-Zadeh, A. Kis, J. N. Coleman, M. S. Strano, Electronics and optoelectronics of two-dimensional transition metal dichalcogenides, Nature Nanotech. 7, 699 (2012).
- (3) C. Gaiser, T. Zandt, A. Krapf, R. Serverin, C. Janowitz, R. Manzke, Band-gap engineering with HfSxSe2−x, Phys. Rev. B 69, 075205 (2004).
- (4) C. Ruppert, O. B. Aslan, and T. F. Heinz, Optical Properties and Band Gap of Single- and Few-Layer MoTe2 Crystals, Nano Lett. 14, 6231 (2014).
- (5) B. Sipos, A. F. Kusmartseva, A. Akrap, H. Berger, L. Forró and E. Tutiš, From Mott state to superconductivity in 1T-TaS2, Nature Mater. 7, 960 (2008).
- (6) D. E. Moncton, J. D. Axe, and F. J. Disalvo, Neutron scattering study of the charge-density wave transitions in 2H-TaSe2 and 2H-NbSe2, Phys. Rev. B 16, 801 (1977); S. Bhattacharya, and M. J. Higgins, Dynamics of a disordered flux line lattice, Phys. Rev. Lett. 70, 2617 (1993).
- (7) M. N. Ali, J. Xiong, S. Flynn, J. Tao, Q. D. Gibson, L. M. Schoop, T. Liang, N. Haldolaarachchige, M. Hirschberger, N. P. Ong and R. J. Cava, Large, non-saturating magnetoresistance in WTe2, Nature 514, 205 (2014).
- (8) A. B. Pippard, Magnetoresistance in Metals (Cambridge University, Cambridge, 1989).
- (9) I. Pletikosić, M. N. Ali, A. V. Fedorov, R. J. Cava, and T. Valla, Electronic Structure Basis for the Extraordinary Magnetoresistance in WTe2, Phys. Rev. Lett. 113, 216601 (2014).
- (10) J. Jiang, F. Tang, X. C. Pan, H. M. Liu, X. H. Niu, Y. X. Wang, D. F. Xu, H. F. Yang, B. P. Xie, F. Q. Song, X. G. Wan, and D. L. Feng, Signature of strong spin-orbital coupling in the large non-saturating magnetoresistance material WTe2, arXiv:1503.01422 (2015).
- (11) T. Liang, Q. Gibson, M. N. Ali, M. Liu, R. J. Cava, and N. P. Ong, Ultrahigh mobility and giant magnetoresistance in the Dirac semimetal Cd3As2, Nature Mater. 14, 280 (2015).
- (12) F.X. Xiang, M. Veldhorst, S.X. Dou, and X.L. Wang, Multiple Fermi pockets revealed by Shubnikov-de Haas oscillations in WTe2, arXiv:1504.01460 (2015).
- (13) Z. Zhu, X. Lin, J. Liu, B. Fauqué, Q. Tao, C. Yang, Y. Shi, and K. Behnia, Quantum Oscillations, Thermoelectric Coefficients, and the Fermi Surface of Semimetallic WTe2, Phys. Rev. Lett. 114, 176601 (2015).
- (14) Y. Zhao, H. Liu, J. Yan, W. An, J. Liu, X. Zhang, H. Jiang, Q. Li, Y. Wang, X.-Z. Li, D. Mandrus, X. C. Xie, M. Pan, J. Wang, Anisotropic Magnetotransport and Exotic Longitudinal Linear Magnetoresistance in WTe2 Crystals, Phys. Rev. B 92, 041104 (2015).
- (15) P. L. Cai, J. Hu, L. P. He, J. Pan, X. C. Hong, Z. Zhang, J. Zhang, J. Wei, Z. Q. Mao, and S. Y. Li, Drastic pressure effect on the extremely large magnetoresistance in WTe2: a quantum oscillation study, arXiv:1412.8298v4 (2014).
- (16) H. Y. Lv, W. J. Lu, D. F. Shao, Y. Liu, S. G. Tan, Y. P. Sun, Perfect charge compensation in WTe2 for the extraordinary magnetoresistance: From bulk to monolayer, arXiv:1412.8335 (2014).
- (17) B. Fauqué, H. Yang, I. Sheikin, L. Balicas, J.-P. Issi, and K. Behnia, Hall plateaus at magic angles in bismuth beyond the quantum limit, Phys. Rev. B 79, 245124 (2009).
- (18) A. A. Soluyanov, D. Gresch, Z. Wang, Q. Wu, M. Troyer, X. Dai, B. A. Bernevig. A New Type of Weyl Semimetals. arXiv:1507.01603 (2015).
- (19) M. Shishkin, M. Marsman, and G. Kresse, Accurate Quasiparticle Spectra from Self-Consistent GW Calculations with Vertex Corrections, Phys. Rev. Lett. 99, 246403 (2007).
- (20) F. Fuchs, J. Furthmüller, F. Bechstedt, M. Shishkin, and G. Kresse, Quasiparticle band structure based on a generalized Kohn-Sham scheme, Phys. Rev. B 76, 115109 (2007).
- (21) M. Shishkin and G. Kresse, Self-consistent GW calculations for semiconductors and insulators, Phys. Rev. B 75, 235102 (2007).
- (22) M. Shishkin and G. Kresse, Implementation and performance of the frequency-dependent GW method within the PAW framework, Phys. Rev. B 74, 035101 (2006).
- (23) J. P. Perdew, K. Burke, and M. Ernzerhof, Generalized Gradient Approximation Made Simple, Phys. Rev. Lett. 77, 3865 (1996).
- (24) P. E. Blöchl, Projector augmented-wave method, Phys. Rev. B 50, 17953 (1994).
- (25) A. Kokalj, Computer graphics and graphical user interfaces as tools in simulations of matter at the atomic scale, Comp. Mater. Sci. 28, 155 (2003), code available from http://www.xcrysden.org/.
- (26) See supplemental material at http://link.aps.org
- (27) P. Noziere and D. Pines, Theory of quantum liquids, ( W. A. Benjamin, New York, 1966).