Updating an empirical analysis on the proton’s central opacity and asymptotia
Abstract
We present an updated empirical analysis on the ratio of the elastic (integrated) to the total cross section in the c.m. energy interval from 5 GeV to 8 TeV. As in a previous work, we use a suitable analytical parametrization for that ratio (depending on only four free fit parameters) and investigate three asymptotic scenarios: either the black disk limit or scenarios above or below that limit. The dataset includes now the datum at 7 TeV, recently reported by the ATLAS Collaboration. Our analysis favors, once more, a scenario below the black disk, providing an asymptotic ratio consistent with the rational value , namely a gray disk limit. Upper bounds for the ratio of the diffractive (dissociative) to the inelastic cross section are also presented.
XIII International Workshop on Hadron Physics
to be published in IOP: Conference Series
1 Introduction
The total cross section () and the elastic cross section () are fundamental quantities in the study of elastic hadron scattering. Their ratio, as a function of the c.m. energy squared,
| (1) |
plays also an important role [1, 2]: it is related to the ratio of the inelastic cross section () to the total cross section via unitarity; it is connected to the central opacity in hadron-hadron collisions (impact parameter representation); it can be related to the ratio between and the elastic slope , which is an important quantity in studies on extensive air showers (cosmic-ray experiments).
However, connects two quantities associated with soft strong scattering states, which, presently, are not directly and unequivocally described from the first principles of QCD. In this situation, a possible strategy of investigation is to obtain phenomenological and/or empirical descriptions of these quantities which may contribute with the search of suitable calculational schemes in the nonpertubative sector of QCD.
In this communication, we present an empirical approach for studying in the case of proton-proton () and antiproton-proton () scattering. This analysis follows previous studies by Fagundes and Menon [3, 4] and Fagundes, Menon and Silva [5]. Here, besides the new experimental data on and obtained at the CERN-LHC at 7 and 8 TeV by TOTEM Collaboration [6, 7], we also include the recent ATLAS Collaboration results at 7 TeV [8]. By means of a suitable empirical parametrization and fits to the experimental data, we investigate different asymptotic scenarios for . Our analysis favors a scenario below the black-disk limit, consistent with the rational value 1/3. We discuss some preliminary tests on the selection of free parameters and infer that 1/4 may constitute an upper bound for the ratio between the soft diffractive cross section (single/double dissociation) and the inelastic cross section.
2 Empirical parametrization and asymptotic scenarios
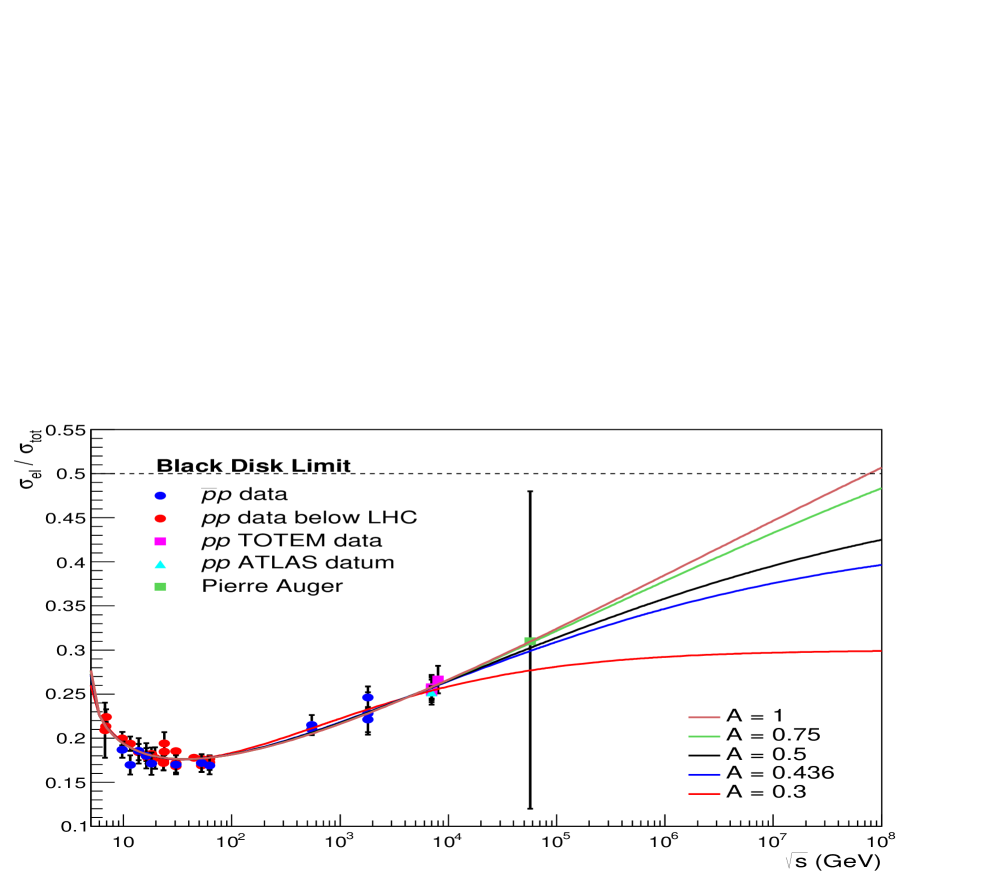
Our dataset comprises measurements of and from and scattering obtained in accelerator experiments, from GeV up to TeV [9]. The statistical and systematic uncertainties have been added in quadrature. The experimental points for are shown in figure 1. In this figure we also display the point at 57 TeV obtained via unitarity from the estimates of and by the Pierre Auger Collaboration [10]; this point did not take part in the data reductions: it is shown only as an illustration of cosmic-ray information presently available.
2.1 Empirical parametrization
On the one hand, from the empirical behavior of (figure 1), we see that this quantity decreases until GeV and then begins to rise as the energy increases and with a positive curvature. On the other hand it is expected that the ratio becomes constant when , i.e. saturates. The value of this constant can change from model to model (see discussion below). Since the saturation implies in a negative curvature, it is expected a change of curvature in at some finite energy. Based on these facts and looking for an economical number of free parameters, we consider the following analytical parametrization:
| (2) |
with
| (3) |
where , , , and are dimensionless parameters, in principle, free fit parameters and is a fixed energy scale. As constructed, the parameter corresponds to the asymptotic value of , and the hyperbolic tangent takes account of the change of curvature. Therefore, in data reductions, by fixing we can define an asymptotic scenario or by letting it free we can select a scenario.
2.2 Asymptotic scenarios
The standard scenario in the phenomenological context, typical of eikonal models (for example, [11]), concerns the black disk limit, which predicts [12]. However, theoretical, phenomenological and empirical arguments, allow also to consider scenarios either above or below the black disk, as discussed in what follows.
2.2.1 Scenarios above the black disk
From the -channel unitarity,
Therefore, a maximum value for the ratio allowed in the formal context reads .
Moreover, two well known formal limits (the Froissart-Lukaszuk-Martin bound for total cross section [13] and a similar bound for the inelastic cross section [14]) predict
Now, assuming that both limits saturate when , it is possible that , and therefore, from unitarity, we have also a “formal" possibility (“formal" result). We recall that a scenario above the black disk is also indicated in the phenomenological context through the -Matrix unitarity scheme [15].
2.2.2 Scenarios below the black disk
Taking into account the TOTEM empirical fit to data [6, 7] and the highest-rank fit result to data by the COMPETE Collaboration [16], the central values of the free parameters lead to the asymptotic ratio (see [17, 18] for details) (TOTEM/COMPETE).
Moreover, in a recent study on the rise of , we have considered a parametrization with Regge, Pomeron terms and a leading contribution in the form , with either fixed to 2 or as a free fit parameter [17, 18, 19]. The parametrization was also extended to fit the data and in all cases investigated we have obtained asymptotic ratios below the black disk and consistent with the rational limits between and [19]. As an extreme scenario we consider here the lowest value obtained in the analyses (denoted FMS), which, within the uncertainties from error propagation, reads (minimum FMS).
In what follows we shall consider the asymptotic limits A = 1.0, 0.75, 0.50, 0.436, 0.30, as representative values for investigating the three different scenarios. As already commented, with parametrization (2-3), once is fixed to each one of the aforementioned values we define an asymptotic scenario and by letting as a free parameter we can select a scenario.
3 Fits and results
Different fits and procedures have been tested in order to select a best value for the energy scale , which led to the energy cutoff as an optimum value. Therefore, we fix 25 GeV2.
In what follows, we first present the fits to only data, since, as we shall demonstrate, they allow us to fix (eliminate) one of the free parameters in (2-3). With this particular parametrization the fits are then extended to include data.
3.1 Preliminary fits to data
The dataset consists of 29 points (cutoff at 5 GeV), including those at 7 and 8 TeV by the TOTEM [6, 7] and ATLAS Collaborations [8]. We have fixed to each value referred to above and letting free the parameters , , and . The results are shown in table 1, together with the statistical information on the fit results: reduced chi-squared () and integrated probability , where is the number of degrees of freedom.
| fixed | ||||||
|---|---|---|---|---|---|---|
| 0.3 | 1.200 0.046 | -0.604 0.048 | 0.240 0.018 | 0.6494 0.0039 | 0.846 | 0.684 |
| 0.436 | 0.73 0.16 | -0.30 0.11 | 0.0787 0.050 | 0.52 0.31 | 0.822 | 0.717 |
| 0.5 | 0.62 0.13 | -0.245 0.094 | 0.0625 0.038 | 0.51 0.31 | 0.820 | 0.720 |
| 0.75 | 0.392 0.085 | -0.149 0.63 | 0.0362 0.022 | 0.50 0.31 | 0.817 | 0.724 |
| 1.0 | 0.289 0.063 | -0.108 0.048 | 0.020 0.016 | 0.49 0.32 | 0.816 | 0.726 |
From table 1 we note that, with the exception of the extreme case , all the results for the parameter are compatible with the value 0.5 within the uncertainties. That suggested us the possibility to fix , reducing, therefore, the number of free parameters. With that assumption the parametrization (2-3) now reads
| (4) |
with , , free parameters ( GeV2). We stress the small number of free parameters: 3 in the case of fixed and 4 if is let free. This parametrization was introduced in [5] and will be employed in what follows.
3.2 Simultaneous fits to and data
Now our dataset consists of 42 points. As before, we first consider fits with the fixed values for , using as initial values for the free parameters those obtained in the fits to data (table 1).
The fit results and statistical information are shown in table 2 and the corresponding curves together with the experimental data in figure 1. We see that, despite the distinct asymptotic behaviors, all the fit results show consistence with the experimental data presently available. In other words, with parametrization (5) and fixed, we can not select an asymptotic scenario.
| fixed | |||||
|---|---|---|---|---|---|
| 0.3 | 1.317 0.053 | -0.658 0.049 | 0.168 0.011 | 0.771 | 0.846 |
| 0.436 | 0.728 0.024 | -0.301 0.021 | 0.0756 0.0046 | 0.776 | 0.841 |
| 0.5 | 0.612 0.019 | -0.245 0.017 | 0.0614 0.0037 | 0.782 | 0.832 |
| 0.75 | 0.386 0.011 | -0.146 0.010 | 0.0365 0.0021 | 0.795 | 0.816 |
| 1.0 | 0.2846 0.0083 | -0.1058 0.0073 | 0.0264 0.0015 | 0.794 | 0.813 |
However, a striking result is obtained in the case of as a free fit parameter. In fact, despite the strong nonlinearity of the fit, using as initial values of the parameters those displayed in table 2, with free, all the data reductions converge to the same result, given by
| (5) | |||
The comparison with the experimental data is shown in figure 2, where the uncertainty region has been evaluated through error propagation from the fit parameters (variances and covariances). Also shown in this figure is the prediction for the ratio , obtained via unitarity, together with the experimental data. Numerical predictions for these ratios at some energies of interest are displayed in table 3 (second and third columns).
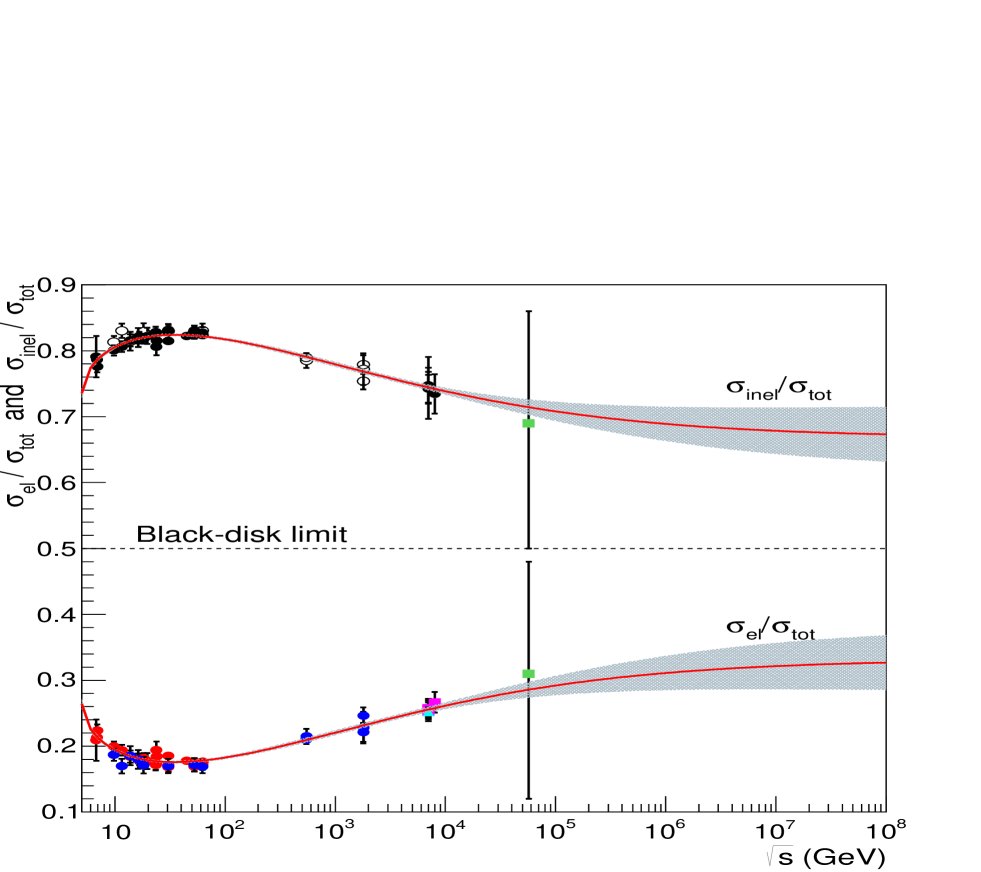
We conclude that our analysis favors a scenario below that of the black disk, with asymptotic value compatible with the rational limit
We note that this result is not in conflict with the Pumplin bound [20],
where stands for the soft diffractive cross section (single and double dissociation). If we consider the saturation of the Pumplin bound (equality in the above equation) yet at the LHC energy region [21], we can infer the predictions for the ratio displayed in table 3 (last column). Moreover, using the Pumplin bound and Unitarity, we can also infer an upper bound for ratio , namely
In this case, the maximum asymptotic value for is also compatible with a rational number:
| (TeV) | |||
|---|---|---|---|
| 2.76 | 0.2394 0.0036 | 0.7606 0.0036 | 0.2606 0.0036 |
| 7 | 0.2556 0.0043 | 0.7444 0.0043 | 0.2444 0.0043 |
| 8 | 0.2578 0.0046 | 0.7422 0.0046 | 0.2422 0.0046 |
| 13 | 0.2655 0.0058 | 0.7345 0.0058 | 0.2345 0.0058 |
| 14 | 0.2666 0.0061 | 0.7334 0.0061 | 0.2334 0.0061 |
4 Conclusions and final remarks
We have presented an empirical analysis of the experimental data presently available on the ratio above 5 GeV, including all the recent data at 7 and 8 TeV obtained at the LHC by the TOTEM and ATLAS Collaborations. Our model-independent parametrization, characterized by a small number of free parameters (3 or 4), allows consistent descriptions of all the experimental data analyzed (figures 1 and 2).
By letting free the parameter , the resulting asymptotic value of is compatible with a scenario below the black-disk limit, namely . This value is in agreement with our previous results based in distinct analyses [17, 18, 19]; it is also in plenty agreement with the recent phenomenological approach by Kohara, Ferreira and Kodama [22] which predicts for . Taking into account the Pumplin bound, it was possible to infer an upper bound for the ratio , consistent with the rational value 1/4.
Acknowledgments
Research supported by FAPESP-CAPES, Contract 2014/00337-8 (DAF) and FAPESP, Contract 2013/27060-3 (PVRGS).
References
- [1] Block M M and Cahn R N (1985) Rev. Mod. Phys. 57 563
- [2] Dremin I M (2013) Phys. Usp. 56 3 (Preprint arXiv: 1206.5474 [hep-ph])
- [3] Fagundes D A and Menon M J 2012 Nucl. Phys. A 880 1
- [4] Fagundes D A and Menon M J 2013 AIP Conf. Proc. 1520 297 (Preprint arXiv:1208.0510 [hep-ph]).
- [5] Fagundes D A, Menon M J and Silva P V R G 2015 AIP Conf. Proc. 1654 050005 (Preprint arxiv:1410.4423 [hep-ph])
- [6] Antchev G et al (The TOTEM Collaboration) 2013 Europhys. Lett. 101 21004
- [7] Antchev G et al (The TOTEM Collaboration) 2013 Phys. Rev. Lett. 111 012001
- [8] Aad G et al (The ATLAS Collaboration) 2014 Nucl. Phys. B 889 486
- [9] Olive K A et al (Particle Data Group) 2014 Chin. Phys. C 38 090001
- [10] Abreu P et al (The Pierre Auger Collaboration) 2012 Phys. Rev. Lett. 109 062002
- [11] Bourrely C, Soffer J and Wu T T 2011 Eur. Phys. J. C 71 1601
- [12] Block M M and Halzen F 2012 Phys. Rev. D 86 051504
- [13] Lukaszuk L and Martin A 1967 Nuovo Cimento A 52 122
- [14] Martin A 2009 Phys. Rev. D 80 065013
- [15] Troshin S M and Tyurin N E 2007 Int. J. Mod. Phys A 22 4437; 1993 Phys. Lett. B 316 175
- [16] Cudell J R et al (COMPETE Collaboration) 2002 Phys. Rev. Lett 89 201801
- [17] Fagundes D A, Menon M J and Silva P V R G 2013 J. Phys. G 40 065005
- [18] Menon M J and Silva P V R G 2013 Int. J. Mod. Phys. A 28 1350099
- [19] Menon M J and Silva P V R G 2013 J. Phys. G 40 125001
- [20] Pumplin J 1973 Phys Rev. D 8 2899
- [21] Lipari P and Lusignoli M 2013 Eur. Phys. J. C 73 11
- [22] Kohara A K, Ferreira E and Kodama T 2014 Eur. Phys. J. C 74 3175
- [23] Fagundes D A, Menon M J and Silva P V R G, Exploring central opacity and asymptotic scenarios in elastic hadron scattering, in preparation.