Twisted unwinding of multi-charged quantum vortex
and generation of turbulence in an atomic Bose–Einstein condensate
Abstract
We report the observation of the twisted decay of quadruply charged vortices in an atomic Bose-Einstein condensate. Supporting numerical simulations show that the singly-charged vortices, which result from the decay of a multi-charged vortex, twist around intertwined in the shape of helical Kelvin waves. Finally, we propose to apply this effect to generate an almost isotropic state of turbulence which we characterize in terms of the velocity statistics.
pacs:
03.75.Lm, 03.75.Kk, 47.37.+qSuperfluids are noteworthy because they flow without dissipating energy. Even more remarkably, superfluid flow patterns are characterized by the quantization of vorticity, arising from the existence and the uniqueness of a macroscopic wave function . The flow velocity is proportional to the the phase gradient of , and the circulation around a vortex line must be an integer multiple of the quantum of circulation , where is Planck’s constant and is the atomic mass. The singular nature of this quantized vorticity, concentrated along lines, has yet another important consequence: within a turbulent tangle of quantum vortices, the velocity components obey power-law statistics Paoletti2008 ; White2010 , unlike Gaussian statistics typical of ordinary turbulence. Recent experiments and numerical simulations Barenghi2014b have shown that, under certain conditions, the turbulent superflows share a remarkable property with classical turbulence: the same Kolmogorov energy spectrum Frisch , describing the distribution of kinetic energy over the large length scales. This property suggests that quantum turbulence may be the ‘skeleton’ of classical turbulence Hanninen2014 .
Atomic Bose-Einstein condensates (BECs) are emerging as ideal systems to explore the quantization of vorticity and many other fundamental problems concerning the nature of turbulence Tsatsos2016 . Vortices are more easily nucleated, manipulated Aioi2011 ; Davis2009 and observed Madison2000 ; Raman2001 ; Freilich2010 in BECs than in superfluid helium, due to the typical vortex core sizes which are orders of magnitude larger in gaseous BECs () than in liquid He ().
Multiply quantized vortices are interesting especially since they are energetically unstable and decay into singly quantized vortices Shin2004 ; Kumakura2006 ; Okano2006 ; Isoshima2007 . The angular momentum and the energy of an isolated vortex in a homogeneous superfluid grow respectively with and Donnelly1991 . For the same angular momentum, multi-charged () vortices carry more energy, and, in the presence of dissipative mechanisms (e.g. thermal excitations), tend to decay into singly-charged vortices, minimizing the system’s energy. Besides the energy instability, there is also a dynamical instability Pu1999 ; Mottonen2003 ; Huhtamaki2006a , which is able to destabilize the vortices even in the absence of dissipation, at zero temperature, whose time-scales have been investigated Mottonen2003 ; Shin2004 ; Huhtamaki2006b ; Mateo2006 ; Okano2006 ; Isoshima2007 ; Kuwamoto2010 ; Kuopanportti2010 . The technique of topological phase imprinting Nakahara2000 has allowed the controlled generation of multi-charged vortices Leanhardt2002 ; Shin2004 ; Okano2006 ; Kuwamoto2010 in atomic condensates. The splitting of doubly quantized vortices into two singly quantized vortices has been observed in a Na BEC and the decay process was studied Shin2004 ; Huhtamaki2006b ; Mateo2006 . Quadruply quantized vortices are theoretically predicted Kawaguchi2004 to decay presenting various symmetries of splitting, making them an interesting research topic. Recent work has determined that the stability of such vortices is affected by the condensate’s density Shin2004 and size Mateo2006 , and by the nature of the perturbations Kawaguchi2004 .
In this letter, we discuss the decay of an charged vortex line nucleated in prolate BECs. By combining experimental observations with numerical simulations, we present results showing the twisted decay process of a multi-charged vortex, induces helical Kelvin waves on the resulting singly-charged vortex lines. We also show that the observed intertwined decay of multi-charged vortices may be exploited to create an almost isotropic state of quantum turbulence in atomic condensates. Kelvin waves are of particular interest because they are thought to play a key role in quantum turbulence Barenghi2014a , being observed in classical fluids and superfluid helium, including atomic condensates Bretin03 ; Smith04 .
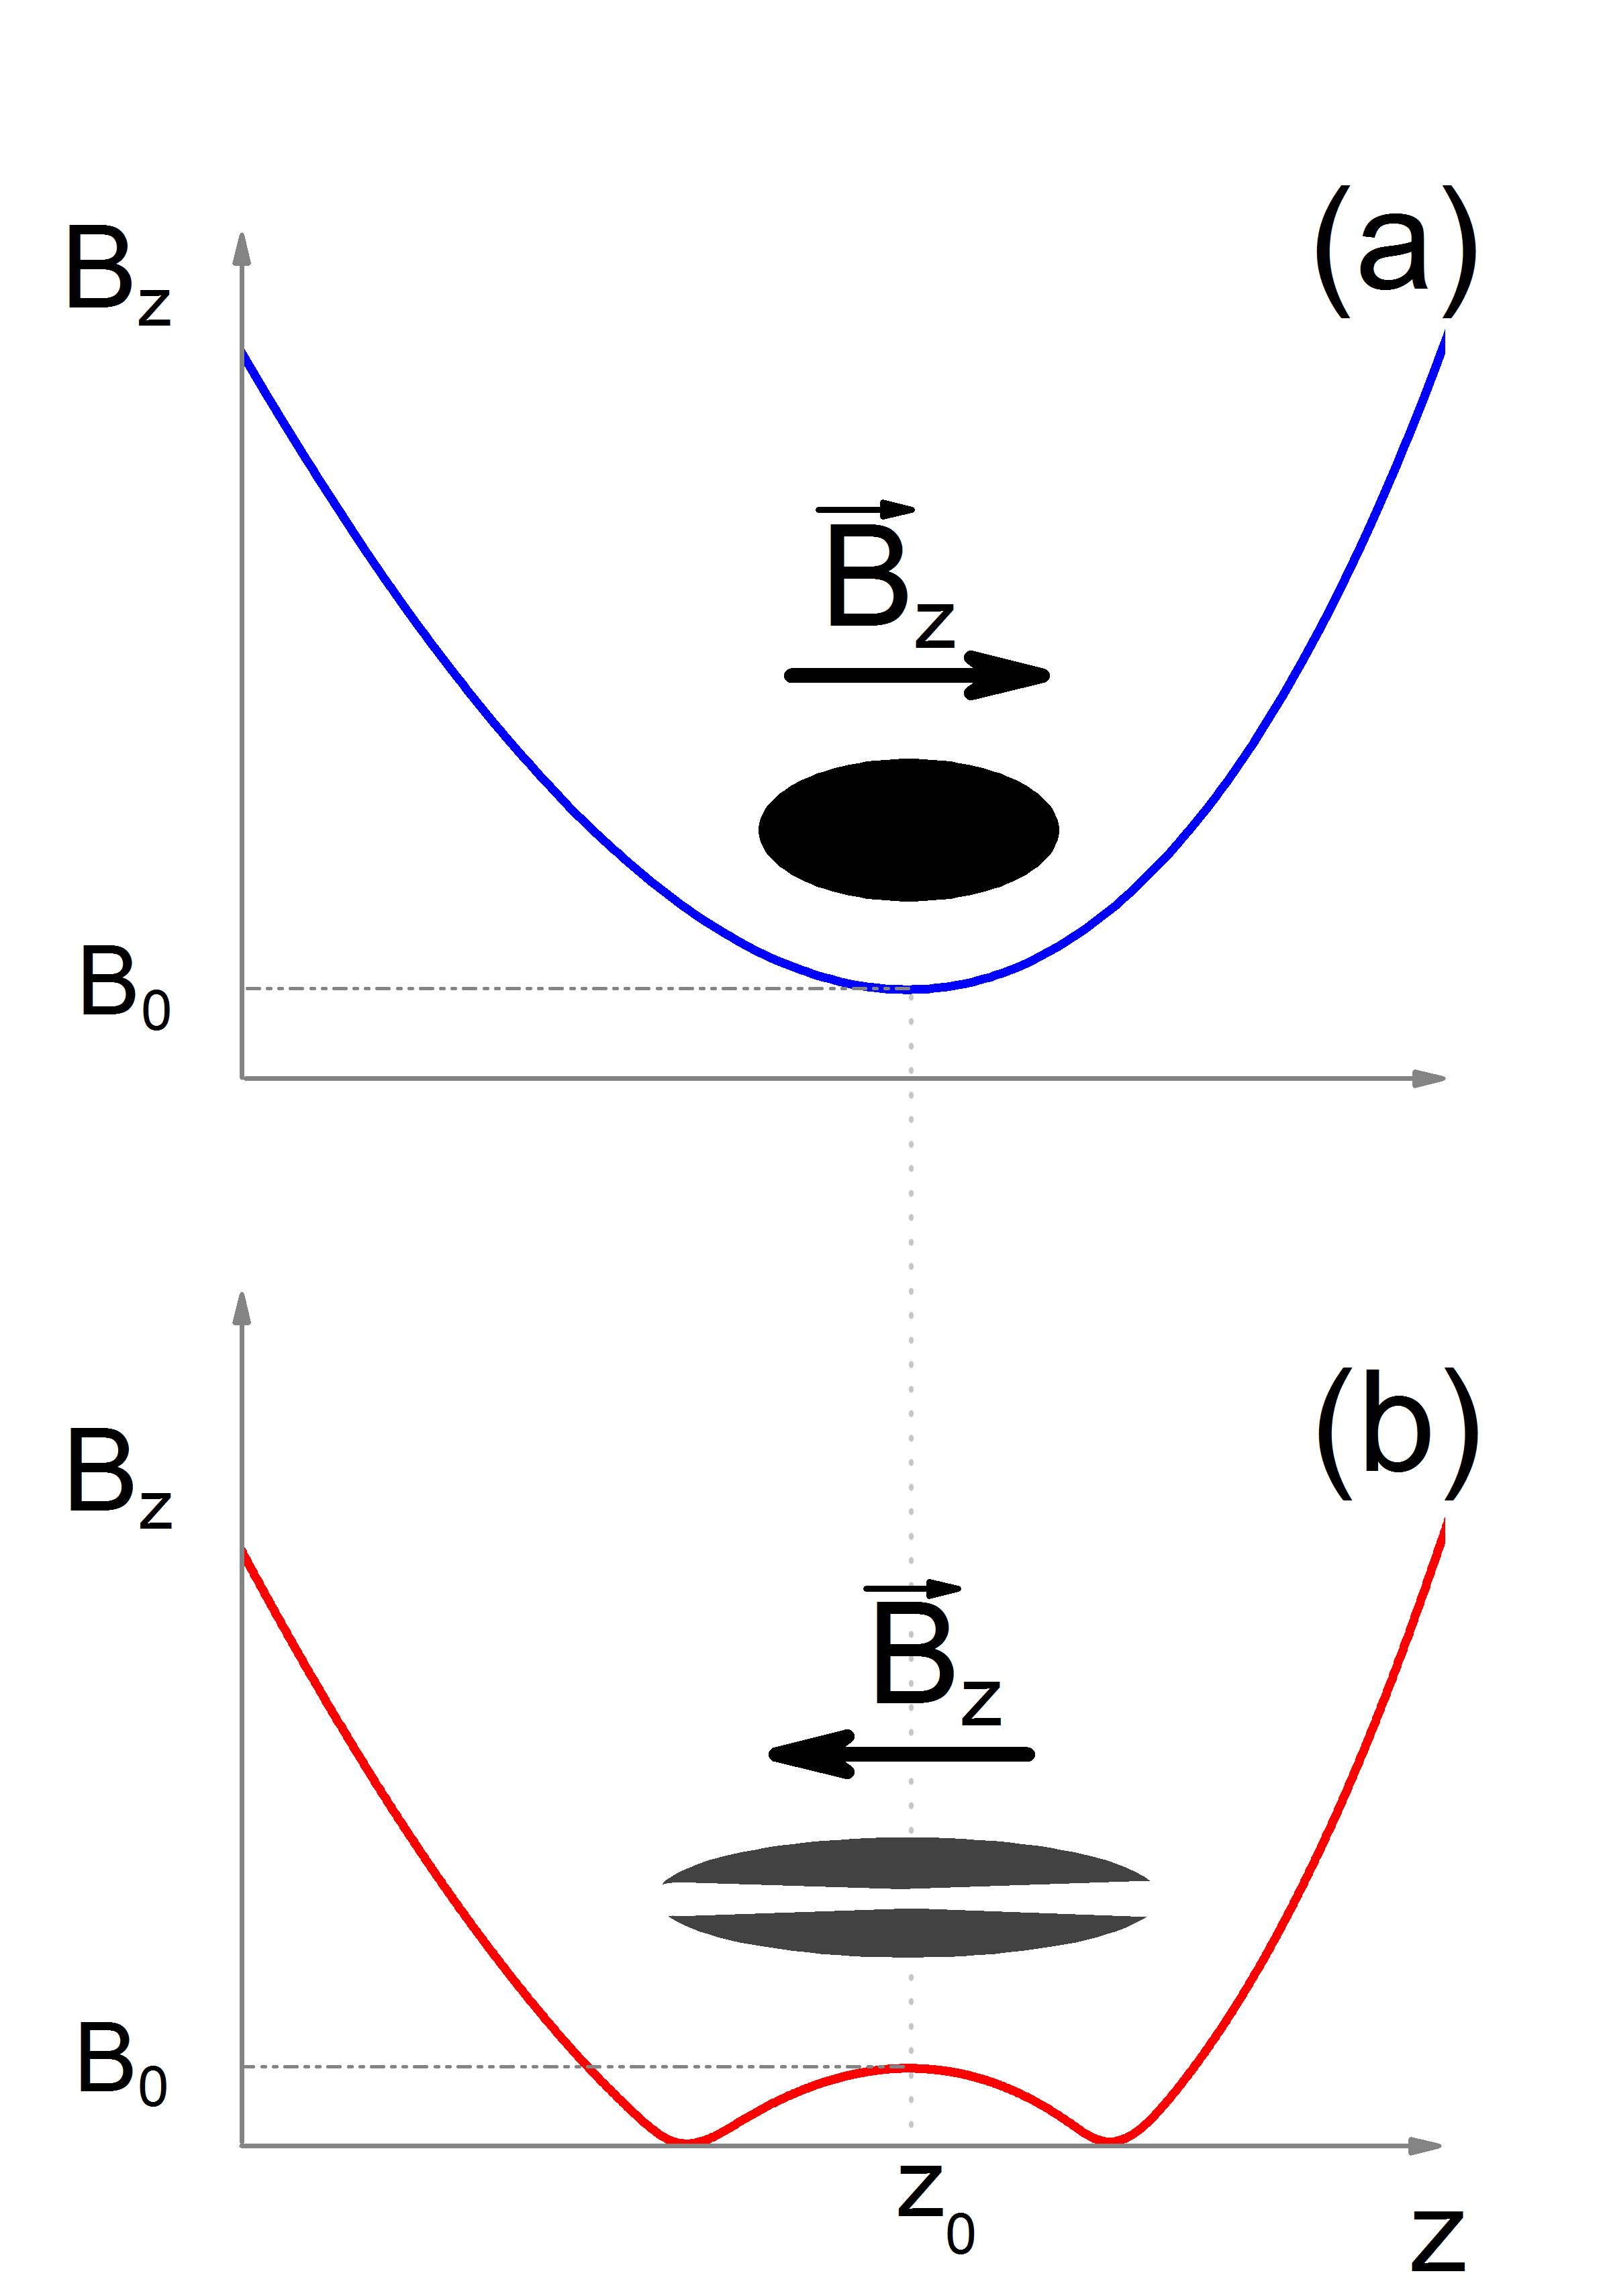
The experimental sequence to produce the BEC runs as follows. First, BECs are produced in the hyperfine state, with a small thermal fraction in a cigar-shaped QUIC magnetic trap. The atoms undergo forced evaporation for , from to about , following a non analytic curve, experimentally determined by optimizing the phase space density and the runaway condition in each step. We typically produce samples with no more than of thermal fraction, well into the Thomas-Fermi regime. The measured trapping frequencies are: in the symmetry axis, and in the radial direction, resulting in the (geometric) mean trap frequency, , and the harmonic oscillator length, . The typical properties of our BECs are: reduced temperature ; condensate atoms; total number of atoms; healing length ; axial and radial Thomas-Fermi radii and , respectively; chemical potential ; anisotropy parameter . The multi-charged vortices are nucleated by adiabatically reducing and inverting the initial trap bias field from down to , in typically. The resulting magnetic bias field along the weak trap direction, , is reversed during the process Supp1 . We find that the charged vortices, topologically imprinted, are unstable and decay into four singly-charged vortices in a twisted unwinding manner. The process is very reproducible, over several runs and different time-of-flight values. The 2D optical depth (OD) images presented correspond to the integrated number density acquired along the symmetry axis (axial images), shown in the top of Fig. 1, or integrated along (side images), shown from the side of the condensate, see Figs. 2, and 2. The experimental images are carefully compared to the corresponding 2D density maps (Fig. 2) and 3D isosurfaces (Fig. 2) resulting from the numerical simulations.
Given the relatively low condensate temperatures, we model the condensate’s dynamics using the Gross-Pitaevskii equation (GPE) PitaevskiiStringari2003
| (1) |
where is the condensate’s wavefunction, the position, the time, the trapping potential, the strength of the inter-atomic interactions and the s-wave scattering length. The normalization is where is the condensate volume. The GPE is cast in dimensionless form using harmonic oscillator units and solved numerically using the 4th order Runge Kutta method with the help of XMDS Dennis2013 . We simulate the vortex decay for a BEC cloud with atoms and the same radial and axial harmonic trap frequencies of the experiment.
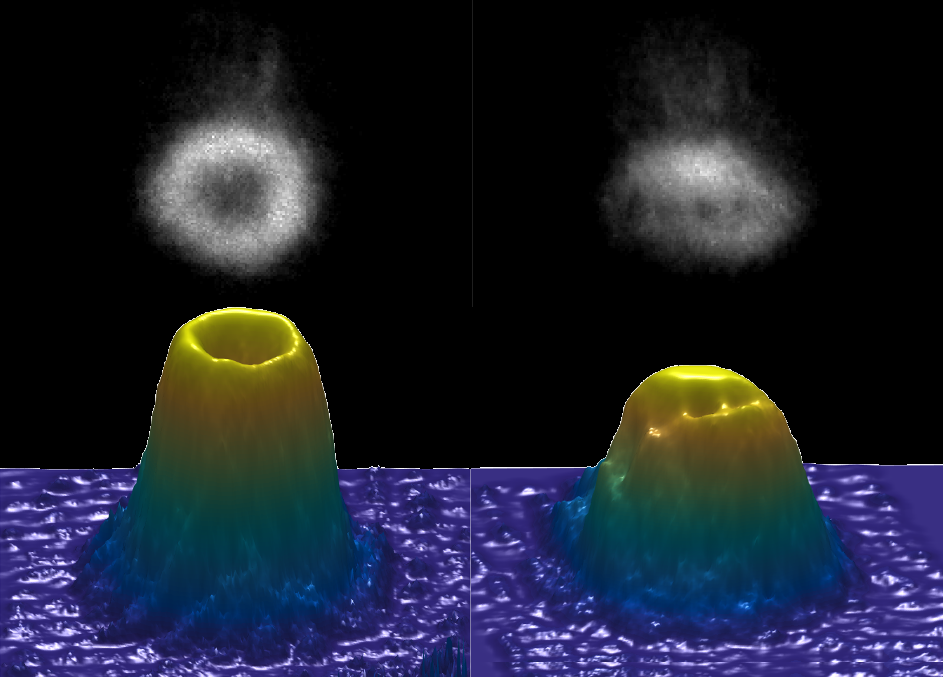
The top left picture in Fig. 1 shows a typical BEC axial optical depth image of a charged vortex before it decays; on the bottom left, the corresponding number density surface. Note the large central circular depletion, representing its core. The top right and bottom images show a BEC containing four singly-charged vortices nucleated by the twisted decay of the initial quadruply charged vortex.
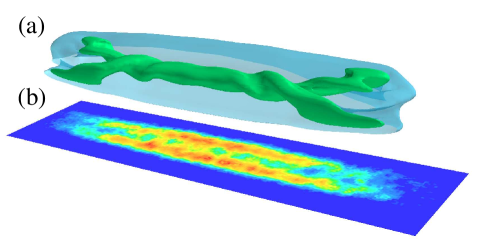

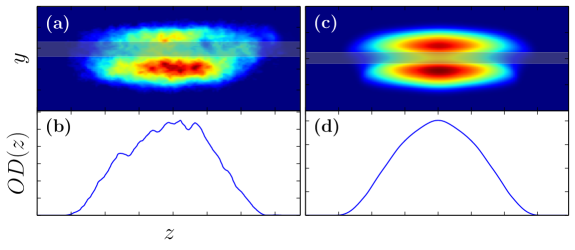
Fig. 2 (a and b) show the computed 3D isodensity surface (2a) on top of its corresponding experimental absorption image (2b), respectively. Note how the vortex lines appear intertwined, in the form of helical Kelvin waves along the -axis, as predicted Mottonen2003 ; Huhtamaki2006b ; Mateo2006 . We interpret the central region of Fig. 2b, containing a nearly regular density modulation along the symmetry axis, as a signature of the presence of Kelvin waves. Fig. 2 (c and d) are shown, allowing for a direct comparison of the similar features appearing on the experimental (Fig. 2c) and the numerical (Fig. 2d) column density images. Moreover, we present experimental (Fig. 2e) and numerical (Fig. 2f) optical density profiles, OD(z), directly extracted from the central (shaded) regions of Figs. 2c and 2d, along the -axis. The regular oscillations observed near the center on the OD(z) profile demonstrate that the density modulations are due to the presence of Kelvin waves, clearly visible in the numerical 3D isosurface (Fig. 2a). Likewise, the observation of Kelvin waves reported by Ref. Bretin03 was supported by similar evidence. Without Kelvin waves, the central regions of the 2D column density images would be smooth, and the 1D OD(z) profiles would not present the oscillations shown in Figs. 2(e and f), as demostrated in Fig. 3 of the Supp. Mat. Supp3 .
The shape of the vortex lines resulting from the decay of multi-charged vortices depends on where and when the decay starts. They may appear as straight vortex lines or intertwined, as here reported, depending on the perturbation’s symmetry and the local density homogeneity. If the perturbation is mostly constant, along , and the density does not vary much in the -direction, every point on the vortex unwinds at the same rate, and singly-charged vortex straight lines are expected to emerge. However, if the density changes significantly along , the unwinding takes place at different times and at different positions, inducing the intertwining, as discussed by Huhtamaki2006b .
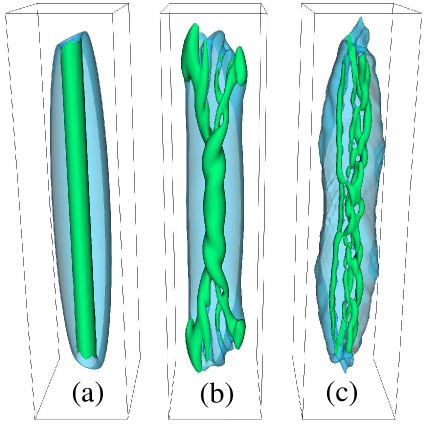
The complete time sequence of the twisted vortex decay is revealed by the numerical simulations, as shown in the movie SuppMovie . Fig. (3) presents the three key features (the multi-charged vortex, the twisted unwinding, the four singly-charged vortices) observed during the intertwined decay at different stages. It is worth comparing this effect, in which helical Kelvin waves arise from the interaction of parallel vortices in a confined geometry, with the Crow instability Simula2011 , which generates Kelvin waves on anti-parallel vortices. Individual helical Kelvin waves have been recently observed in superfluid helium following a vortex reconnection Fonda2014 , whereas in our case, the waves arise from the decay of multiply charged vortices, as predicted by Mottonen2003 ; Mateo2006 .
Numerical experiments suggest that the decay start of the multi-charged vortex can be sped up. Imposing random fluctuations ( of ) to the initial vortex wave function does not significantly change the decay time scale, probably because the symmetry of the initial condition is not completely broken. A small displacement of the vortex core axis () is more efficient, triggering the onset of the twisted unwinding in about 12 ms; a larger displacement () reduces this time to 10 ms. A few other methods were investigated, and the most efficient method found was to gently squeeze the harmonic potential in the direction by an amount , when preparing the initial state in imaginary time, then resetting while propagating the GPE in real time; this triggers the onset of decay in 5 ms. Experimentally, we found it difficult to control perturbations well enough to reproducibly determine the time scale of decay. It was observed that, once in inverted bias field configuration, the small instabilities existing on the current controller were sufficient to trigger in just 5 ms, which also corresponds to the hold time used for taking the data presented.
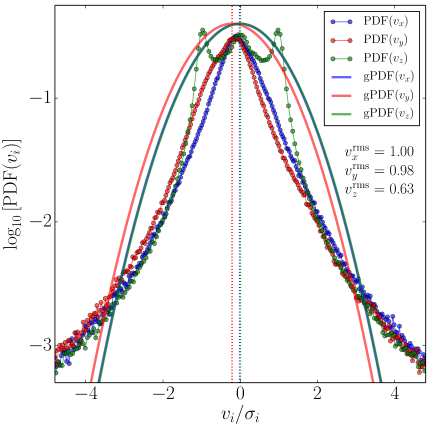
As a final remark, it is worth mentioning that the observed twisted decay of multi-charged vortices may be exploited to induce quantum turbulence. The existing methods used to generate turbulence (rotations Kobayashi2007 , trap oscillations Henn2009 , moving obstacle Raman2001 ; Neely2010 ; White2012 ; Kwon2014 ; Stagg2015 ; White2014 ; Allen2014b ; Cidrim2016 , and imprinting staggered vortices White2010 ) tend to significantly perturb or even fragmentParker2005 the condensate. This complicates detecting the vortices position and counting their number, which affects the vortex line density estimation. Here we numerically imprint two antiparallel doubly quantized () vortices in the plane. The vortices unwind and twist, moving slightly forward due to their self-induced velocity, then the helical waves travelling in opposite directions reconnect, generating a turbulent tangle with only moderate density oscillations Supp4 . We find that the condensate’s velocity field, initially anisotropic ( and ), becomes almost isotropic in the turbulent stage ( and ), displaying velocity PDFs with the typical power-law scaling at high velocity (see Fig. 4) observed in superfluid helium Paoletti2008 and in larger, initially isotropic condensates White2010 (whereas in ordinary turbulence such PDFs are Gaussian).
In conclusion, by carefully comparing experimental and numerical results, we have demonstrated that the decay of multiply charged vortices, topologically imprinted in trapped atomic BECs, generate intertwined Kelvin waves which twist and split into singly-charged vortices. Numerical experiments suggest that the onset of the decay is sensitive to small perturbations. We have also shown that the twisted decay can be used to generate isotropic turbulence, relatively free from large scale fluctuations or fragmentation of the condensate, hence suitable for comparison with superfluid helium turbulence. Finally, an interesting follow-up study would be to assess how the proximity of the BEC edge and the presence of the thermal cloud would affect the Kelvin waves Rooney2011 .
Acknowledgements.
We acknowledge financial support from FAPESP (program CEPID), CNPq (program INCT) and EPSRC. G.D.T and P.E.S.T thank G. Roati for technical support during the initial experiment runs. V.S.B thanks E.A.L. Henn for the experimental support.References
- (1) M.S. Paoletti, M.E. Fisher, K.R. Sreenivasan, and D.P. Lathrop, Phys. Rev. Lett. 101, 154501 (2008).
- (2) A.C. White, C.F. Barenghi, N.P. Proukakis, A.J. Youd and D.H. Wacks, Phys. Rev. Lett. 104, 075301 (2010).
- (3) C.F. Barenghi, V.S. L’vov, and P.E. Roche, Proc. Nat. Acad. Sci. USA 111, Suppl. 1, 4683 (2014).
- (4) U. Frish, Turbulence: the legacy of A. N. Kolmogorov, Cambridge U. Press (1995).
- (5) R. Hänninen and A.W. Baggaley, Proc. Nat. Acad. Sci. USA 111, Suppl. 1, 4667 (2014).
- (6) M.C. Tsatsos, P.E.S. Tavares, A.R. Fritsch, A. Cidrim, M.A. Caracanhas, F.E.A. dos Santos, C.F. Barenghi, V.S. Bagnato, Physics Reports 622, 1 (2016).
- (7) T. Aioi, T. Kadokura, T. Kishimoto, and H. Saito, Phys. Rev. X 1, 021003 (2011).
- (8) M.C. Davis, R. Carretero-Gonzalez, Z. Shi, K.J.H. Law, P.G. Kevrekidis, and B.P. Anderson, Phys. Rev. A, 80, 023604 (2009).
- (9) K.W. Madison, F. Chevy, W. Wohlleben, and J. Dalibard, Phys. Rev. Lett. 84, 806 (2000).
- (10) C. Raman, J.R. Abo-Shaeer, J.R. Vogels, K. Xu, and W. Ketterle, Phys. Rev. Lett. 87, 210402 (2001).
- (11) D.V. Freilich, D.M. Bianchi, A.M. Kaufman, T.K. Langin, and D.S. Hall, Science 329, 1182 (2010).
- (12) Y. Shin, M. Saba, M. Vengalattore, T.A. Pasquini, C. Sanner, A.E. Leanhardt, M. Prentiss, D. E. Pritchard, and W. Ketterle, Phys. Rev. Lett. 93, 160406 (2004).
- (13) M. Kumakura, T. Hirotani, M. Okano, Y. Takahashi, and T. Yabuzaki, Phys. Rev. A 73, 063605 (2006).
- (14) M. Okano, H. Yasuda, K. Kasa, M. Kumakura and Y. Takahashi, J. Low Temp. Phys. 148, 447 (2006).
- (15) T. Isoshima, M. Okano, H. Yasuda, K. Kasa, J.A.M. Huhtamäki, M. Kumakura and Y. Takahashi, Phys. Rev. Lett. 99, 200403 (2007).
- (16) R.J. Donnelly, Quantized Vortices In Helium II, Cambridge University Press, Cambridge, UK (1991).
- (17) H. Pu, C.K. Law, J.H. Eberly and N.P. Bigelow, Phys. Rev. A 59, 1533 (1999).
- (18) M. Möttönen, T. Mizushima, T. Isoshima, M.M. Salomaa, and K. Machida, Phys. Rev. A 68 023611 (2003).
- (19) J.A.M. Huhtamäki, M. Möttönen, and S.M.M. Virtanen, Phys. Rev. A 74, 063619 (2006).
- (20) J.A.M. Huhtamäki, M. Möttönen, T. Isoshima, V. Pietilä and S.M.M. Virtanen, Phys. Rev. Lett. 97, 110406 (2006).
- (21) A.M. Mateo, and V. Delgado, Phys. Rev. Lett. 97, 180409 (2006).
- (22) T. Kuwamoto, H. Usuda, S. Tojo, T. Hirano, J. Phys. Soc. Jpn. 79, 034004 (2010)
- (23) P. Kuopanportti and M. Möttönen, Phys. Rev. A 81, 033627 (2010).
- (24) M. Nakahara, T. Isoshima, K.e Machida, S. Ogawa, and T. Ohmi, Physica B 284, 17 (2000).
- (25) A.E. Leanhardt, A. Görlitz, A.P. Chikkatur, D. Kielpinski, Y. Shin, D.E. Pritchard, and W. Ketterle, Phys. Rev. Lett. 89 190403 (2002).
- (26) Y. Kawaguchi, T. Ohmi, Phys. Rev. A 70, 043610 (2004)
- (27) C.F. Barenghi, L. Skrbek and K.R. Sreenivasan, Introduction to quantum turbulence, Proc. Nat. Acad. Sci. USA 111, Suppl. 1, 4647 (2014).
- (28) V. Bretin, P. Rosenbusch, F. Chevy, G.V. Shlyapnikov, and J. Dalibard, Phys. Rev. Lett. 90, 100403 (2003).
- (29) N. Smith, W.H. Heathcote, J.M. Krueger, and C.J. Foot, Phys. Rev. Lett. 93, 080406 (2004)
- (30) The schematic imprinting process is shown in Fig. 1 of the Supp. Mat. at [URL will be inserted by the publisher].
- (31) L.P. Pitaevskii and S. Stringari, Bose–Einstein Condensation, Oxford University Press (2003).
- (32) G. R. Dennis and Joseph J. Hope, and M. T. Johnsson, Comput. Phys. Commun. 184, 201-208 (2013).
- (33) Examples of optical density profiles used for data analysis are shown in Fig. 2 of the Supp. Mat. at [URL will be inserted by the publisher].
- (34) The 1D optical density profile of the condensate taken before the decay of the multi-charged vortex are shown in Fig. 3 of the Supp. Mat. at [URL will be inserted by the publisher].
- (35) See supplemental material at [URL will be inserted by the publisher] for a numerical movie of real time evolution dynamics of the decay of an multi-charged vortex.
- (36) T.P. Simula, Phys. Rev. A 84, 021603(R) (2011).
- (37) E. Fonda, D.P. Meichle, N.T. Ouellette, S. Ormoz, and D.P. Lathrop, Proc. Nat. Acad. Sci. USA 111, Suppl. 1, 4707 (2014).
- (38) M. Kobayashi and M. Tsubota, Phys. Rev. A 76, 045603 (2007).
- (39) E.A.L. Henn, J.A. Seman, G. Roati, K.M. F. Magalhaes, and V.S. Bagnato, Phys. Rev. Lett. 103, 045301 (2009).
- (40) T.W. Neely, E.C. Samson, A.S. Bradley, M.J. Davis, and B.P. Anderson, Phys. Rev. Lett. 104, 160401 (2010).
- (41) A.C. White, C.F. Barenghi and N.P. Proukakis, Phys. Rev. A 86, 013635 (2012).
- (42) W.J. Kwon, G. Moon, J.Y. Choi, S.W. Seo, and Y. Shin, Phys. Rev. A 90, 063627 (2014).
- (43) G.W. Stagg, A.J. Allen, N.G. Parker, and C.F. Barenghi, Phys. Rev. A 91, 013612 (2015).
- (44) A.C. White, N.P. Proukakis, and C.F. Barenghi, J. Physics C Conf. Series 544, 012021 (2014).
- (45) A.J. Allen, N.G. Parker, N.P. Proukakis, and C.F. Barenghi, Phys. Rev. A 89, 025602 (2014).
- (46) A. Cidrim, F. E. A. dos Santos, L. Galantucci, V. S. Bagnato, and C. F. Barenghi Phys. Rev. A 93, 033651 (2016).
- (47) N.G. Parker and C.S. Adams, Phys. Rev. Lett. 95, 145301 (2005).
- (48) See Fig. 4 of the Supp. Mat. at [URL will be inserted by the publisher].
- (49) S.J. Rooney, P.B. Blakie, B.P. Anderson, and A.S. Bradley, Phys. Rev. A 84, 023637 (2011).
SUPPLEMENTARY MATERIAL
1. Topological phase imprinting
The multi-charged vortices are nucleated by adiabatically reducing and inverting the initial trap bias field from down to . The resulting magnetic field along the weak trap direction, , axis is reversed during the process. Fig. 5 presents the general idea with the main details. During this adiabatic reversal process, the atomic spins are forced to follow the rotation taking place in the local field directions. The magnetic field reversal rate is slow enough () so that almost all the atomic spins adiabatically follow the magnetic field directions, under our typical experimental conditions. Also, since the direction of the rotation depends on the spatial position of each atom, the atom acquires a different topological phase depending on its position. The spin reversal results in the phase winding in the condensate order parameter with per atom, corresponding to a charge vortex imprinted on the BEC. Finally, this process works well though it induces significant loss of atoms () during the zero crossing, due to the Majorana flips, which is consistent with previous studies..
2. Profiles of multi- and singly-charged vortices
In Fig. 6, typical optical density 1D profiles, OD(z), are presented. On the left, in Fig. 6(a), a multi-charged vortex with its large central depletion is shown; and, on the right, the four singly charged vortices resulting from its decay Fig. 6(b) are presented.

3. Profile of a vortex without Kelvin waves
Fig. 7 shows the smooth experimental (b) and numerical (d) 1D OZ(z) profiles of the central region of the condensate along the z-axis for a vortex without Kelvin waves, corresponding to experimental (a) and numerical (b) false-color absorption images. These smooth profiles must be compared to the oscillating profiles for a vortex with Kelvin waves shown in Fig. 2(c,d,e,f) of the article.
4. Generation of quantum turbulence
To exploit the twisted unwinding of the multi-charged vortices as a technique to generate vortex tangles, relatively free of large density modulation, we numerically imprinted two anti-parallel, doubly quantized vortices, using the parameters listed below, at the initial condition, see Fig.8(a). The vortices unwind, twist, move slightly forward due to the self-induced velocity field, and reconnect (Fig.8(b)), generating a turbulent tangle, see Fig.8(c).
Initial condition: a doubly quantized () vortex is imprinted in the xy plane at , and a double quantized antivortex is imprinted at . All parameters as in the numerical simulation described in the article.
Velocity statistics in the turbulent state: the PDFs of the velocity components are ( with , , . The normalized mean values of the Gaussian fits (i.e., mean values , divided by their corresponding Gaussian widths) are marked as vertical dashed lines in Fig. 4. and are respectively given by , with associated widths and (for ).
