Observation of Rapid Change of Crystalline Structure during the Phase Transition of the Palladium-Hydrogen System
Abstract
We performed an X-ray diffraction experiment while palladium bulk absorbed and desorbed hydrogen to investigate the behavior of the crystalline lattice during the phase transition between the phase and phase. Fast growth of phase was observed around and of PdHx. In addition, slight compression of the lattice at high hydrogen concentration and increase in the lattice constant and the line width of the phase after a cycle of absorption and desorption of hydrogen was observed. These behavior correlated with the change in the sample length, which may infer that the change in shape was related to the phase transition.
pacs:
61.50.Ks,64.70.K-,64.70.kd, 81.05.BxI Introduction
Palladium is known as a metal that absorbs large amount of hydrogen. This property opened its applications to storage and filter of hydrogen, and intense research on this property has been performed Lewis (1967); Flanagan and Oates (1991). The large amount of hydrogen absorption is related to two phases of the palladium-hydrogen (Pd-H) system, one called phase and the other called phase. The phase has smaller hydrogen fraction , and it includes pure palladium. The phase contains more hydrogen atoms. When palladium metal is exposed to hydrogen gas, typically at high temperature such as 100 ∘C or more, palladium absorbs hydrogen. The absorption induces phase transition from phase to phase through phase, where the phase and the phase coexist, as the phase diagram Knapton (1977); Wicke and Brodowsky (1978); Kawasaki et al. (2012) shows.
This phase transition from the phase to the phase is believed to be the cause of deformation of a palladium bulk reported in Refs. Krause and Kahlenberg (1935); Hunter (1960); Kufudakis and Cermak (1982); Kotelva and Glukhova (1997); Xu and Mclellan (1998); Y. Jung and Sakai (2000); Jung and Sakai (2001); Yamazaki et al. (2009); Kawasaki et al. (2012). These changes in the shape significantly larger than the ordinary plastic deformation are explained as a phenomenon connected to a phase transition, sometimes with a relation to superplasticity. We previously found a change in the shape of palladium metal in the direction of minimizing its surface area Yamazaki et al. (2009), and subsequently we observed large bending of a horizontal palladium plate with only a small external force, and warping back and forth of vertical palladium plate Kawasaki et al. (2012). However, it is not clear why the change in the shape of the bulk happened so as to minimize its surface area and why the palladium plate warped back and forth.
In this paper, we report an X-ray diffraction experiment at a synchrotron radiation facility SPring-8 to obtain microscopic information of the Pd-H system during the phase transition. We took X-ray diffraction spectra while a palladium bulk absorbed and desorbed hydrogen gas with the information on the length of the sample. The analysis was performed to get microscopic information, such as lattice constant, crystal grain size, and the intensity of the diffraction from the two phases, against the time and the hydrogen fraction , in order for us to obtain microscopic understanding of the change in the shape of the palladium bulk during the treatment with hydrogen.
Microscopic study of the Pd-H system has long been performed Owen and Jones (1937); Flanagan and Oates (1991); Aben and Burgers (1962); Sakamoto et al. (1982). Initially, X-ray diffraction study was performed in the static states. The lattice constants of the phase and the phase are measured as Å and Å Flanagan and Oates (1991) by the standard X-ray diffraction technique after putting the sample back to the room temperature. The figures in Ref. Aben and Burgers (1962) was obtained by placing X-ray diffraction pictures of different samples with different hydrogen fraction together. The dynamic observation of the phase transition has also been performed Li et al. (2014); Nandi et al. (1981); Vogel et al. (2010); Canton et al. (2001). Most of them use the information of a single peak to estimate the amount of one phase in the bulk. Lattice constant information on these reports is simply plotted against temperature or pressure of hydrogen, and time dependent analysis was not performed. In addition, most of the reports are for nano particle of palladium Nandi et al. (1981); Vogel et al. (2010); Canton et al. (2001), and the time dependent microscopic study of the palladium bulk is lacking. Our report fills this blank and connects the relation between the macroscopic behavior and the microscopic parameter.
II Experimental Method
II.1 Experiment setup
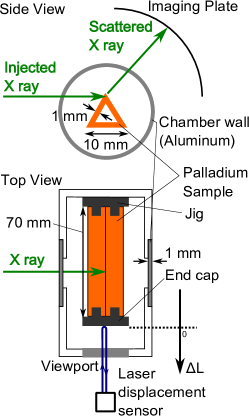
The X-ray diffraction experiment was performed at RIKEN Materials Science beamline BL44B2 of SPring-8. The X-ray energy was 20 keV with the energy resolution of . The photon flux was s-1 and the beam size was 0.5 mm (vertical) 3.0 mm (horizontal). The palladium sample was 70 mm tall, 1 mm thick hollow equilateral triangular tube with 10 mm wide outer side. This shape ensured high mechanical strength to prevent the sample from bending. The top corner of the sample was aligned to the path of incident X-ray beam.
The palladium sample was put into a vacuum chamber with one end fixed onto the chamber. The other end was free and with a flat end cap, being enabled to change the length. The sample length change was measured with a laser displacement sensor through a viewport. The chamber was made of stainless steel, except for the path for the X-ray made of 1 mm thick aluminum. The chamber was connected to a pumping system consisting of a turbo molecular pump and a rotary pump. The whole chamber was wrapped with heating tapes to heat the sample up to 120 ∘C.
Prior to the start of the experiment, the chamber was evacuated out to below Pa. Hydrogen gas was introduced through a flow meter, the start of which is defined as . At first, the introduction was at a maximum rate of 40 ml/min, and once the pressure reached 0.2 MPa, the flow rate was reduced in order to keep the pressure around 0.2 MPa, as shown in Fig. 5 (e). After the saturation of the pressure and , by which we regarded the phase transition as finished, we pumped the hydrogen out through the pumping system. We finished the evacuation when the decrease in pressure accelerated, which is the sign of the complete outgassing of hydrogen. We introduced hydrogen again to see the behavior at the beginning of the second cycle of absorption/desorption of hydrogen. Throughout the experiment, we recorded the pressure and the temperature of the chamber and .
The scattered X-ray was recorded with an imaging plate covering the diffraction angle of . One imaging plate recorded data of 18 different exposures and therefore one set of measurements consisted of 18 data. Each exposure was for 30 seconds. We started the first exposure of the first set right after we started to introduce hydrogen.
II.2 Characteristics of the setup
Although the result and its interpretation are described assuming the sample was in the ideal condition for the powder X-ray diffraction, we have to consider the difference between the ideal condition and our system. First, palladium sample was large and certain amount of the X-ray was absorbed by the sample. Second, the number of crystal grains might be small and their orientation might not be random. Third, the sample might not have been uniform, as it takes certain amount of time for hydrogen to diffuse into the depth of the palladium.
The Attenuation coefficient of the palladium is 207.9 cm-1 for 20 keV X-ray. This means that the X-ray passing through 0.1 mm bulk is attenuated to 13% of the incoming flux. Thus, we basically looked at the phase transition of the thin surface layer whose thickness is at most 0.1 mm. As the X-ray hit the top point of the triangular cross section of the sample, we can assume that the reasonable amount of the diffracted light is transmitted for all the diffraction angles.
The volume we observed is roughly 0.5 mm 3 mm 0.1 mm, whereas the grain size of palladium is 10-100 m in Fig. 7. It is therefore possible that the number of grains is too small for the diffraction pattern to have circular symmetry. This can cause the suppression of the signal from certain crystal planes.
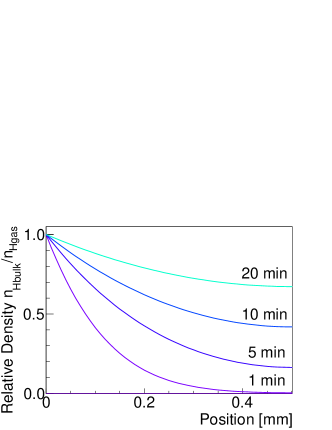
Given that we looked at the thin surface layer, the diffusion would not take that long time. Fig. 2 shows the numerical calculation of the absorption of hydrogen by 1 mm thick palladium plate when the density of the hydrogen gas linearly increased, with the diffusion coefficient of for hydrogen in palladium at 120 ∘C. Although it took certain amount of time for hydrogen to reach the center of the sample, the 0.1 mm thick surface layer got the amount of hydrogen comparable to the very surface in short time; in 1 minutes, the density becomes 40% of the outermost area and after 20 minutes, the density is 90% of the surface one. Thus, except for the first few minutes, hydrogen density can be assumed to be roughly uniform.
III Results
Figure 3 shows diffraction spectra at five representative moments during the experiment. Some conspicuous diffraction lines before the absorption of hydrogen got weaker during the absorption, and disappeared after the absorption. When palladium desorbed hydrogen, these peaks reappeared roughly at the same . During the absorption, new diffraction lines appeared at slightly smaller , which corresponds to the lattice constant larger than the vanishing diffraction lines. These new lines disappeared during the desorption. Based on the observation, we identified the phase and the crystal plane for the diffraction lines. The intense diffraction lines at the beginning were identified as phase lines, as the sample was annealed before the experiment to outgas hydrogen. The new lines appearing during the absorption were identified as phase lines because these had slightly larger lattice constant than , which matched with the previously reported ratio of and in Ref. Flanagan and Oates (1991) (subscription and show parameters for the and the phase, respectively). In addition, the difference between and was significantly larger than the fluctuation of and during the absorption and the desorption of hydrogen. Diffraction lines without any significant change over the experiment were regarded to be the background originated from other materials on the path of X-ray, such as the aluminum chamber wall and resistive material in the heating tape. These lines were used to remove systematic errors of the diffraction angles.
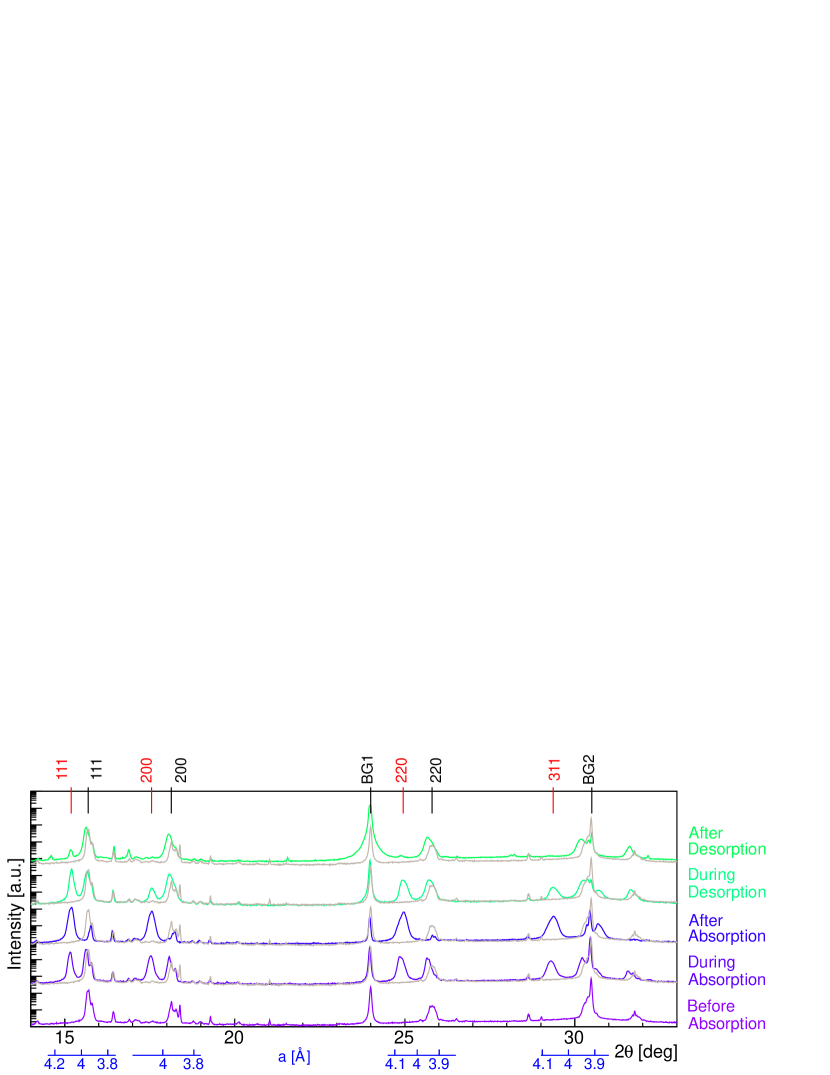
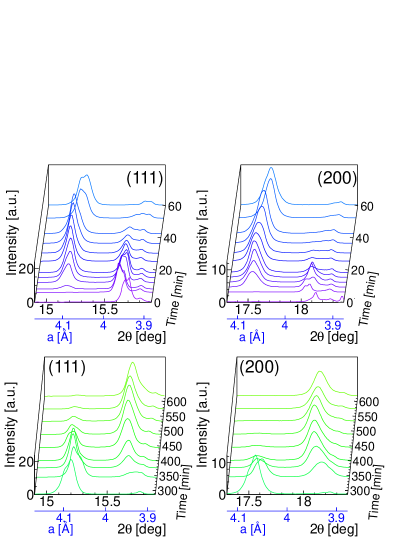
Figure 4 is magnified plots of the time dependent behavior of the diffraction lines from the (111) and (200) planes. The top half shows the first 60 minutes of the absorption stage. The initially intense phase diffraction lines gradually disappeared over an hour and phase diffraction lines grew up rapidly at significantly smaller after several minutes. It is notable that most of the growth of the phase diffraction lines finished in several minutes. The bottom half of Fig. 4 shows the behavior during the desorption stage. The phase diffraction lines gradually disappeared and the phase diffraction lines grew up. The diffraction line angle changed as time evolved. Changes were slower during the desorption stage than that during the absorption stage, but they had a common behavior that the growing peaks grew up smoothly, whereas the disappearing peaks had fluctuation in their position and the intensity during its fast vanish.
For a close look at the time dependent behavior of the diffraction line parameters, we fitted each diffraction line with a Gaussian plus a linear background function, obtaining the center of the diffraction line and , the diffraction line width and as the full width at half maximum (FWHM) and the diffraction line intensity and as the area of the Gaussian. If two or more diffraction lines were close to each other, the fitting function contained multiple Gaussian functions. Among these data, the (111) diffraction line is plotted in Fig. 5 as the representative. Fig. 5 (a) shows and calculated from and . A systematic error of and presumably due to the slight fluctuation of the position of the whole chamber against the beam and the imaging plate was removed by adding a correction so as to keep the diffraction angle of BG1 line in Fig. 3 constant at the average value over all the data points. Fig. 5 (b) shows and in the unit of angle. Fig. 5 (c) displays and . A systematic fluctuation of and was removed by a compensation factor that made an average of over the five last sets of absorption stage constant.
is plotted in Fig. 5 (d). The temperature of the sample, pressure inside the chamber and the hydrogen flow rate are plotted in Fig. 5 (d) and (e).
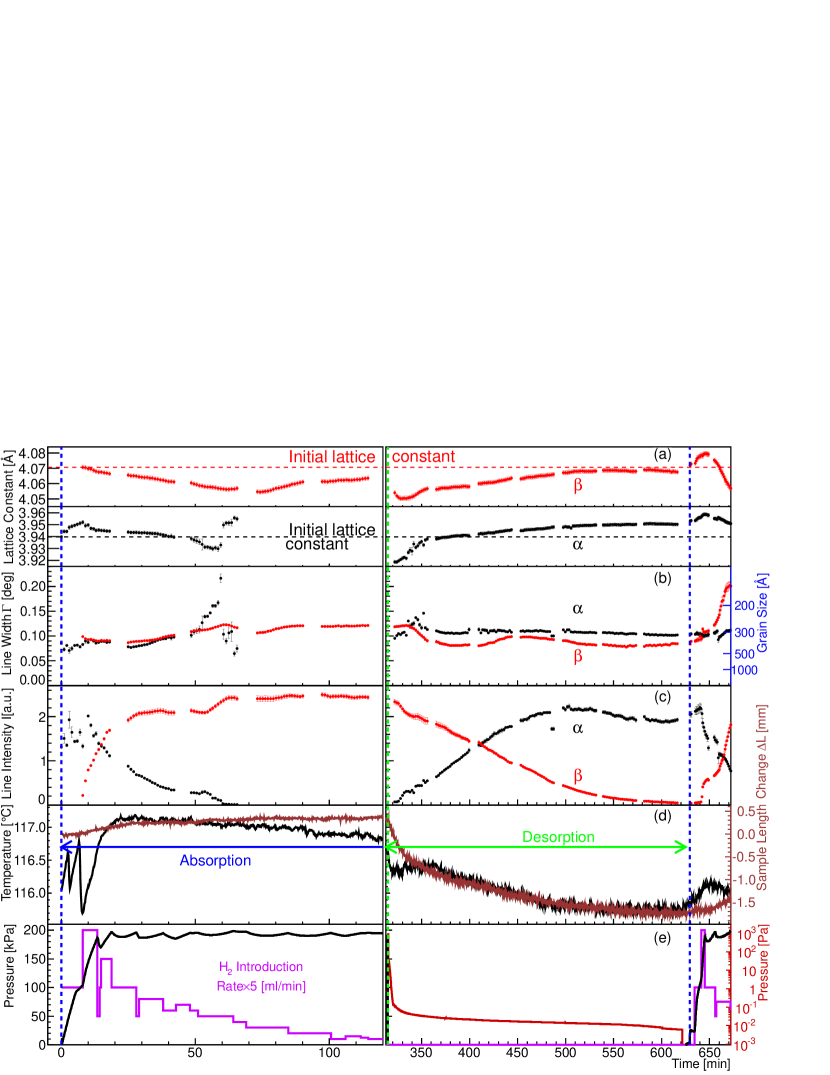
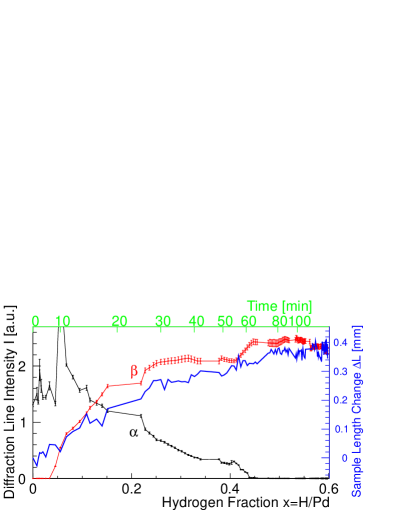
Figure 6 shows and of (111) line against the hydrogen fraction , together with . The was calculated from the chamber volume, the hydrogen flow rate and the pressure.
IV Discussion
IV.1 Lattice constant and
and based on the spectrum before and after the absorption in Fig. 3 are summarized in Table 1. Our result gave larger number than Ref. Flanagan and Oates (1991). Part of the reason of the difference is the thermal expansion of the lattice. The thermal expansion coefficient for pure palladium, K-1 at 293 K, and 95 K temperature difference (Ref. Flanagan and Oates (1991): 25 ∘C, us: 120 ∘C) gives 0.004 Å expansion of the lattice. However, this still leaves discrepancy significantly larger than the statistical fluctuation, particularly for . The remaining difference should be explained by the different condition to prepare the sample, as the difference is in the order of magnitude same as the fluctuation of and shown in Fig. 5.
| Phase | This result | Ref. Flanagan and Oates (1991) | Difference | TE | ||||||
|---|---|---|---|---|---|---|---|---|---|---|
| 3.928 | 3.894 | 0.034 | 0.004 | |||||||
| 4.054 | 4.040 | 0.014 | 0.004 | |||||||
The time dependent behavior of and of the (111) diffraction line is shown in Fig. 5 (a). Notable features for are (i) its initial increase, (ii) smaller than the initial value when the phase appeared again at the desorption stage, and (iii) the increase of at the end of the desorption. The first feature should be simply due to the hydrogen’s occupying interstitial space among palladium atoms to expand the palladium lattice.
was 0.6% smaller than the initial valuewhen it appeared again during the desorption. This is significantly larger than the uncertaintiy of the center position, and is possibly due to the compression by the phase. Because the sample length increased by only 0.6% even when the sample completely turned into phase that has 3% larger lattice constant than phase, the crystal grain experienced the huge internal stressDelmelle and Proost (2011), and it is possible that the pressure compressed phase lattice. The fact that the rapid growth of the started at the same time as the start of the decrease in during absorptionstarted also supports the idea of the compression by the phase.
increased by 0.3% after a cycle of the absorption and the desorption of the hydrogen, which is significantly larger than the uncertainty of the center position. This means that there is an irreversible effect of hydrogen treatment on palladium bulk. The behavior of in the second cycle quite similar to the first absorption stage suggests that the value at the end of the desorption stage should be regarded as the value for the pure palladium, not the value with slight amount of hydrogen remaining in the bulk. Irreversible changes were also reported previously, such as the change in the shape and the degradation of metallic luster Yamazaki et al. (2009). The observation in this experiment revealed that such a change also happened in microscopic scale. Note that the behavior is quite similar for in the desorption stage, but went back to its initial value.
The change of is large enough to be observed in Fig. 4, and detailed time dependent behavior of is shown in Fig. 5 (a). It had a local minimum during the phase transition, when min, which corresponds to the hydrogen fraction in Fig. 6. These were 0.2% jump, and possible explanation is the growth of phase first compressed its lattice and then the lattice gradually expanded. The expansion was not all the way back to the initial number. This observation is quite different from the report in Ref. Aben and Burgers (1962), where increased as the hydrogen fraction increased. The difference should be due to the experimental condition, particularly if the X-ray diffraction is done during the phase transition or not.
IV.2 Line Width and
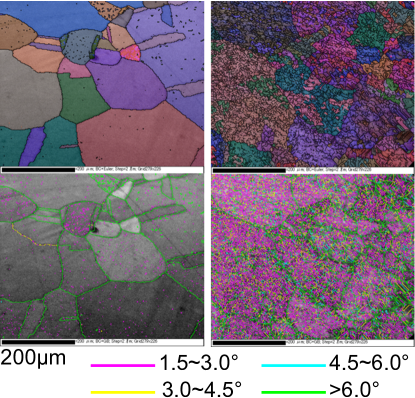
, and the crystal grain size derived from Scherrer formula are summarized in Table 2. The trend was that the grain size got smaller as the absorption and the desorption proceeded. The actual grain size in Fig. 7 is 10-100 m, which is larger than the coherence length of the X-ray, 1000Å. It is likely that the defect or the disorder in the single crystal grain decreased the effective grain size.
| Phase | Line width [deg] | Crystal Size [Å] | ||||||
|---|---|---|---|---|---|---|---|---|
| , before | 0.062 | 0.027 | 184 | 91 | ||||
| 0.237 | 0.041 | 108 | 14 | |||||
| , after | 0.217 | 0.080 | 77 | 19 | ||||
The change of and over time shown in Fig. 5 (b) tells how the reduction of the grain size happened. The increased by 27% from the beginning after a cycle of absorption and desorption, which was the same trend as the number in Table 2. The increase started before the phase line disappeared. The was approximately the same as both when the phase disappeared, and when the phase reappeared. Once phase reappeared, was more or less constant. This means that most increase in occurred during the absorption. changed both during the absorption and the desorption, with a local maximum at min for absorption stage and min for desorption stage, though they are not very significant.
This increase in is consistent with the observation of crystal orientation with the scanning electron microscope electron backscatter patterns (SEM-EBSP) in Fig. 7. The palladium metal that went through a cycle of absorption and desorption of hydrogen gas had much more small angle tilt grain boundary, between and , compared to the annealed palladium sample, whereas the size of the grain was roughly the same if the grain boundary is defined with tilt angle larger than . The effective decrease of the grain size observed in the X-ray diffraction was due to the formation of small angle tilt grain boundary. This tilt is likely to be formed when the phase turned into the phase during the absorption.
IV.3 Diffraction Line Intensity and
Time dependent behavior of and of the (111) diffraction line is shown in Fig. 5 (c). The phase diffraction line appeared at 8 minutes after the start of the absorption, and two thirds of the change was completed in the first 18 minutes. During this time range, hydrogen fraction changed from 0.03 to 0.15 as shown in Fig. 6. This was close to that of when the sudden change in the palladium shape occurred in Ref. Kawasaki et al. (2012). It is inferred that the sudden change in the shape was induced by the appearance of phase. There was another quick increase of around min. This corresponds to the hydrogen fraction between and . This jump between and also existed in the desorption side, as the right half of Fig. 5 shows.
The disappearance of the phase line slowed down as time went by, but the last moment of the disappearance around min was faster than the earlier part. This jump to happened at the same time as the second jump in the . Also, the fast change in and around coincided with the local minimum for on both the absorption and the desorption stage and the local maximum of . This whole behavior corresponds to the point of phase transition from the phase to phase. Combined with the appearance of phase line, for phase should be .
The growth of one phase is faster than the disappearance of the other phase both in the absorption and in the desorption stage. This breaks the conservation of , which should hold if the amount of the material that scatters the X-ray is constant. In our observation, had % fluctuation. It is possibly due to the imperfect randomness of the crystal orientation that resulted in the different amount X-ray scattered by the phase and the phase.
Most phase diffraction lines totally disappeared when the desorption was completed. This ensures that all the sample went back to phase and the pumping was long enough to evacuate all hydrogen.
IV.4 Sample length change
is plotted in Fig. 5 (d) and Fig. 6. The sample expanded by 0.6 % when it absorbed hydrogen up to PdH0.6 and then shrank more than its original length by -2.5% when hydrogen was released completely. This was roughly consistent with Ref. Yamazaki et al. (2009). The behavior of was quite similar to that of , especially in the desorption stage. Also, the slight change and coincided with the behavior of , particularly in the desorption stage. These implies the sample length change was related to the phase transition.
V Conclusion and Outlook
To conclude, we performed the in-situ X-ray diffraction experiment during the phase transition in Pd-H system. The fast growth of and gradual decrease in were observed during the absorption of hydrogen. and got smaller as hydrogen concentration got higher with an initial increase in before phase appeared. This suggests the compression of the lattice by the phase. The small angle tilt inside the cyristal grain grew after a cycle of hydrogen absorption and desorption, resulting in the increase of . The coincidence of the behavior in the angle , , , and implied that the change in the shape was due to the phase transition.
The reproducibility of the behavior when we have multiple cycles of the absorption and desorption of hydrogen was not clear. The one hour of second cycle suggests that the behavior of parameters were basically the same as the first cycle. However, it is still necessary to directly show what happens when we have more than one cycle of absorption and desorption of hydrogen.
The behavior of the center of the sample also needs to be investigated. Since X-ray diffraction in principle cannot give the information of the deep inside the bulk, neutron scattering or some other method is expected to reveal how the center of the bulk changes.
The discussion is only for our observation in Pd-H system. Lots of other systems show superplasticity or similar kind of deformation over a phase transition, same as Pd-H system, but this fact is not enough to show that the microscopic behavior is universal in the phase transition of polycrystalline materials. In order to show the universality, one has to do the same experiment for different materials.
Acknowledgements.
This research is supported by the Strategic Program for R&D of RIKEN. The synchrotron radiation experiment were performed at BL44B2 in SPring-8 with the approval of RIKEN (Proposal No. 20100100), and the use of RIKEN beamline at SPring-8 was supported by RIKEN SPring-8 Center. We would like to thank Dr. M. Sato for writing data acquisition. We are grateful to Dr. Nishimura with insightful discussion and Prof. M. Iwasaki and Prof. R. S. Hayano for the stimulating support.References
- Lewis (1967) F. A. Lewis, The Palladium Hydrogen System (Academic Press, New York, 1967).
- Flanagan and Oates (1991) T. B. Flanagan and W. A. Oates, Annu. Rev.Mater. Sci. 21, 269 (1991).
- Knapton (1977) A. G. Knapton, Platin. Metals Rev. 21, 44 (1977).
- Wicke and Brodowsky (1978) E. Wicke and H. Brodowsky, in Hydrogen in Metals II, ed. G. Alefeld and J. Volkl (Springer, Berlin, 1978) p. 73.
- Kawasaki et al. (2012) A. Kawasaki, S. Itoh, K. Shima, and T. Yamazaki, Mater. Sci. Eng. A 551, 231 (2012).
- Krause and Kahlenberg (1935) W. Krause and L. Kahlenberg, Trans. Electrochem. Soc. 68, 449 (1935).
- Hunter (1960) J. B. Hunter, Platinum Met. Rev. 4, 130 (1960).
- Kufudakis and Cermak (1982) A. Kufudakis and J. Cermak, Surf. Technol. 16, 57 (1982).
- Kotelva and Glukhova (1997) R. V. Kotelva and J. L. Glukhova, Int. J. Hydrogen Energy 22, 175 (1997).
- Xu and Mclellan (1998) Z. R. Xu and R. B. Mclellan, Acta Mater. 46, 4543 (1998).
- Y. Jung and Sakai (2000) H. S. Y. Jung and Y. Sakai, J. Soc. Mater. Sci. Japan 49, 1242 (2000), in Japanese.
- Jung and Sakai (2001) Y. Jung and Y. Sakai, J. Soc. Mater. Sci. Japan 50, 999 (2001), in Japanese.
- Yamazaki et al. (2009) T. Yamazaki, M. Sato, and S. Itoh, Proc.Jpn Acad. Ser. B 85, 183 (2009).
- Owen and Jones (1937) E. A. Owen and J. I. Jones, Proc. Phys. Soc. 49, 587 (1937).
- Aben and Burgers (1962) P. C. Aben and W. G. Burgers, Trans. Faraday Soc. 58, 1989 (1962).
- Sakamoto et al. (1982) Y. Sakamoto, K. Yuwasa, and K. Hirayama, J. of the Less Common Met. 88, 115 (1982).
- Li et al. (2014) G. Li, H. Kobayashi, J. M. Taylor, R. Ikeda, Y. Kubota, K. Kato, M. Takata, T. Yamamoto, S. Toh, S. Matsumura, et al., Nature Mater. 13, 802 (2014).
- Nandi et al. (1981) R. Nandi, R. Pitchai, S. Wong, J. Cohen, R. Burwell Jr., and J. Butt, J. of Catalysis 70, 298 (1981).
- Vogel et al. (2010) W. Vogel, W. He, Q.-H. Huang, Z. Zou, X.-G. Zhang, and H. Yang, Int. J. of Hydrogen Energy 35, 8609 (2010).
- Canton et al. (2001) P. Canton, C. Meneghini, P. Riello, A. Balerna, and A. Benedetti, J. Phys. Chem. B 105, 8088 (2001).
- Delmelle and Proost (2011) R. Delmelle and J. Proost, Phys. Chem. Chem. Phys. 13, 11412 (2011).