Optical spectroscopy study of three dimensional Dirac semimetal ZrTe5
Abstract
Three dimensional (3D) topological Dirac materials are under intensive study recently. The layered compound ZrTe5 has been suggested to be one of them by transport and ARPES experiments. Here, we perform infrared reflectivity measurement to investigate the underlying physics of this material. The derived optical conductivity exhibits linear increasing with frequency below normal interband transitions, which provides the first optical spectroscopic proof of a 3D Dirac semimetal. Apart from that, the plasma edge shifts dramatically to lower energy upon temperature cooling, which might be associated with the consequence shrinking of the lattice parameters. In addition, an extremely sharp peak shows up in the frequency dependent optical conductivity, indicating the presence of a Van Hove singularity in the joint density of state.
pacs:
71.55.Ak, 78.20.-e,72.15.EbThree dimensional (3D) topological Dirac materials, such as Dirac semimetals and Weyl semimetals, have attracted tremendous attention in condensed matter physics and materials science in recent years. The 3D Dirac semimetals possess 3D Dirac nodes where the valence and conduction bands touch along certain symmetric axis. The 3D Dirac node is protected against gap formation by crystalline symmetry and can be considered as two overlapped Weyl nodes of opposite chirality Young et al. (2012); Mañes (2012). The materials are expected to host many intriguing novel phenomena and properties, such as the appearance of Fermi arcs on the surfaces Xu et al. (2015), giant diamagnetism Rober et al. (1979); Koshino and Ando (2010), and very large linear magnetoresistance Abrikosov (1998); Zhang et al. (2011). When time reversal symmetry is broken, a 3D Dirac semimetal can be driven to a Weyl semimetal. This has stimulated strong interest to explore chiral magnetic effect Fukushima et al. (2008); Son and Spivak (2013); Hosur and Qi (2014); Kharzeev (2014); Burkov (2014); Li et al. ; Zhang et al. ; Huang et al. , i. e. the charge-pumping between Weyl nodes of opposite chiralities under magnetic field, which is a macroscopic manifestation of the quantum anomaly in relativistic field theory of chiral fermions.
Only a few materials were predicted to be 3D Dirac semimetals. Among them, Na3Bi and Cd3As2 are the two best known compounds Wang et al. (2012, 2013). They were confirmed to be 3D Dirac semimetals by angle-resolved photoemission spectroscopy (ARPES) experiments Borisenko et al. (2014); Neupane et al. (2014); Liu et al. (2014a, b). Very recently, another layered compound, ZrTe5, was suggested to be also a 3D Dirac semimetal based on transport and ARPES experiments Li et al. . ZrTe5 crystallizes in the layered orthorhombic crystal structure, with prismatic ZrTe6 chains running along the crystallographic a-axis and linked along the c-axis via zigzag chains of Te atoms to form two-dimensional (2D) layers. Those layers stack along the b-axis. Most attractively, the chiral magnetic effect was clearly observed for the first time on ZrTe5 through a magneto-transport measurement Li et al. .
The 3D band dispersions in Dirac semimetals enable the bulk measurement techniques, e.g. the optical spectroscopy measurement, to provide key information about the charge properties of the materials. For any electronic material, such information is of crucial importance for understanding underlying physics. The situation would be different from the investigations on 3D topological insulators where the focus is on the non-trivial surface state. For those materials, the bulk measurement technique could hardly detect or separate the contribution from the 2D Dirac fermions of topological surface states, as a result, the experimental probes were largely limited to surface sensitive measurements like ARPES or scanning tunneling microscopy (STM).
Although a 3D Dirac semimetal could be viewed as a bulk analogue of 2D graphene in terms of band dispersions, a key difference exists in charge dynamical properties between 2D and 3D Dirac fermions. For 2D Dirac fermions like in graphene, the real part of conductivity is well known to be a frequency independent quantity Mak et al. (2008), while for 3D Dirac fermions with linear band dispersions in all three momentum directions, the real part of conductivity grows linearly with the frequency Hosur et al. (2012); Ashby and Carbotte (2014). To our knowledge, no optical spectroscopic measurement has been reported on 3D Dirac semimetals. In this work we present temperature and frequency dependent optical spectroscopy study on ZrTe5. Our study reveals several peculiar features. The density of free carriers keeps dropping with temperature decreasing and an unusual sharp peak shows up in the reflectivity and conductivity spectra in the mid-infrared region. Of most importance, the linear rising of the optical conductivity is observed in a relatively large energy scale, just as expected for a 3D Dirac semimetal.
Single crystals ZrTe5 were grown by using Te flux method. 100 grams high purity 7N (99.99999%) Te and 6N (99.9999%) Zr were loaded into 20 mm diameter double-walled quartz ampoules with 200 mm length and sealed under vacuum. The composition of the Zr-Te solution for the ZrTe5 crystal growth is Zr0.0025Te0.9975, and the largest ZrTe5 single crystals obtained are around 1 1 20 mm3. Detailed growth procedure was described elsewhere Li et al. .
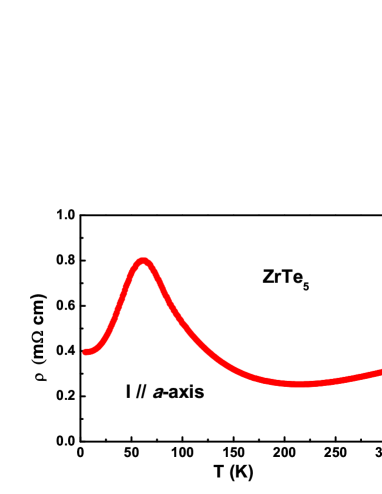
Figure 1 displays the dc resistivity in the chain direction as a function of temperature of ZrTe5. The resistivity curve shows rather unusual features. With decreasing temperature from 300 K, decreases slightly first, then increases below roughly 200 K and reaches a peak near 60 K. The overall small values of signal the (semi)metallic nature of the compound, which are in consistent with the optical measurements presented below. In earlier reports, the resistivity peak located near 150 - 170 K DiSalvo et al. (1981); Kamm et al. (1985). The much lower peak temperature could be attributed to a much lower defects in the present sample. The unusual features are likely associated with its characteristic electronic structure, which could be sensitive to the temperature-induced structural change. Earlier band structure calculations suggested presence of extremely small and light ellipsoidal Fermi surfaces, centered at the center ( point) of the bulk Brillouin zone (BBZ) Whangbo et al. (1982), and quantum oscillation measurements indicated three tiny but finite Fermi surfaces Kamm et al. (1985), with the effective mass in the chain direction (m∗a0.03me) being comparable to that in a prototypical 3D Dirac semimetal, Cd3As2 He et al. (2014). More recent ab initio calculations indicated that ZrTe5 compound locates close to the phase boundary between weak and strong topological insulators Weng et al. (2014). Nevertheless, very recent transport and ARPES experiments identify it to be a 3D Dirac semimetal Li et al. .
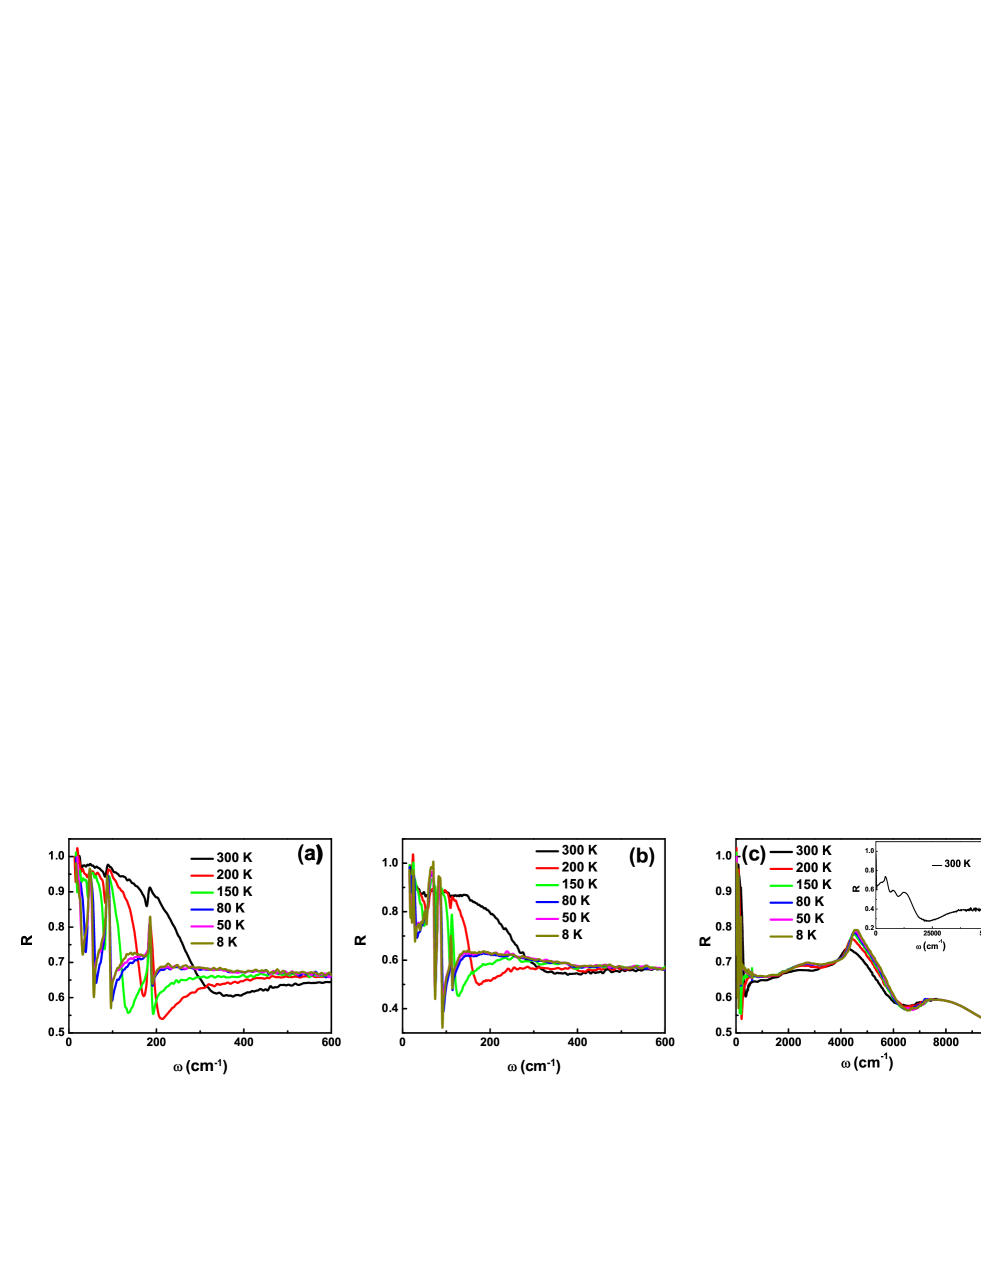
The polarized optical reflectance measurements with E//a-axis and E//c-axis were performed respectively on a combination of Bruke 113V, 80V and grating-type spectrometer in the frequency range from 30-50 000 cm-1 . The reflectivity along a- and c-axis in the far-infrared region are displayed in Fig. 2 (a) and (b), respectively. The a-axis reflectivity over broad energy scales is shown in Fig. 2 (c). There are several prominent phonon absorption features lying below 200 cm-1 , which get more pronounced upon cooling. At room temperature, the reflectivity shows a well-defined plasma edge below 350 cm-1 and approaches unity at low frequency. This indicates clearly a metallic response, which is consistent with the results of transport measurements. The edge frequency, being usually referred to as "screened" plasma frequency, is related to the density and effective mass of free carriers by . The unusual low value of this frequency suggests a very small . As the temperature decreases, the edge shifts to lower frequency, indicating a further reduction of the number of free carriers. Below 80 K, the extremely strong phonon signals tend to blur the plasma edge. In the meantime, the carrier scattering rate is also reduced as the reflectance edge gets steeper. The combination of the two effects is likely the driving force of the broad peak appeared at 60 K in . Furthermore, the rapid reduction of the plasma frequency yields optical evidence that the compound tend to approach the semimetal state at very low temperature.
R() along the c axis shows similar behaviors as along the a axis. The plasma edge almost lies at the same position as along the a axis at different temperatures. However, the overall reflectivity is a little bit lower along the c axis, which is absolutely reasonable because the conductivity along this direction is supposed to be lower. Moreover, the phonon signals shown in Figure 2 (a) and (b) are quite distinct, revealing different oscillating modes. In the following paragraphes, we will only discuss the characteristic features along the a axis.
Basically, the spectra at higher energies are dominated by interband transitions, as shown in Fig. 2 (c). The peaks centered around 2700 cm-1 , 4500 cm-1 and 7800 cm-1 represent for different transitions. Remarkably, the interband transitions exhibit temperature dependence. This is seen more clearly for the second peak. As temperature decreases, the peak frequency moves to higher energy and its spectral weight is enhanced simultaneously. The enhancement is linked to the reduction of Drude spectral weight. As we shall explain below, it may be caused by the shift of chemical potential associated with temperature-induced subtle crystal structural change.
The real part of optical conductivities () are derived from R() though Kramers-Kronig relation, as displayed in Figure 3. The Hagen-Rubens relation was used for the low frequency extrapolation, and the x-ray atomic scattering functions were used in the high frequency extrapolation Tanner (2015). Figure 3 (a) shows () in the low frequency. Although the screened plasma edge can be clearly observed in R(), the Drude component in () appears mainly in the extrapolated region. Apparently, the Drude spectral weight reduces significantly at low temperature, being consistent with the dramatic shift of plasma edge towards low frequency in R(). In addition, three sharp phonon peaks are resolved at 46, 86 and 185 cm-1 , respectively. When the temperature decreases, the phonon frequencies shift slightly towards higher energies.
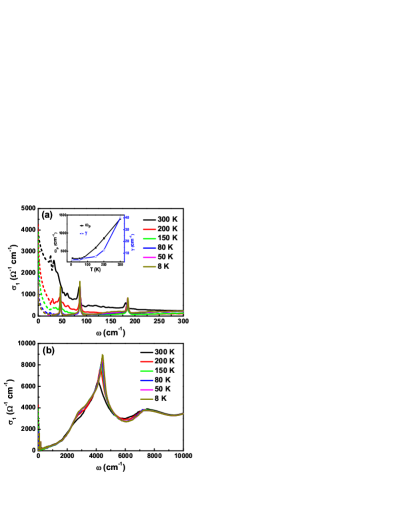
The free carrier contributions could be quantitatively estimated from the application of Drude model, which has a peak centered at zero frequency and the peak width is just the carrier scattering rate . The Drude spectral weight, which gives the plasma frequency , could be alternatively obtained from integrating the low frequency spectral weight by , where is the cut off frequency. The integration should sum up all the free carrier contributions, without the influence of any interband transitions. We chose the frequency where reaches a minimum as , which was identified to be 30, 30, 70, 130, 220 and 330 cm-1 in sequence corresponding to increasing temperatures. The yielded temperature dependent scattering rate and plasma frequency are plotted in the inset of 3 (a). The scattering rate decreases from 40 cm-1 at 300 K to 4 cm-1 at 8K. Meanwhile, drops monotonically upon cooling from 1400 cm-1 to 300 cm-1 . Assuming the effective mass of free carriers remains unchanged, then 95% of the population is reduced. The dramatic reduction of free carriers could hardly been explained by reduced thermal excitations. Here, we propose that this peculiar phenomenon is related to the chemical potential, which moves closer to the Dirac node as temperature decreasing, along with the lattice shrinking. Theoretical calculation suggested that the electronic properties of ZrTe5 are extraordinarily sensitive to the variation of the lattice parameters Weng et al. (2014).
Figure 3 (b) presents the optical conductivity in the energy scale up to 10 000 cm-1 . Corresponding to R(), an exceptional sharp peak shows up at around 4000 cm-1 , along with a shoulder-like feature at around 2800 cm-1 . When temperature decreases, the central frequency of the sharp peak shifts to higher energy and the half with of it gets smaller. At the lowest temperature, it even becomes quasi-divergence. This feature has never been observed in any other 3D materials. We noticed that the reflectance of single-walled carbon nanotubes, whose joint density of states (JDOS) are constituted by individual Van Hove singularities, was reported to show geometry-dependent resonant peaks Zeng et al. (2008), which are identified to stem from interband transitions between these singularities. Consequently, it is most likely that the quasi-divergent peak exhibited in also requires for a Van Hove singularity in the JDOS of ZrTe5, which is rarely seen in a 3D bulk material. Nevertheless, the ZrTe5 single crystals are easily cleaved both along the b and c axis, forming a needle-like compound. The lattice parameters of a=3.9876 , b=14.505 , c=13.2727 also indicate a quasi-one dimensional property, which tends to strengthen the effect of a Van Hove singularity.
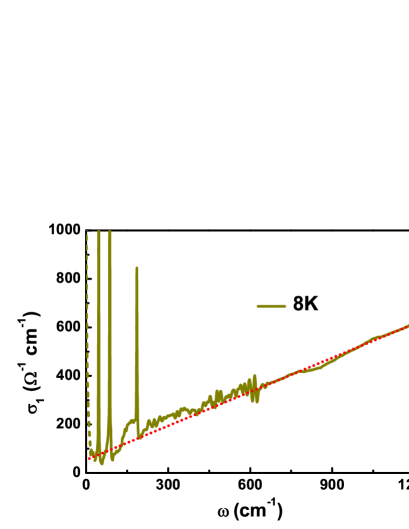
Usually Lorentz model is employed to describe the interband transition. However, for present compound, the conductivity data above the Drude component could not be reproduced by the Lorentz model due to a linear increase of conductivity with frequency. To make it clearly to see, the optical conductivity at 8 K is displayed in Fig. 4, where the linear increasing is fitted by a red dotted line. Baási and Virosztek showed that, for a noninteracting electron system consisting of two symmetric energy bands touching each other at the Fermi level whose Hamiltonian depends on the magnitude of the momentum through a power-law behavior, the optical conductivity of the interband contribution has a power-law frequency dependence with , where d is the dimension of the system and z represents for the power-law term of the band dispersion Bácsi and Virosztek (2013). For example, the two dimensional graphene with linear dispersion of (that is, =2 and =1) gives rise to a frequency independent conductivity, which has been confirmed by optical experiments Mak et al. (2008). For the case of 3D compound ZrTe5, the linear rising demands for . By applying =3, a linear dispersion =1 is obtained, in good agreement with a Dirac semimetallic behavior.
As a matter of fact, the linearly growing optical conductivity has also been observed in a Rh-doped Nd2Ir2O7 below 50 meV Ueda et al. (2012). Since pyrochlore iridates were suggested to host Weyl semimetals Wan et al. (2011), the observation has been taken as the evidence of a Weyl semimetal even though the linear increasing only persistd in a very small energy scale. Significantly, several quasicrystals (such as Al63.5Cu24.5Fe12, Al75.5Mn20.5Si10.1) has shown similar behaviors as well Timusk et al. (2013), all of which are lack of inversion symmetries and were suggested to be candidates of Weyl semimetals. Furthermore, 3D massless electrons with huge Fermi velocity are certified by linear rising optical conductivity in the zinc-blende crystal Hg1-xCdxTe, with a proper doping concentration close to =0.17 Orlita et al. (2014). What we observed here, however, is the first bulk evidence of a time reversal and space inversion symmetry protected 3D Dirac semimetal in the as-grown single crystal.
The linear increase of optical conductivity is an unparalleled property of bulk 3D Dirac band dispersions. Theoretical studies show that the optical conductivity contributed by per Weyl node (lifting the spin degeneracy) is Hosur et al. (2012); Ashby and Carbotte (2014) ==, where =7.72710 is the quantum conductance. For ZrTe5, band structural calculations indicates only one possible Dirac node near point per ZrTe5 layer Weng et al. (2014). Considering that each Dirac node has a spin degeneracy of 2, we can get the Fermi velocity 106 cm/s in terms of the slope of the conductivity shown in Fig. 4. This value is significantly smaller than the Fermi velocity determined by ARPES experiment along a- or c-axis (smaller but close to 108 cm/s). We remark that, for 3D Dirac semimetals, although the linear dispersions exist for all three momentum directions, their slopes or Fermi velocities are in fact different. ZrTe5 has a layered structure, the Fermi velocity in the direction perpendicular to the layers (along b-axis) must be much smaller than the other two directions, unfortunately presently available measurement has not yielded such information. The Fermi velocity determined from optical conductivity for a 3D Dirac semimetal must contain contributions from all momentum directions.
For a rigorous Dirac semiemtal, the Fermi energy lies right across the Dirac points and the Fermi surfaces would shrink to isolated points in the BZ. As a result, there would be no free carriers. The optical conductivity of ZrTe5 shows obvious Drude component at high temperatures, implying that the Fermi energy stays away from the Dirac point. With temperature decreasing, the density of free carriers decreases monotonically and almost all of them are lost at the lowest temperature, which is consistent with the approaching of the Fermi level to the Dirac point. ARPES measurement has produced a very similar scenario. It is also worth noting that the frequency where the conductivity deviates from linear dependence can not be treated as the cutoff energy of linear band dispersion, as is dramatically modified by other interband transitions at higher energies.
In conclusion, we have studied the optical conductivity of the 3D topological Dirac semimetal material ZeTe5. The number of free carriers are proved to be much smaller than conventional metals, manifesting a semimetallic behavior. Furthermore, it decreases as temperature decreasing, probably caused by the modification of chemical potential, which might be sensitive to the lattice parameter variation. An unexpected quasi-divergent peak is also observed in the optical conductivity, which is possibly associated with a Van Hove singularity in the JDOS. Most importantly, the optical conductivity grows linearly with frequency below 1200 cm-1 , presenting the first optical spectroscopic evidence of a 3D Dirac semimetal.
ACKNOWLEDGMENTS
We acknowledge very helpful discussions with H. M. Weng, F. Wang, X. C. Xie, Z. Fang, X. Dai, H. W. Liu. This work was supported by the National Science Foundation of China (11120101003, 11327806), and the 973 project of the Ministry of Science and Technology of China (2011CB921701, 2012CB821403). Work at Brookhaven is supported by the Office of Basic Energy Sciences, Division of Materials Sciences and Engineering, U.S. Department of Energy under Contract No. DE-SC00112704
References
- Young et al. (2012) S. M. Young, S. Zaheer, J. C. Y. Teo, C. L. Kane, E. J. Mele, and A. M. Rappe, Phys. Rev. Lett. 108, 140405 (2012).
- Mañes (2012) J. L. Mañes, Phys. Rev. B 85, 155118 (2012).
- Xu et al. (2015) S. Y. Xu, C. Liu, S. K. Kushwaha, R. Sankar, J. W. Krizan, I. Belopolski, M. Neupane, G. Bian, N. Alidoust, T. R. Chang, H. T. Jeng, C. Y. Huang, W. F. Tsai, H. Lin, P. P. Shibayev, F. C. Chou, R. J. Cava, and M. Z. Hasan, Science 347, 294 (2015).
- Rober et al. (1979) E. Rober, K. Hackstein, H. Coufal, and S. Sotier, Phys. Stat. Sol. (b) 93, K99 (1979).
- Koshino and Ando (2010) M. Koshino and T. Ando, Phys. Rev. B 81, 195431 (2010).
- Abrikosov (1998) A. A. Abrikosov, Phys. Rev. B 58, 2788 (1998).
- Zhang et al. (2011) W. Zhang, R. Yu, W. Feng, Y. Yao, H. Weng, X. Dai, and Z. Fang, Phys. Rev. Lett. 106, 156808 (2011).
- Fukushima et al. (2008) K. Fukushima, D. E. Kharzeev, and H. J. Warringa, Phys. Rev. D 78, 074033 (2008).
- Son and Spivak (2013) D. T. Son and B. Z. Spivak, Phys. Rev. B 88, 104412 (2013).
- Hosur and Qi (2014) P. Hosur and X. L. Qi, Phys. Rev. B 91, 081106 (2014).
- Kharzeev (2014) D. E. Kharzeev, Prog. Part. Nucl. Phys. 75, 133 (2014).
- Burkov (2014) A. A. Burkov, Phys. Rev. Lett. 113, 247203 (2014).
- (13) Q. Li, D. E. Kharzeev, C. Zhang, Y. Huang, I. Pletikosic, A. V. Fedorov, R. D. Zhong, J. A. Schneeloch, G. D. Gu, and T. Valla, arXiv:1412.6543v1 [cond-mat.str-el] .
- (14) C. L. Zhang, Z. J. Yuan, S. Y. Xu, Z. Q. Lin, B. B. Tong, M. Z. Hasan, J. F. Wang, C. Zhang, and S. Jia, arXiv:1502.00251v1 [cond-mat.mtrl-sci] .
- (15) X. C. Huang, L. X. Zhao, Y. J. Long, P. P. Wang, D. Chen, Z. H. Yang, H. Liang, M. Q. Xue, H. M. Weng, Z. Fang, X. Dai, and G. F. Chen, arXiv:1503.01304v1 [cond-mat.mtrl-sci] .
- Wang et al. (2012) Z. J. Wang, Y. Sun, X. Q. Chen, C. Franchini, G. Xu, H. M. Weng, X. Dai, and Z. Fang, Phys. Rev. B 85, 195320 (2012).
- Wang et al. (2013) Z. J. Wang, H. M. Weng, Q. S. Wu, X. Dai, and Z. Fang, Phys. Rev. B 88, 125427 (2013).
- Borisenko et al. (2014) S. Borisenko, Q. Gibson, D. Evtushinsky, V. Zabolotnyy, B. Büchner, and R. J. Cava, Phys. Rev. Lett. 113, 027603 (2014).
- Neupane et al. (2014) M. Neupane, S. Y. Xu, R. Sankar, N. Alidoust, G. Bian, C. Liu, I. Belopolski, T. R. Chang, H. T. Jeng, H. Lin, A. Bansil, F. Chou, and M. Z. Hasan, Nat. Commun. 5, 3786 (2014).
- Liu et al. (2014a) Z. K. Liu, B. Zhou, Y. Zhang, Z. J. Wang, H. M. Weng, D. Prabhakaran, S.-K. Mo, Z. X. Shen, Z. Fang, X. Dai, Z. Hussain, and Y. L. Chen, Science 343, 864 (2014a).
- Liu et al. (2014b) Z. K. Liu, J. Jiang, B. Zhou, Z. J. Wang, Y. Zhang, H. M. Weng, D. Prabhakaran, S.-K. Mo, H. Peng, P. Dudin, T. Kim, M. Hoesch, Z. Fang, X. Dai, Z. X. Shen, D. L. Feng, Z. Hussain, and Y. L. Chen, Nat. Mater. 13, 677 (2014b).
- Mak et al. (2008) K. F. Mak, M. Y. Sfeir, Y. Wu, C. H. Lui, J. A. Misewich, and T. F. Heinz, Phys. Rev. Lett. 101, 196405 (2008).
- Hosur et al. (2012) P. Hosur, S. A. Parameswaran, and A. Vishwanath, Phys. Rev. Lett. 108, 046602 (2012).
- Ashby and Carbotte (2014) P. E. C. Ashby and J. P. Carbotte, Phys. Rev. B 89, 245121 (2014).
- DiSalvo et al. (1981) F. J. DiSalvo, R. M. Fleming, and J. V. Waszczak, Phys. Rev. B 24, 2935 (1981).
- Kamm et al. (1985) G. N. Kamm, D. J. Gillespie, A. C. Ehrlich, T. J. Wieting, and F. Levy, Phys. Rev. B 31, 7617 (1985).
- Whangbo et al. (1982) M. H. Whangbo, F. J. DiSalvo, and R. M. Fleming, Phys. Rev. B 26, 687 (1982).
- He et al. (2014) L. P. He, X. C. Hong, J. K. Dong, J. Pan, Z. Zhang, J. Zhang, and S. Y. Li, Phys. Rev. Lett. 113, 246402 (2014).
- Weng et al. (2014) H. Weng, X. Dai, and Z. Fang, Phys. Rev. X 4, 011002 (2014).
- Tanner (2015) D. B. Tanner, Phys. Rev. B 91, 035123 (2015).
- Zeng et al. (2008) H. L. Zeng, L. Y. Jiao, X. J. Xian, X. C. Qin, Z. F. Liu, and X. D. Cui, Nanotechnology 19, 045708 (2008).
- Bácsi and Virosztek (2013) A. Bácsi and A. Virosztek, Phys. Rev. B 87, 125425 (2013).
- Ueda et al. (2012) K. Ueda, J. Fujioka, Y. Takahashi, T. Suzuki, S. Ishiwata, Y. Taguchi, and Y. Tokura, Phys. Rev. Lett. 109, 136402 (2012).
- Wan et al. (2011) X. G. Wan, A. M. Turner, A. Vishwanath, and S. Y. Savrasov, Phys. Rev. B 83, 205101 (2011).
- Timusk et al. (2013) T. Timusk, J. P. Carbotte, C. C. Homes, D. N. Basov, and S. G. Sharapov, Phys. Rev. B 87, 235121 (2013).
- Orlita et al. (2014) M. Orlita, D. M. Basko, M. S. Zholudev, F. Teppe, W. Knap, V. I. Gavrilenko, N. N. Mikhailov, S. a. Dvoretskii, P. Neugebauer, C. Faugeras, a L. Barra, G. Martinez, and M. Potemski, Nature Physics 10, 233 (2014).