11email: tomo@phys.nthu.edu.tw 22institutetext: Dark Cosmology Centre, Niels Bohr Institute, University of Copenhagen, Denmark
22email: sune@dark-cosmology.dk
CO luminosity - line width correlation of sub-millimeter galaxies
Abstract
Context. A possible correlation between CO luminosity () and its line width (FWHM) has been suggested and denied in the literature. Such claims were often based on a small, or heterogeneous sample of galaxies, and thus inconclusive.
Aims. We aim to prove or dis-prove the -FWHM correlation.
Methods. We compile a large sample of submm galaxies at from the literature, and investigate the -FWHM relation.
Results. After carefully evaluating the selection effects and uncertainties such as inclination and magnification via gravitational lensing, we show that there exist a weak but significant correlation between and FWHM. We also discuss a feasibility to measure the cosmological distance using the correlation.
Key Words.:
sub-millimeter galaxies – Hubble diagram – Cosmological distance scale1 Introduction
A possible correlation between CO luminosity () and its line width at high-z has been suggested in the literature. Bothwell et al. (2013) observed 32 submm galaxies (SMG) at in 12CO and suggested a correlation between CO luminosity and line width (FWHM) in high-redshift starbursts, likely relating to baryon-dominated gas dynamics within the regions probed (See their Fig. 5). Using 15 SMG at z=2-4 with known lens magnifications, Harris et al. (2012) showed that the SMGs fall close to a power-law with small scatter in CO luminosity and line width (FWHM) plane (See their Fig.7).
Bright SMGs are often gravitationally-lensed. Such relation between and FWHM can be used to estimate magnification factor (). Indeed, Harris et al. (2012) used the relation to estimate luminosity of SMGs with unknown . Fu et al. (2013) also used this relation to estimate a small (1.8) of merging galaxies at z=2.3 to conclude their star formation rate were 2000 (See their Fig. S7). Similarly, Riechers et al. (2013) used the relation to estimate (1.50.7) of a starburst galaxy at z=6.34, finding its SFR of 2900 .
Conversely, Carilli & Walter (2013) examined the relation using a much larger sample, and found no significant correlation between and FWHM (See their Fig.5). However, their sample was heterogeneous including various types of galaxies such as SMM, QSO, radio galaxies, 24m sources and so on. Therefore, the existence of -FWHM correlation is still controversial.
In this paper, we compile a larger sample of galaxies with CO detection from the literature, to re-examine the -FWHM correlation at high-z. We carefully examine various sources of possible uncertainties such as different types of galaxies, luminosity conversion from different CO transitions, and errors in estimating . Unless otherwise stated, we adopt a cosmology with .
| Sample | N | Spearman’s coeff. | p-value | Kendall’s coeff. | p-value | Dispersion (km/s) |
| All | 195 | 0.55 | 1.7 | 0.39 | 187. | |
| Submm galaxies | 72 | 0.53 | 2.1 | 0.37 | 4.2 | 272. |
| QSO hosts | 31 | 0.53 | 2.0 | 0.39 | 1.9 | 245. |
| Submm galaxies +QSO hosts | 103 | 0.52 | 1.4 | 0.37 | 218. | |
| CO(4-3) only | 26 | -0.34 | 9.2 | -0.21 | 1.4 | 279. |
| CO(3-2) only | 62 | 0.12 | 3.5 | 0.09 | 2.8 | 217. |
| CO(2-1) only | 38 | 0.18 | 2.8 | 0.14 | 2.2 | 182. |
| CO(1-0) only | 43 | 0.22 | 1.5 | 0.15 | 1.6 | 121. |
| All but CO(4-3) | 143 | 0.52 | 4.0 | 0.37 | 206. | |
| All but CO(3-2) | 107 | 0.56 | 2.5 | 0.40 | 201. | |
| All but CO(2-1) | 131 | 0.58 | 5.9 | 0.42 | 231. | |
| All but CO(1-0) | 126 | 0.52 | 4.8 | 0.37 | 237. | |
| known | 85 | 0.42 | 7.3 | 0.30 | 5.3 | 156. |
| unknown | 110 | 0.47 | 2.4 | 0.33 | 3.6 | 205. |
| 24m sources | 8 | 0.45 | 2.6 | 0.36 | 2.2 | 204. |
| BzK galaxies | 4 | 0.80 | 2.0 | 0.67 | 1.7 | 156. |
2 Sample
Our sample is based on updated version of the supplemental table of Carilli & Walter (2013), which contains all published CO line measurements at by December 31, 2012. The updated version also include some submm sources published in 2013. We created a large sample of high-z submm galaxies by adding 32 sources observed by Bothwell et al. (2013). In total, our sample contains 195 galaxies, detected at least in one CO transition, with a measured FWHM.
3 Analysis
We compute using the standard definition
| (1) |
where is the velocity integrated line flux, is the line luminosity in K Km s-1 pc2, is the observed central frequency of the line and is the luminosity distance in Mpc.
If the molecular gas emission comes from thermalized, optically thick regions, is constant for all levels. However, in reality, the ratio of to higher order depends on temperature and density. We use average ratio of / provided in Table 4 of Bothwell et al. (2013), to calculate from higher order CO observations. Higher redshift galaxies are often observed only at mid-to-high-J CO transitions. We discuss uncertainties associated with this conversion in Section 4 in detail.
It is always a concern with high-z objects, that they might be gravitationally magnified. Submm galaxies are not an exception. thus also needs to be corrected for a magnification factor (), when the galaxy is magnified by a gravitational lens. We collected -values from the literature whenever available. However, as must be estimated from detailed modeling of the lens potential, a reliable measurement is not always available. We will examine how the correlation depends on the availability and amplitude of in Section 4, but in brief, they do not change our main results. Most likely, majority of galaxies with missing are not strongly magnified; otherwise a lens galaxy would have been detected and would have been estimated. We present , whenever is available hereafter.
4 Results
4.1 -FWHM correlation
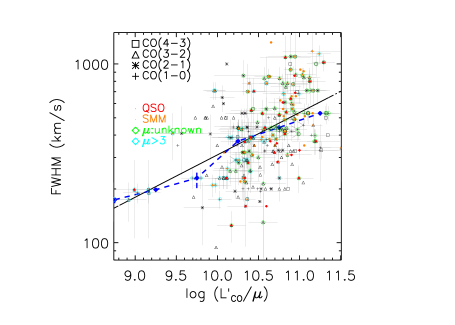
In Fig.1, we plot CO line width FWHM against for all galaxies in our sample. The solid line is the best-fit power-law, which is
| (2) |
The significance of the non-zero slope is 8.7 . Spearman’s correlation coefficient is 0.55 with p-value of 1.710-16. Kendall’s correlation coefficient is similarly significant as shown in Table 1. The blue dashed line connects the median points in each bin. Errors on each point are small due to the large number of galaxies in our sample. The median values increase with increasing . These results show there exists a weak, but very significant correlation between and FWHM.
The presence of such a correlation is not surprising. is sensitive to the total mass of molecular gas, while the FWHM is sensitive to dynamical mass. The relation is similar to Tully-Fisher relation, which is also a power-law, in the local Universe (Tully & Fisher, 1977). A large scatter around the relation is also expected due to the inclination effect, and the unknown for a subset of galaxies. We measured a dispersion around the best-fit line of 43%, which is consistent with what one expects from randomly oriented thin disks (45%), suggesting is close to 1 for most of the galaxies with unknown .
4.2 Uncertainty in converting different transitions
We test if conversions from different CO transitions can mimic the correlation. In Fig.1,we used different symbols for different CO transitions (4-3,3-2,2-1, and 1-0). In Table 1, we show correlation coefficients for these. For CO(4-3), we do not see a positive correlation, while we see weak correlations for the other transitions. It is reassuring to see the correlations within single CO transitions, because they cannot be due to errors in the transition conversion. The reason why we do not see a positive correlation for the CO(4-3) transition is not clear, but we point out that this is the smallest subsample, and that since a single transition only spans a small redshift range (and thus, a small luminosity range), it is difficult to examine a correlation with a small sample in a single transition. It will be necessary to repeat this test using the wider frequency coverage of ALMA. On the other hand, we see significant correlations in all cases when we exclude a certain CO transition from the sample. These tests suggest that the -FWHM correlation is not an artifact of CO order conversions.
4.3 Dependence on magnification
Among our sample, 85 galaxies have known , while the other 110 galaxies do not. We should first note that many submm galaxies with unknown are probably not strongly magnified; otherwise we would have seen the lens galaxy/cluster and measured . With this in mind, we still test if an unknown can mimic the correlation. In Fig.1, we mark two extreme samples of galaxies; galaxies with in cyan, and those with unknown in green. There is no apparent deviation from the best-fit relation, except that more s are unknown at higher redshift. In Table 1, we separate the sample into those with known , and those with unknown , both of which show a significant correlation. Because brighter submm galaxies are more likely to be lensed (due to the steep luminosity function), the correction to unknown will steepen the correlation, i.e., the correlation will not disappear with the correction. It is re-assuring to see a positive correlation using many submm galaxies with unknown .
4.4 Dependence on galaxy types
4.5 Redshift dependence
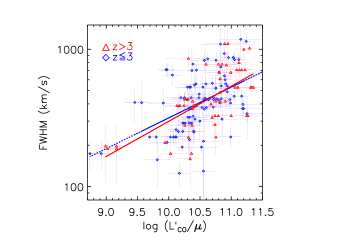
Next we examine if the -FWHM correlation changes with redshift. Unfortunately, due to the flux limits of the telescopes, the higher redshift sample includes more luminous sources, while lower redshift sources have smaller luminosity due to volume effects. With this limitation in mind, we separated the sample into high (z3) and low (z3) redshift samples in Fig.2. The best-fit lines to each sample agree with each other within the errors, consistent with no significant redshift-evolution. The slopes are also consistent with each other, and with that of the full sample in Fig.1.
A concern for low level CO transition is that CMB temperature becomes higher at the highest redshift end. For example, the CMB temperature at z=6 is 19K, which is higher than the temperature needed to excite the CO(2-1) line (16.6K). Fortunately at high redshift, ALMA can only observe higher excitation lines, which are less affected. At , only CO(6-5) (=116.16K) and higher excitations can be observed with ALMA. The relation would be still valid at lower redshift (). However, the effect of the higher CMB temperature need to be examined carefully at higher redshifts.
Although we did not find any sign of redshift evolution, we also note that it is expected the gas fraction in a galaxy should increase as a function of redshift. Therefore, it is important to repeat this test when larger sample become available in the future.
4.6 Estimating gravitational magnification using -FWHM relation
If we assume the -FWHM relation, the equation 2 can be used to estimate . We re-write the equation as follows.
| (3) |
The units for and FWHM are K Km s-1 pc2 and Km s-1, respectively. The equation can be useful when, for example, a submm galaxy is detected behind a galaxy cluster, and subject to gravitational magnification, but the detailed lens model is not available. Using the equation 3, one can estimate and thereby intrinsic luminosities of the submm galaxy.
5 Discussion
5.1 A possible cosmological application
If the correlation is independent of redshift, the luminosity distance to CO emitting galaxies can in principle be measured by estimating from FWHM. Such a distance measure would be useful because already now, galaxies at z6 have been detected in CO with ALMA (Riechers et al., 2013; Wang et al., 2013). This method can be used up to such a high redshift, where it is difficult for other distance measures to reach. Here we assess whether such an approach could be feasible.
in Figs 1 and 2 assumes a cosmology; =(0.3,0.7,0.7). Therefore, we need to calibrate the correlation by using CO detected galaxies with a measured distance from another method. This, however, is difficult because CO detected galaxies are mostly at very high redshifts, where other distance measures cannot easily reach.
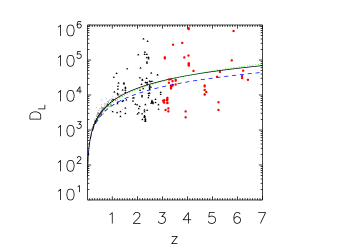
There are a number of ways to calibrate the distances, but here we use a method often used to calibrate gamma ray burst. We use an empirical formula for the luminosity distance as a function of redshift based on 192 type Ia supernovae at 0.168z1.755 (; equation 1 of Tsutsui et al. (2009). This empirical formula does not assume any cosmology, but just that the type Ia supernovae are standard candles. We use the formula to assign luminosity distances to our submm galaxies at z3, and thus to calibrate our -FWHM correlation. Then, we apply the -FWHM correlation to measure luminosity distances to the z 3 submm galaxies.
The results are shown in Fig.3. Along with the data points, we plot three different cosmological models with =(0.3,0.7), (0.3,0.0), and (1.0,0.0) in the black solid, green dot ted and blue-dashed lines, respectively. At this stage, it is clear that the scatter is more than an order of magnitude larger than needed to obtain meaningful constraints on the cosmological parameters.
5.2 Sources of scatter in the relation, and prospects for reducing it
The scatter around the -FWHM correlation (43%) is consistent with what is expected from randomly oriented discs, so if most submm galaxies are rotating spiral-like galaxies, then the largest uncertainty likely comes from the unknown inclinations. With the full operational array, ALMA’s spatial resolution will be as good as 0.037” at 110 GHz (for CO observation) in the extended configuration. At z6, this corresponds to 0.2 kpc, which is sufficient to resolve submm galaxies, which typically extend over several kpc (Wang et al., 2013; De Breuck et al., 2014). With such observations it will also be possible to exclude mergers and pressure-supported galaxies which may be causing some of the extreme outliers from the relation, and to select samples of rotationally dominated galaxies. Furthermore, because the inclination is a random effect and its distribution is known (with sin i0.79 and 10.22), one can statistically correct for the effect. For the Tully-Fisher relation, for example, it has been shown that even when no information on the inclination is available, by using maximum likelihood estimation, the true relation can be recovered with only 1.5 times larger statistical error than when inclinations are known with zero uncertainty (Obreschkow & Meyer, 2013). As a reference, using the Tully-Fisher relation, Sakai et al. (2000) obtained =714 (random) 7 (systematic), i.e., 6 and 10% of statistical and systematic errors, respectively.
Another possible source of scatter is calibration errors, as even state of the art sub-mm telescopes can only be calibrated to 10% at best for individual observations. Such errors are also expected to improve drastically as large, homogeneous statistical samples become available from ALMA, as the error on the median reduces with . In a sample of 10000 submm galaxies for example, the statistical error on the median will reduce to 1%.
Note that this assumes the calibration error is random. If there is a systematic calibration error we are unaware of, this error will be added to the distance measurement.
Another possible source of scatter in the relation which will be brought down in future ALMA surveys, is conversions between CO transitions. In such samples it will be possible to study galaxies in the same transition as a function of redshift, or subsets of galaxies with well-constrained transition conversions. Once the observational and systematic errors have been brought down sufficiently to measure the intrinsic scatter of the relation it will to asses its possible cosmological applications. At the moment, it is impossible to tell.
Acknowledgements.
We greatly appreciate the anonymous referee, whose insightful comments helped improving the paper significantly. We acknowledge the support by the Ministry of Science and Technology of Taiwan through grant NSC 103-2112-M-007-002-MY3. The Dark Cosmology Centre is funded by the Danish National Research Foundation.References
- Bothwell et al. (2013) Bothwell, M. S., Smail, I., Chapman, S. C., et al. 2013, MNRAS, 429, 3047
- Carilli & Walter (2013) Carilli, C. L. & Walter, F. 2013, ARA&A, 51, 105
- De Breuck et al. (2014) De Breuck, C., Williams, R. J., Swinbank, M., et al. 2014, A&A, 565, A59
- Fu et al. (2013) Fu, H., Cooray, A., Feruglio, C., et al. 2013, Nature, 498, 338
- Harris et al. (2012) Harris, A. I., Baker, A. J., Frayer, D. T., et al. 2012, ApJ, 752, 152
- Obreschkow & Meyer (2013) Obreschkow, D. & Meyer, M. 2013, ApJ, 777, 140
- Riechers et al. (2013) Riechers, D. A., Bradford, C. M., Clements, D. L., et al. 2013, Nature, 496, 329
- Sakai et al. (2000) Sakai, S., Mould, J. R., Hughes, S. M. G., et al. 2000, ApJ, 529, 698
- Tsutsui et al. (2009) Tsutsui, R., Nakamura, T., Yonetoku, D., et al. 2009, J. Cosmology Astropart. Phys., 8, 15
- Tully & Fisher (1977) Tully, R. B. & Fisher, J. R. 1977, A&A, 54, 661
- Wang et al. (2013) Wang, R., Wagg, J., Carilli, C. L., et al. 2013, ApJ, 773, 44