Determining the Nature of Faint X-Ray Sources from the ASCA Galactic Center Survey
Аннотация
We present the results of the identification of six objects from the ASCA Galactic center and Galactic plane surveys: AX J173548-3207, AX J173628-3141, AX J1739.5-2910, AX J1740.4-2856, AX J1740.5-2937, AX J1743.9-2846. Chandra, XMM-Newton, and XRT/Swift X-ray data have been used to improve the positions of the optical counterparts to these sources. Thereafter, we have carried out a series of spectroscopic observations of the established optical counterparts at the RTT-150 telescope. Analysis of X-ray and optical spectra as well as photometric measurements in a wide wavelength range based on optical and infrared catalogs has allowed the nature of the program sources to be determined. Two X-ray objects have been detected in the error circle of AX J173628-3141: one is a coronally active G star and the other may be a symbiotic star, a red giant with an accreting white dwarf. Three sources (AX J1739.5-2910, AX J1740.5-2937, AX J1743.9-2846) have turned out to be active G–K stars, presumably RS CVn objects, one (AX J1740.4-2856) is an M dwarf, and another one (AX J173548- 3207) may be a low-mass X-ray binary in its low state. The distances and corresponding luminosities of the sources in the soft X-ray band have been estimated; analysis of deep INTEGRAL Galactic center observations has not revealed a statistically significant flux at energies 20 keV from any of them.
\englishkeywordsX-ray sources, active stars, Galaxy, ASCA observatory
2015415179[195]
9 December 2014
1 Introduction
The stellar population of galaxies consists of objects of various classes each of which can be an X-ray source through physical processes of different nature. In particular, in binary systems with neutron stars, black holes, and white dwarfs, X-ray emission is generated during the accretion of matter onto compact objects; stars of late spectral types have active coronas in which matter heated to millions and tens of millions degrees is an origin of X-ray emission; young stars can heat up matter in strong wind flows emitted by them; etc. Analysis of the physical processes in these objects often has to be made by studying a whole population of sources of a certain class, which makes it necessary to perform sky surveys and to identify detected sources.
In view of different design features of the instruments capable of performing all-sky surveys and despite their continuously improving characteristics, so far even the most sensitive RXTE (Revnivtsev et al. 2004), INTEGRAL (Krivonos et al. 2007), and Swift (Baumgartner et al. 2013) all-sky surveys have a sensitivity erg s-1 cm-2. The ROSAT sky survey performed at a sensitivity of erg s-1 cm-2 (Voges et al. 1999) constitutes an exception. However, this survey was performed at energies below 2 keV, an energy range strongly affected by interstellar absorption, which significantly limited its capabilities to study objects in the Galactic disk.
Observations with more sensitive instruments within the framework of special survey programs (see, e.g., Wang et al. 2002; Hands et al. 2004; Ebisawa et al. 2005; van den Berg et al. 2009; Revnivtsev et al. 2009) or programs to identify and observe X-ray sources (Kim et al. 2004; Saxton et al. 2008; Evans et al. 2010, 2014; Warwick 2014) also make it possible to obtain surveys of some Galactic regions. However, since the field of view of focal telescopes is small, they all cover only small areas in the sky. So far the ASCA surveys (Sugizaki et al. 2001; Sakano et al. 2002) have been among the most extensive (in Galactic center and Galactic plane coverage) surveys performed by X-ray telescopes with focusing optics at energies above 2 keV.
However, these surveys have also a significant shortcoming: a substantial fraction of the objects detected in these surveys are of unknown nature in view of the insufficient ASCA angular resolution, which makes it difficult to use them to study various populations of objects in our Galaxy. In addition, the analysis of ASCA data, the search for sources, and their detection have been significantly hampered by the proper allowance for the contribution from the Galactic ridge X-ray emission, allowance for the influence of bright objects, etc. The latest-generation Chandra and XMM-Newton X-ray observatories have carried out systematic observations of the sky fields in which sources were detected in the ASCA surveys for a long time. This allows one to improve considerably the astrometric positions of X-ray sources and then to carry out optical or infrared observations to determine their nature (Degenaar et al. 2012; Anderson et al. 2014).
In a harder X-ray band ( KeV), the most sensitive Galactic center and Galactic plane survey is the INTEGRAL one (Krivonos et al. 2012). This survey has a high identification completeness of detected sources (%) and a deep and fairly uniform (in exposure) coverage of the inner part of the Galactic plane, which allows statistical and population studies of X-ray sources of various classes to be performed (see, e.g., Revnivtsev et al. 2008 and Lutovinov et al. 2013, for low-mass and high-mass X-ray binaries, respectively). The Galactic center region is of particular interest for investigating the spatial distribution of high-mass X-ray binaries. This is because, according to the theory of stellar evolution, such objects representing the young population of the Galaxy must concentrate toward the regions of enhanced star formation, i.e., toward the spiral arms. Currently available observational data confirm this viewpoint (see, e.g., Grimm et al. 2002; Lutovinov et al. 2005; Bodaghee et al. 2012; and references therein). At the same time, it should be noted that high-mass X-ray binaries can, in principle, also exist in galactic bulges (a bulge is a thickening observed at the centers of spiral galaxies), in regions where star formation processes take place (for example, in molecular clouds), but so far there are no unambiguous observational confirmations of this. Within the framework of our program for search high-mass X-ray binaries in the Galactic bulge, we are performing a systematic analysis of all the unidentified Xray sources detected in the ASCA and INTEGRAL Galactic center surveys to establish their nature and to determine distances to them. We have selected a total of 17 sources from the ASCA survey and 7 objects from the INTEGRAL survey for this study.
In this paper, we present the results of the first stage of this program within the framework of which we have identified six faint objects from the ASCA survey with the help of spectroscopic observations of candidates at the Russian-Turkish 1.5-m telescope (RTT-150) using the TFOSC medium- and low-resolution spectrometer.
2 X-ray observations
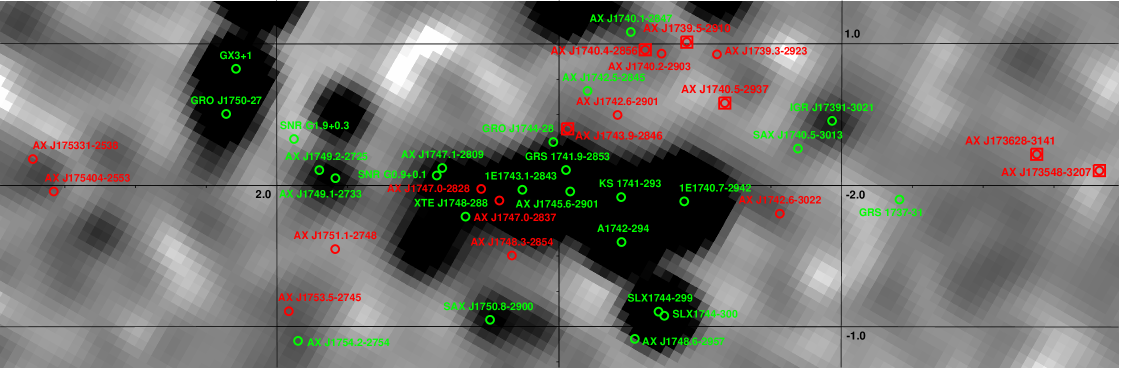
Figure 1 shows the map of the Galactic center region with coordinates , , obtained by summing all the available INTEGRAL data over the period of observations 2003– 2014 in the 17–60 keV energy band (the total exposure time is more than 40 Ms). Darker regions correspond to the positions of brighter objects in hard X-rays.
The positions of the sources detected in the ASCA surveys are indicated by circles of different colors: the green color indicates the sources whose nature is known (their widely used names rather than the names from the surveys themselves are given); the red color marks the objects whose nature has not yet been established. A total of 42 sources detected by ASCA in this sky field are shown on the map, for 25 of which the type and class have already been determined, while the nature of 17 more sources is unknown. Six of these 17 objects, which are the subject of our studies in this paper, are additionally marked by the red squares. Note that all these sources are in the first quadrant and are distinguished by the fact that the optical counterparts are optically bright stars. The latter has allowed us to perform their optical spectroscopy and, in the long run, to determine their nature.
It can be seen from Fig. 1 that the signal from some of the objects detected by ASCA is also registered in hard X-rays, with this being also true for the sources of unknown nature. However, none of the objects investigated in this paper was detected at a statistically significant level by INTEGRAL. The () upper limits on the 20–40 keV fluxes from
| [0.5mm] Source | 2MASS | ObsID | erg s-1 cm-2 | Spectral parameters | Type | Distance | |||||
| ObsID | 0.5-2 | 2-10 | 0.7-10 | , KeV | kpc | erg s-1 | |||||
| KeV | KeV | KeV | |||||||||
| AX J173548-3207 | J17354627-3207099 | Chandra | 14.19 | qLMXB? | |||||||
| 8148 | |||||||||||
| AX J173628-3141 | J17362729-3141234 | Chandra | 11.03 | G0III | 1.4 | ||||||
| 8158 | |||||||||||
| VVV | 2.0(fix) | ||||||||||
| AX J1739.5-2910 | J17393122-2909532 | Chandra | 7.21 | G-KIII | 0.4 | ||||||
| 14887 | |||||||||||
| Chandra | |||||||||||
| 8679 | |||||||||||
| XMM-Newton | |||||||||||
| 0304220101 | |||||||||||
| XMM-Newton | |||||||||||
| 0304220301 | |||||||||||
| AX J1740.4-2856 | J17402384-2856527 | XMM-Newton | 9.88 | M0-2 | |||||||
| 0511010701 | |||||||||||
| XMM-Newton | |||||||||||
| 030422060 | |||||||||||
| AX J1740.5-2937 | J17403458-2937438 | XRT/Swift | 9.31 | G0-5IV | |||||||
| 00043602001 | |||||||||||
| AX J1743.9-2846 | J17435129-2846380 | XMM-Newton | 8.54 | G5III | 1.1 | ||||||
| 0112971901 | 0.5 | ||||||||||
| XMM-Newton | |||||||||||
| 0112971201 | |||||||||||
| Chandra | |||||||||||
| 8209 | |||||||||||
four sources, AX J173548-3207, AX J173628- 3141, AX J1739.5-2910, and AX J1740.5-2937, are mCrab. Formally, emission with fluxes of and mCrab is registered from position boxes of two other sources, AX J1740.4-2856 and AX J1743.9-2846, respectively. However, given the insufficiently high angular resolution of the IBIS/INTEGRAL telescope (12, Winkler et al 2003), additional studies have established that these fluxes do not belong to the objects under study: the measured flux for AX J1743.9-2846 is most likely attributable to the contribution of emission from the nearby source GRS 1741.9-2853, while the emission from the error circle of AX J1740.4-2856 actually belongs to a different source from the ASCA survey, AX J1740.1-2847 (Mereminsky et al., in preparation).
The positional accuracies for the sources in the ASCA Galactic center and Galactic plane surveys are 50 and 1, respectively (Sugizaki et al. 2001; Sakano et al. 2002), which is insufficient to identify the detected objects with optical and infrared sources and to determine their nature. Nevertheless, owing to the data obtained in the special Chandra, XMM-Newton, and XRT/Swift Galactic center surveys, we have been able to identify the sources detected by ASCA with objects in these surveys. It should be noted that we took the astrometric positions of the corresponding objects from the Chandra/XMM-Newton/ XRT surveys (Evans et al. 2010, Degenaar et al. 2012, Evans et al. 2014), and the 3XMM-DR4 catalogue111http://xmmssc-www.star.le.ac.uk/Catalogue/xcat_ public_3XMM-DR4.html. This allowed us to measure their X-ray spectra and fluxes, to compare results obtained with the ASCA results, and to perform spectroscopic observations of the probable optical counterparts to these systems. The table gives the names of the corresponding objects and their J magnitudes from the 2MASS catalog and, for the hard counterpart to AX J173628-3141, from the VVV/ESO (the VISTA telescope) survey.


In the next section, we present results of our optical observations and discuss the nature of each source separately, while here we will consider results of spectral analysis in the X-ray wavelength range in general terms. Figure 2 shows the Chandra, XMM-Newton, and XRT/Swift spectra of the six program sources in the 0.5–10 keV energy band. The best fits to these spectra and the corresponding fluxes are presented in the table. The fluxes are given in three energy bands: 0.5–2, 2–10, and 0.7–10 keV. The measurements in the first two bands provide information about the ratio of the soft and hard X-ray fluxes, while the last band allows the results of our measurements to be compared with the ASCA results obtained in the 0.7– 10 keV energy band as well. The spectra of almost all sources can be satisfactorily described by a power law with absorption at low energies; the corresponding values of and are given in the table. For very soft sources, in the spectra of which there are virtually no photons with energies 2 keV, we used the thermal cevmkl model of the multi-temperature plasma emission from the XSPEC package; the corresponding maximum temperature is given in the table. Note in advance that most of objects under study have turned out to be active giants or subgiants of late spectral types (G–K), probably RS CVn binaries. Therefore, to fit spectra of the brightest sources, AX J1739.5-2910 and AX J1743.9-2846, we used a power law with a break in the form
where are the slopes of the spectrum before and after the break at energy . We fixed and at 0.5 and 0.9 keV, respectively, typical of them (Sazonov et al. 2006), while the table gives and interstellar absorption magnitudes.
To conclude this section, note that the construction of images from the IBIS/INTEGRAL data is based on the balanced cross-correlation algorithm (for a description, see Krivonos et al. 2010; Churazov et al. 2014); the Chandra and XMM-Newton data were analyzed with special-purpose software, CIAO 4.6 and SAS v14.0.0, respectively; the final data analysis and XRT data processing were performed with theFTOOLS/HEASOFT 6.14 package.
3 Results of optical identifications
The optical spectra of the sources were taken with the TFOSC medium- and low-resolution spectrometer222http://hea.iki.rssi.ru/rtt150/ru/index.php?page=tfosc of RTT-150 using a grism that provided a resolution of about 12-15Å and a high quantum efficiency in a wide spectral range, 4000-9000Å. Since all sources have declinations and are at very large zenith angles for RTT-150 (the telescope is located at latitude 36∘ 49′ N, and longitude 30∘ 20′ E), the absolute accuracy of our spectrophotometric measurements is low; therefore, we normalized the spectrum of an object to its continuum for the subsequent analysis. The observations were carried out from May 16 to June 5, 2013, with an exposure time of 600–900 s per each source.

The optical data were processed in a standard way using the IRAF333http://iraf.noao.edu software package and our own software.
3.1 AX J173548-3207
AX J173548-3207 was observed by Chandra (Evans et al. 2010; Anderson et al. 2014) and fell several times within the XRT/Swift field of view during the Swift Galactic plane survey (Evans et al. 2014). The accurate astrometric position of the source allow it to be confidently associated with the object 2MASS J17354627-3207099 (Fig.3). Its optical spectrum at RTT-150 with an exposure time of 900 s (Fig.4). The spectrum contains no distinct features, except for the weak (6563Å) emission line. The presence of this emission line at , suggests that this source is a galactic one.
The optical spectrum suggests that source is most likely a low-mass X-ray binary system (see, e.g., the spectrum of the low-mass X-ray binary EXO 0748-676 in its low state; Bassa et al. 2009). Similar spectra were also obtained by Torres et al. (2014) for the X-ray sources from the Galactic Bulge Survey identified as low-mass X-ray binaries in their low state.
The total number of photons registered by Chandra from the error circle of AX J173548-3207 is too small (46) to carry out detailed studies of its X-ray spectrum. It can only be said that its slope is typical of low-mass X-ray binaries and is consistent with the ASCA measurements (Sugizaki et al. 2001).
The flux measured by Chandra turns out to be a factor of lower than that measured by ASCA. The same can also be said about the absorption column density: our measurements give a value that is a factor of lower than the ASCA ( vs in units cm-2), However, the accuracy of both these measurements is low, and they formally differ only by .
The APASS444http://www.aavso.org/apass and 2MASS (Skrutskie et al. 2006) photometry allows one to set limits on the temperature of emitting region (most likely an accretion disk), К and the interstellar reddening in the spectrum , which corresponds to a heliocentric distance of less than 2 kpc (Lallement et al. 2014).
3.2 AX J173628-3141
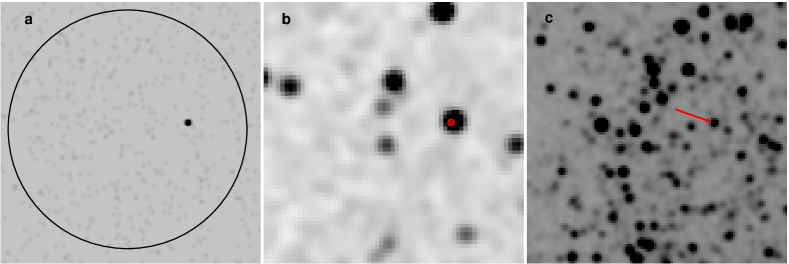
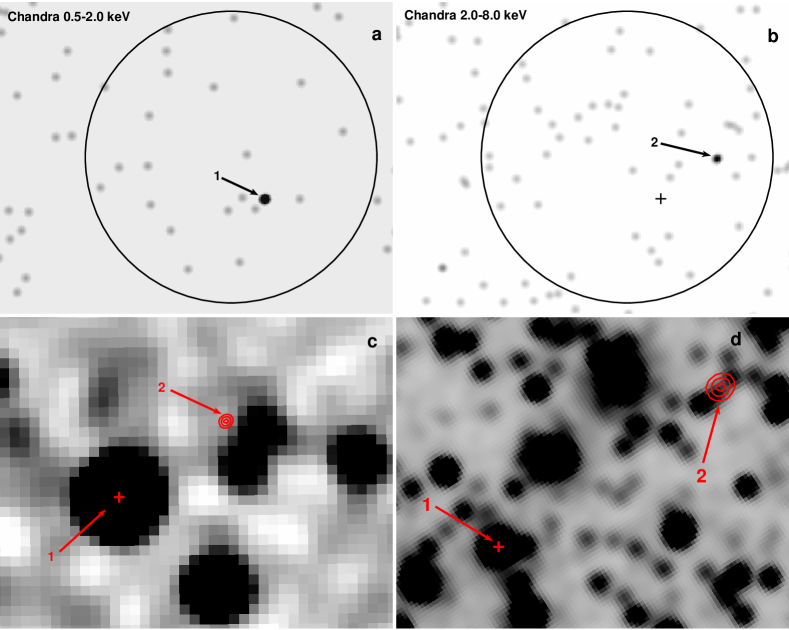
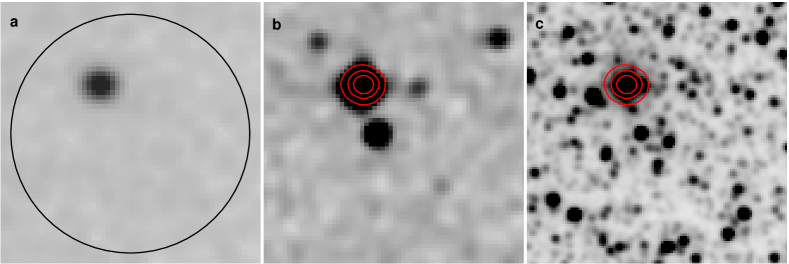
Chandra detected two X-ray sources in the error circle of AX J173628-3141 (Fig.5; see also Anderson et al. 2014). These objects differ significantly in their spectral properties, as can be clearly seen from the comparison of the X-ray images in the 0.5–2 and 2–8 keV energy bands (Fig.5a,b). One of them has a soft X-ray spectrum typical of the emission from coronally active stars (see, e.g., Gudel 2004). This source coincides with the bright optical star 2MASS J17362729-3141234 (), which spectrum was taken at RTT-150. The shape of the source’s spectrum allows it to be identified with a G giant () with a surface temperature К (Fig.6). A similar estimate of the stellar temperature K was obtained by Ammons et al. (2006) from the model fit to Tycho and 2MASS photometry. The object’s small proper motion in the sky, mas yr -1 (Roeser et al. 2010), points to a large distance to it, more than several hundred parsecs (see, e.g., the correlations between the proper motions and distances of objects in Warwick 2014).
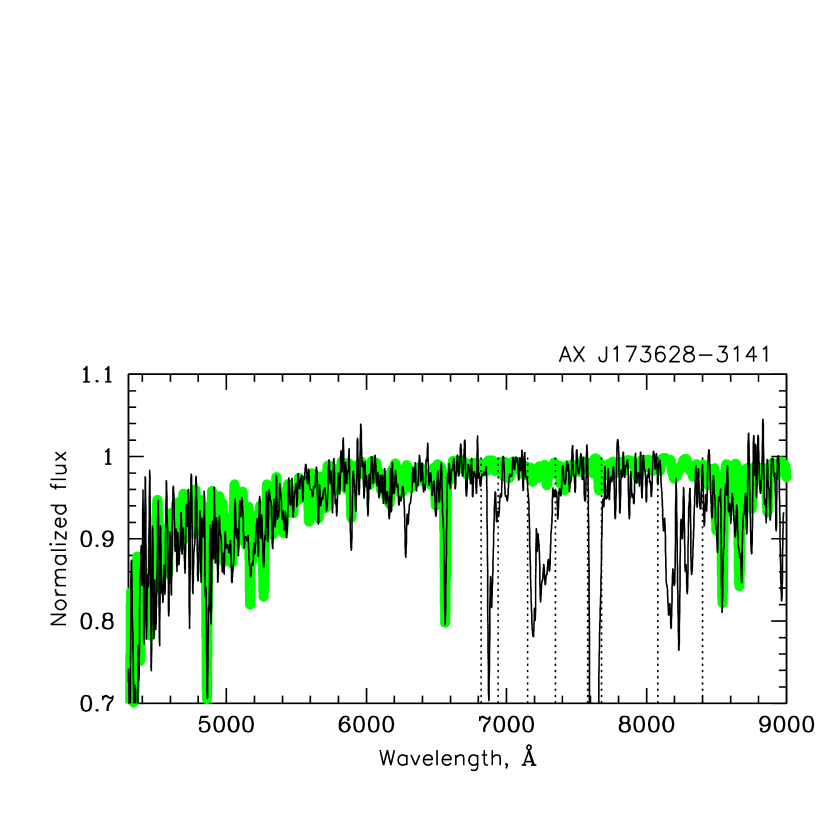
We can attempt to determine the distance D to a source by the so-called spectroscopic parallax technique, i.e., by spectroscopically estimating the stellar radius and comparing the estimated luminosity of the star with its observed flux corrected for interstellar extinction. For the source being discussed, , where – is the solar radius. Using model stellar atmospheres from Kurucz’s library555http://www.stsci.edu/hst/observatory/crds/ k93models.html, we can estimate the ratio . Thus, the distance to the source can be estimated as kpc. To refine the result obtained, it is necessary to carry out more detailed spectroscopic observations with a better spectral resolution. At a distance of 1.4 kpc, the source’s X-ray flux erg s-1 cm-2 corresponds to a luminosity erg s-1. Thus, the source is most likely an RS CVn object, a binary system where the mutual tidal influence of the stars allows the convective envelope of the giant star to be continuously spun, producing an extended corona that is an origin of X-ray emission (Walter and Bowyer 1981; Dempsey et al. 1993; Sazonov et al. 2006).
The second X-ray source detected by Chandra in the error circle of AX J173628-3141, has a considerably harder spectrum or significant absorption: all photons from it are registered by Chandra at energies above 2 keV, while it has the largest effective area at energies below 2 keV. The source’s spectrum can be satisfactorily (given the poor statistics, because only five photons were recorded from the source) described by a power-law energy dependence of the photon flux density with photoabsorption with a column density cm-2.
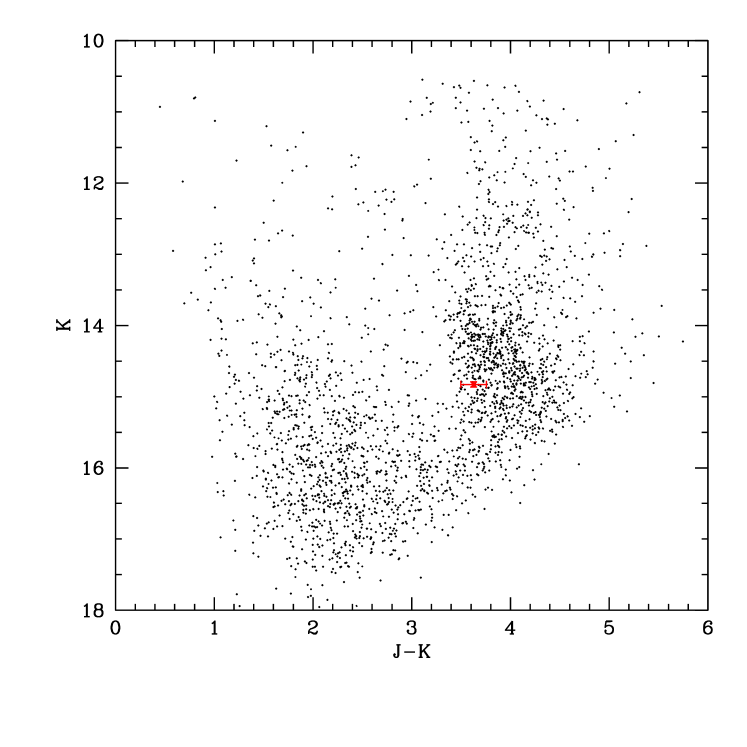
We investigated the properties of the second putative counterpart to AX J173628-3141 in the infrared using the public VVV/ESO Galactic Bulge Survey data. To achieve a higher accuracy of determining the photometric magnitudes in such a crowded sky field, we processed the VVV observations by the methods of PSF-photometry. For this purpose, we used the standard DAOPHOTII package and took 2MASS as a reference catalog to obtain the photometric solution. As a result, we obtained the object’s magnitudes in three bands: , , . It can be seen from the color–magnitude diagram (Fig.7), constructed for a 2 neighborhood of the studied object that it is close to the positions of red giants in the Galactic center region and, thus, may be at a distance of pc. Taking into account a very significant absorption in the source’s X-ray spectrum, it can be suggested that the source is a symbiotic binary: a white dwarf accreting matter from the stellar wind of its companion, a red giant.
Deep Chandra or XMM-Newton X-ray observations with the goal of accurately measuring the spectrum of this object and primarily the absorption column density are needed to ultimately establish its nature.
3.3 AX J1739.5-2910
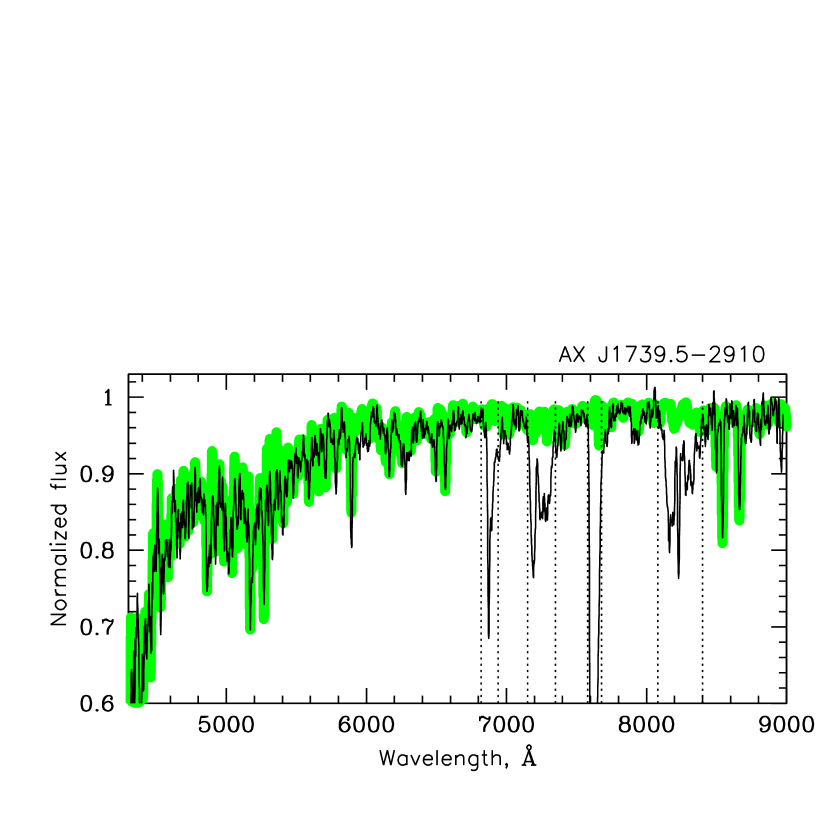
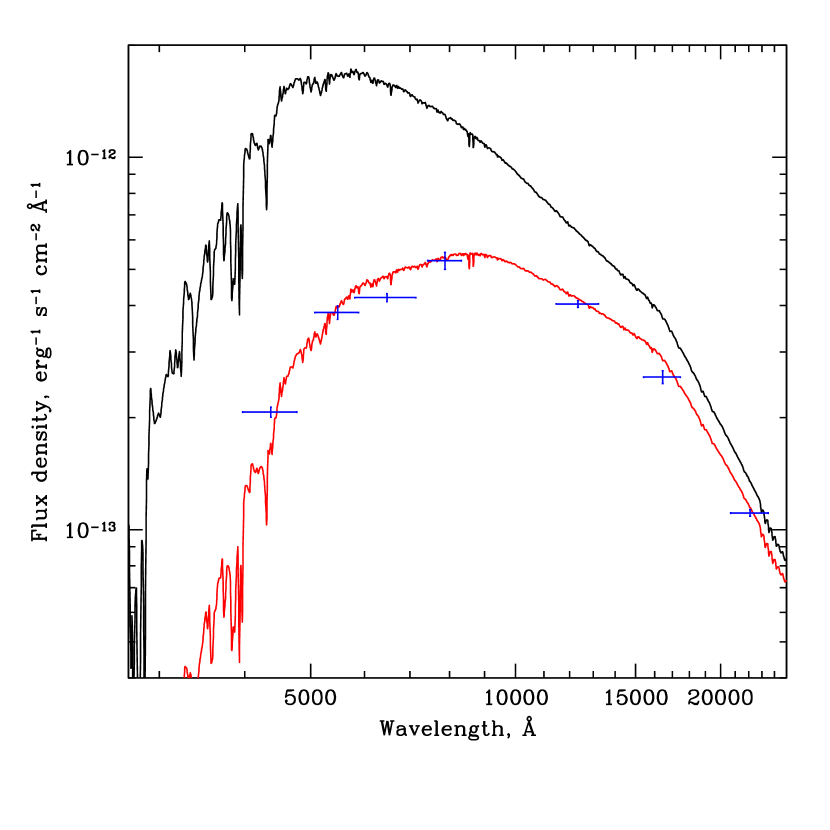
The sky field around the X-ray source АХ J1739.5-2910 was observed by Chandra (Evans et al. 2010), which allowed its astrometric position to be improved (Fig. 8). There is only one optical (or infrared) object – 2MASS J17393122-2909532 in the error circle of the source detected by Chandra. To determine the nature of this object, we analyzed the set of its photometric measurements in the APASS surveys (Henden et al. 2012) and took its optical spectrum at RTT-150 (Fig.9). The spectral features visible in this spectrum allow the type of the star to be reliably determined, a G–K giant with K and (see also Torres et al. 2006). Our photometry for the object points to a certain reddening (due to interstellar extinction), (Fig.9) in the spectrum.
It can be concluded from the data obtained that we most likely deal with a giant К1–2 III star at a distance of pc (the stellar radius estimate is and the ratio ). At such a distance, the necessary reddening can already be accumulated toward the Galactic Center (see, e.g., Lallement et al. 2014). It should be noted that similar estimates of the spectral type and distance to this optical star were obtained by Pickles and Depagne (2010) without any relation to X-ray observations.


The source was observed several times by Chandra and XMM-Newton in the X-ray energy band, which allowed its spectrum and X-ray flux to be measured at different times. It can be seen from the table that the source flux is virtually the same in all energy bands, as is the shape of its spectrum. Moreover, the results of our measurements agree well with those of the ASCA ones. The registered flux erg s-1 cm-2 at a distance pc corresponds to a luminosity erg s-1. Note that AX J1739.5-2910 is one of the brightest objects detected during the Chandra Galactic Bulge Survey (the source was designated as CX4=CXOGBS J173931.2–290952 in this survey; Hynes et al. 2012). In addition, an optical variability of this source with a period of about 16 days was observed (Pojmanski 2002; Hynes et al. 2012), suggesting that this object belongs to the class of Xray- active RS CVn binaries.
3.4 AX J1740.4-2856
AX J1740.4-2856, detected by ASCA can be unambiguously identified with the X-ray source detected by ХММ-Newton in its error circle, 3XMM J174023.9-285652 (from the 3XMM-DR4 survey). This position allows it to be associated with the optical/infrared object 2MASS J17402384-2856527 (Fig.10). It is important to note that the source is detected with confidence in the 0.5–2 keV energy band and is absent in harder X-rays (Figs.10a,b), directly suggesting that its spectrum is soft. Indeed, the latter can be described by the model of a multi-temperature plasma with a maximum temperature KeV. Such a spectral shape is typical of the emission from coronally active stars. Note that the X-ray flux measured during two XMM-Newton observations is a factor of lower than that detected previously by ASCA.
The optical spectrum of this source obtained at RTT-150 is shown in Fig.11.It can be described by the model of emission from an early-M star with K with a poorly determined luminosity class, .
The APASS and 2MASS photometric brightness measurements for the object give an estimate of the ratio of the star’s radius to its distance ,and an interstellar reddening . The distance for a giant star would be more than 3–4 kpc toward the Galactic center, which would inevitably give rise to a significant reddening in the spectrum (Lallement et al. 2014); therefore, the star is most likely an ordinary M dwarf. In that case, assuming the typical radii of M0–2 stars to be , the distance to the star will be pc. For such a distance, the observed X-ray flux erg s-1 cm-2 corresponds to a luminosity erg s-1. The ratio of the source’s X-ray and infrared fluxes is typical for objects of this class (Agueros et al. 2009).
Interestingly, according to the Optical Monitoring Camera (OMC) observations onboard INTEGRAL, this source exhibited bright flares up to 9 in ; at the same time, the normal brightness of this source is (Alfonso-Garzón et al. 2012). Flares of such a brightness are occasionally observed in M dwarfs (Kowalski et al. 2009).
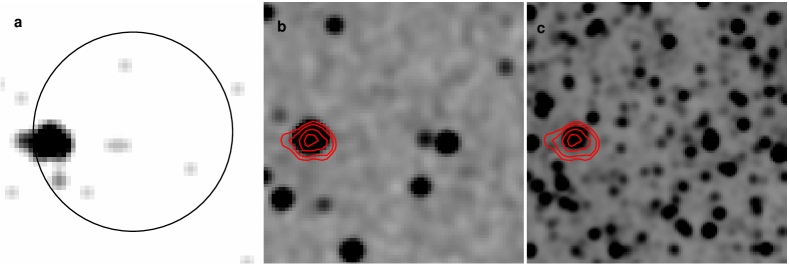
3.5 AX J1740.5-2937
The optical counterpart to AX J1740.5-2937 (2MASS J17403458-2937438) has been determined owing the detection of only one X-ray object within its error circle (Fig. 12), for which an accurate astrometric position was obtained (Evans et al. 2014). Its optical spectrum measured at RTT-150 (Fig. 13), is satisfactorily described by the model of a G subgiant () with a temperature К.
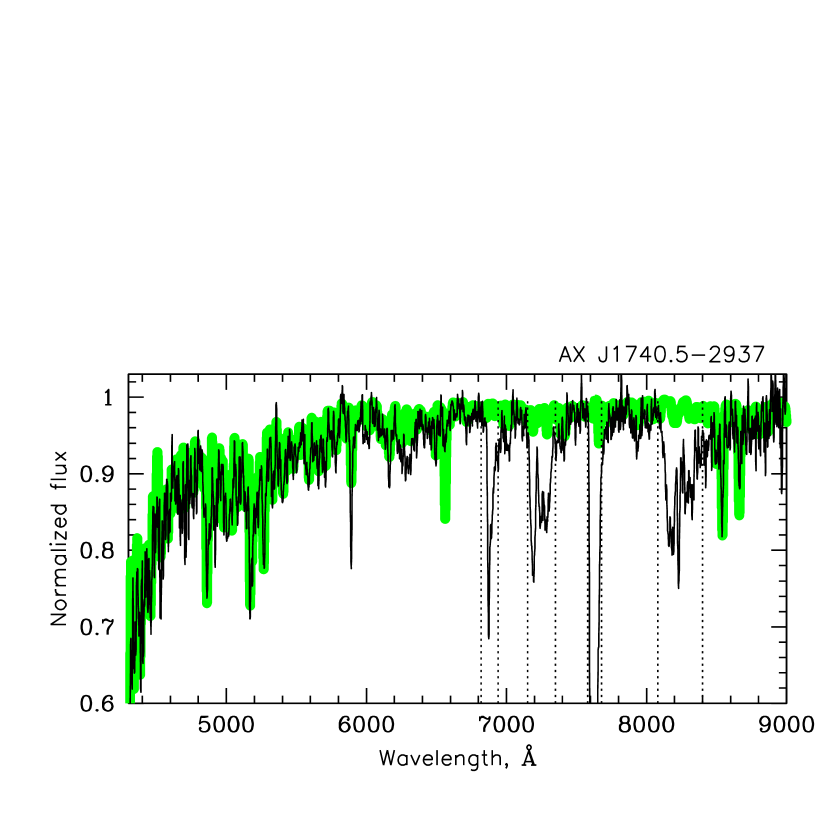
The fit to the photometric measurements from Pickles and Depagne (2010) gives an estimate of the spectral type of the star as K2V at a distance of 91 pc. To all appearances, such a result stems from the fact that these authors disregarded the interstellar reddening, which led to an underestimate of the stellar temperature. Our fit to the photometric measurements from APASS and 2MASS by the model of a star with a temperature of 5400 K allows us to estimate the interstellar reddening, (consistent with the estimates of the column density from the interstellar photoabsorption in X-ray data; see the table), and the ratio of the distance to the star to its radius, . At the star’s radius the distance to it turns out to be pc.
For such a distance, the source’s X-ray flux erg s-1 cm-2 corresponds to a luminosity erg s-1 in the 0.5–10 keV energy band. Note that, according to the ASCA data, the flux from the source was approximately the same ( erg s-1 cm-2 in the 0.7–10 keV energy band), while the spectrum had a slope of 4.6. In our work, we used the more physical model of a multi-temperature plasma with a maximum temperature keV (see the table) to fit the spectrum.
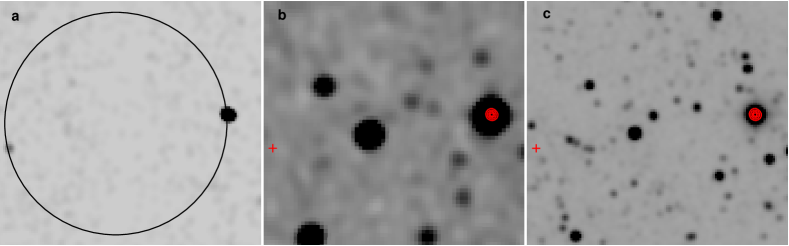
3.6 AX J1743.9-2846
AX J1743.9-2846 fell several times within the Chandra and ХММ-Newton fields of view, which allowed its astrometric position to be improved (Evans et al. 2010). Two relatively bright sources were detected within a circle 50 in radius, with both being virtually at its edge (Fig.14). One of these objects (CXO J174351.3-284637 = 3ХММ J174351.2-284637 = 1SXPS J174351.2-284636) is brighter than the other approximately by a factor of 10, suggesting that it corresponds to AX J1743.9-2846. The source CXO J174351.3-284637, in turn, coincides with the bright star 2MASS J17435129-2846380, whose photometry makes it possible to estimate its spectral type, К3 III, and distance, kpc (Pickles and Depagne 2010).
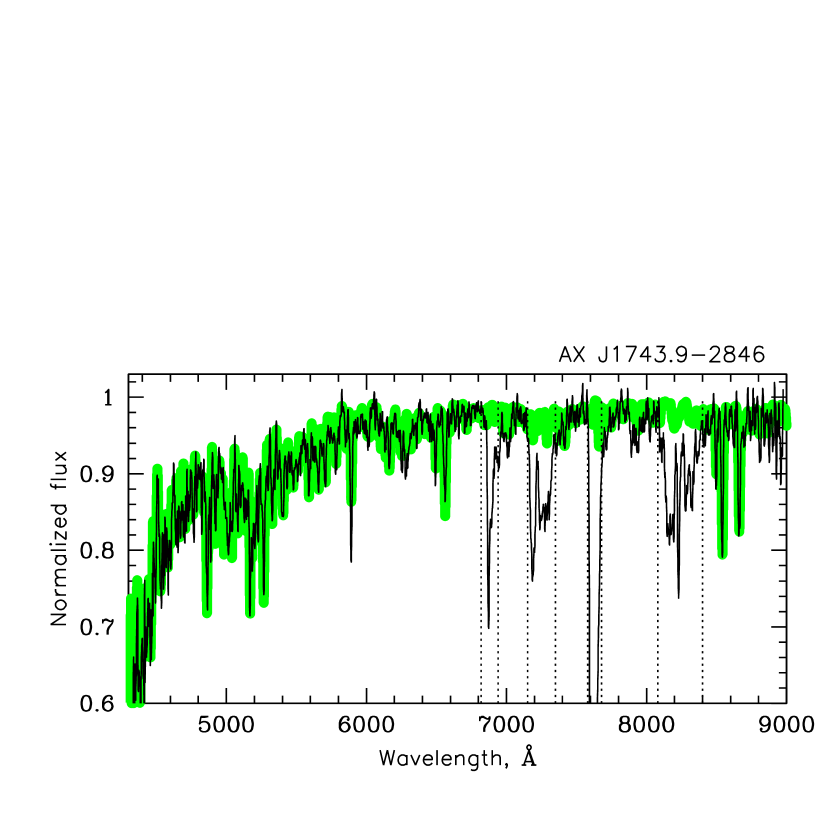
Our RTT-150 spectroscopy (Fig.15), points to a slightly higher stellar temperature, 5350 K, and a surface gravity . As with the preceding source AX J1740.5-2937, this may be because the stellar temperature estimate obtained from the photometry of bright stars disregards the possible contribution of interstellar reddening. In our case, we can estimate the interstellar reddening as and the ratio . For the star’s estimated radius the distance to it will be pc.
The source’s X-ray spectrum can be well described by a power law with a break modified by absorption at low energies (see Fig. 2 and the table). During the ASCA observations, AX J1743.9-2846 exhibited a significant flux variability (from to erg s-1 cm-2 in the 0.7-10 keV energy band). The Chandra and XMM-Newton observations show that the flux from the source and its variability amplitude were considerably lower than those during the ASCA observations (see the table). At the same time, the shape of the spectrum and its parameters determined from Chandra and XMM-Newton data are similar (except for the observation 0112971201, where the parameters turned out to be slightly different, but the significance of this difference is low because of insufficient statistics).
The XMM-Newton and Chandra X-ray fluxes correspond to a luminosity erg s-1, for a distance to the source of 1.1 kpc and erg s-1 for a distance of 0.5 kpc. For RS CVn stars, the X-ray luminosity we derived is at the brightest edge of the distribution; in particular, it can be higher than the X-ray luminosity of known RS CVn binaries within 50 pc of the Sun (see, e.g., Makarov 2003).
4 CONCLUSIONS
In this paper, we analyzed the X-ray and optical observations of six sources from the ASCA Galactic Center and Galactic plane surveys: AX J173548-3207, AX J173628-3141, AX J1739.5-2910, AX J1740.4-2856, AX J1740.5-2937, and AX J1743.9-2846. These surveys are presently the deepest largearea (about 45 square degrees) surveys performed by focusing X-ray telescopes at energies above 2 keV, the energy band that is weakly affected by interstellar photoabsorption. We obtained an unambiguous identification for five of the six objects; accurate Chandra X-ray measurements for one more object (AX J173628-3141) reveal two X-ray sources within its localization region (soft and hard) of comparable brightness in the 0.5–8 keV energy band. Three of the five sources with an unambiguous identification are active G–K stars, presumably RS CVn binaries. One of the two objects in the error circle of AX J173628-3141 is a coronally active G star, while the other object is a symbiotic star, a red giant with an accreting white dwarf, presumably located in the Galactic center region. AX J1740.4-2856 is a coronally active red M0-2 dwarf; one more source, AX J173548-3207, is presumably an X-ray binary in our Galaxy (most likely a low-mass one) in its low state. We estimated the distances and corresponding luminosities in the soft X-ray band (0.5–10 keV) for all sources, with none of them having been detected at a statistically significant level at energies >20 keV based on INTEGRAL data.
This work was supported by the Russian Science Foundation (grant 14-22-00271). We used the data retrieved from the archives of the Goddard Space Flight Center (NASA) and the European Southern Observatory. We thank TUBITAK (Turkey), the Space Research Institute of the Russian Academy of Sciences, and the Kazan Federal University for their support in using the Russian–Turkish 1.5-m telescope (RTT-150). We are grateful to E.M. Churazov, who developed the IBIS/INTEGRAL data analysis methods and provided the software. V.V. Shimansky and I.F. Bikmaev thank the Russian Foundation for Basic Research (project no. 13-02-00351) for partial support.
REFERENCES
Agüeros M. A., Anderson S. F., Covey K., Hawley S., Margon B., Newsom E., Posselt B., Silvestri N., et al., ApJS 181, 444, (2009)
Alfonso-Garzón J., Domingo A., Mas-Hesse J. M., Giménez A., A&A 548, A79, (2012)
Ammons S. M., Robinson S. E., Strader J., Laughlin G., Fischer D., Wolf A., ApJ 638, 1004, (2006)
Anderson G. E., Gaensler B., Kaplan D., Slane P., Muno M., Posselt B., Hong J., Murray S., et al., ApJS 212, 13, (2014)
Bassa C. G., Jonker P. G., Steeghs D., Torres M. A. P., MNRAS 399, 2055, (2009)
Baumgartner W., Tueller J., Markwardt C., Skinner G., Barthelmy S., Mushotzky R., Evans P., Gehrels N., ApJS 207, 19, (2013)
Bodaghee A., Tomsick J. A., Rodriguez J., James J. B., ApJ 744, 108, (2012)
Churazov E., Sunyaev R., Isern J., Knödlseder J., Jean P., Lebrun F., Chugai N., Grebenev S., et al., Nature 512, 406, (2014)
Degenaar N., Starling R., Evans P., Beardmore A., Burrows D., Cackett E., Campana S., Grupe D., et al., A&A 540, A22, (2012)
Dempsey R. C., Linsky J. L., Fleming T. A., Schmitt J. H. M. M., ApJS 86, 599, (1993)
Ebisawa K., Tsujimoto M., Paizis A., Hamaguchi K., Bamba A., Cutri R., Kaneda H., Maeda Y., et al., ApJ 635, 214, (2005)
Evans I. N., Primini F. A., Glotfelty K. J., Anderson C., Bonaventura N., Chen J. C., Davis J. E.; Doe S., et al., ApJS 189, 37 (2010)
Evans P. A., Osborne J., Beardmore A., Page K., Willingale R., Mountford C., Pagani C., Burrows D., et al., ApJS 210, 8, (2014)
Grimm H.-J., Gilfanov M., Sunyaev R., A&A 391, 923, (2002)
Güdel M., A&ARv 12, 71, (2004)
Hands A. D. P., Warwick R. S., Watson M. G., Helfand D. J., MNRAS 351, 31, (2004)
Henden A. A., Levine S. E., Terrell D., Smith T. C., Welch D., JAVSO 40, 430, (2012)
Hynes R., Wright N., Maccarone T., Jonker P., Greiss S., Steeghs D., Torres M. A. P., Britt C., et al., ApJ 761, 162, (2012)
Kim D.-W., Cameron R., Drake J., Evans N. R., Freeman P., Gaetz T., Ghosh H., Green P., et al., ApJS 150, 19, (2004)
Kowalski A. F., Hawley S. L., Hilton E. J., Becker A. C., West A. A., Bochanski J. J., Sesar B., AJ 138, 633, (2009)
Krivonos R., Revnivtsev M., Lutovinov A., Sazonov S., Churazov E., Sunyaev R., A&A 475, 775, (2007)
Krivonos R., Revnivtsev M., Tsygankov S., Grebenev S., Churazov E., Sunyaev R., A&A 519, A107 (2010)
Krivonos R., Tsygankov S., Lutovinov A., Revnivtsev M., Churazov E., Sunyaev R., A&A 545, A27, (2012)
Lallement R., Vergely J.-L., Valette B., Puspitarini L., Eyer L., Casagrande L., A&A 561, A91, (2014)
Lutovinov A., Revnivtsev M., Gilfanov M., Shtykovskiy P., Molkov S., Sunyaev R., A&A 444, 821, (2005)
Lutovinov A. A., Revnivtsev M. G., Tsygankov S. S., Krivonos R. A., MNRAS 431, 327, (2013)
Makarov V. V., AJ 126, 1996, (2003)
Pickles A., Depagne É., Publ. Astron. Soc. Japan 122, 1437, (2010)
Pojmanski G., AcA 52, 397, (2002)
Revnivtsev M., Sazonov S., Jahoda K., Gilfanov M., A&A418, 927, (2004)
Revnivtsev M., Lutovinov A., Churazov E., Sazonov S., Gilfanov M., Grebenev S., Sunyaev R., A&A 491, 209, (2008)
Revnivtsev M., Sazonov S., Churazov E., Forman W., Vikhlinin A., Sunyaev R., Nature 458, 1142 (2009)
Roeser S., Demleitner M., Schilbach E., AJ 139, 2440, (2010)
Sazonov S., Revnivtsev M., Gilfanov M., Churazov E., Sunyaev R., A&A 450, 117, (2006)
Sakano M., Koyama K., Murakami H., Maeda Y., Yamauchi S., ApJS 138, 19, (2002)
Saxton R. D., Read A. M., Esquej P., Freyberg M. J., Altieri B., Bermejo D., A&A 480, 611, (2008)
Skrutskie M., Cutri R., Stiening R., Weinberg M., Schneider S., Carpenter J., Beichman C., Capps R., et al., AJ 131, 1163, (2006)
Sugizaki M., Mitsuda K., Kaneda H., Matsuzaki K., Yamauchi S., Koyama K., ApJS 134, 77, (2001)
Torres C. A. O., Quast G. R., da Silva L., de La Reza R., Melo C. H. F., Sterzik M., A&A 460, 695, (2006)
Torres M. A. P., Jonker P., Britt C., Johnson C., Hynes R., Greiss S., Steeghs D., Maccarone T., et al., MNRAS 440, 365, (2014)
Voges W., Aschenbach B., Boller Th., Brüninger H., Briel U., Burkert W., Dennerl K., Englhauser J., et al., A&A 349, 389, (1999)
van den Berg M., Hong J. S., Grindlay J. E., ApJ 700, 1702, (2009)
Wang Q. D., Gotthelf E. V., Lang C. C., Nature 415, 148, (2002)
Walter F. M., Bowyer S., ApJ 245, 671, (1981)
Warwick R. S., MNRAS 445, 66, (2014)
Winkler C., Courvoisier T.J.-L., Di Cocco G., Gehrels, N., Gimenez, A., Grebenev, S., Hermsen, W., Mas-Hesse, J. M., Lebrun, F., et al., Astron. Astrophys. 411, L1 (2003)