A combined limit for neutrinoless double-beta decay
Pawel Guzowski,
School of Physics and Astronomy
University of Manchester
Manchester M13 9PL, UK
To appear in the proceedings of the Prospects in Neutrino Physics Conference, 15 – 17 December, 2014, held at Queen Mary University of London, UK.
1 Introduction
The search for neutrinoless double-beta decay is important in determining the Majorana nature of the neutrino, and also in establishing if lepton number is violated. The half-life for this process is given by
| (1) |
where is a phase space factor and a nuclear matrix element (NME) factor (both these factors depend on the nuclear isotope), the electron mass, and the effective neutrino mass.
In recent years five experiments have published results of their searches: CUORICINO (observing 130Te) [1], EXO (136Xe) [2], GERDA (76Ge) [3], KamLAND-Zen (136Xe) [4], and NEMO-3 (100Mo) [5]. There has been no previous attempt to systematically combine the limits of their searches using their measured energy distributions. Presented here is the first such combination, divided into two sections: first a cross check of the individual experimental results, showing that the method can replicate their limits, and then the combination of all five experiments.
The results of this analysis are published in Ref. [6].
2 Individual experiments
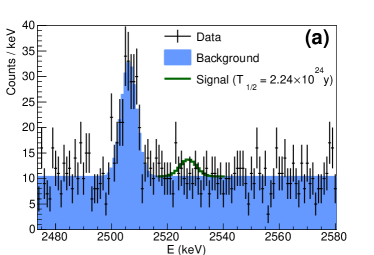
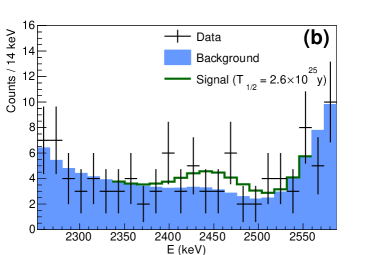
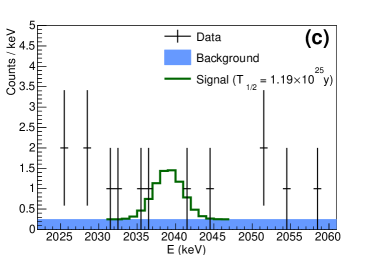
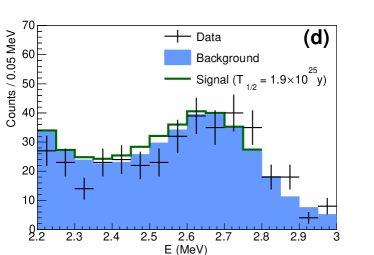
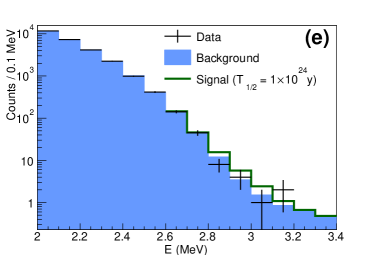
The input background, signal and data energy distributions for each experiment, along with the systematic uncertainties, are taken from their publications [1, 2, 3, 4, 5], and are shown in Figure 1.
| 90% CL lower limit on y) | ||||
| Experiment | Published | Observed | Expected | range |
| CUORICINO | 2.8 | 2.8 | 2.9 | 2.0 – 4.2 |
| EXO | 11 | 13 | 21 | 14 – 30 |
| GERDA | 21 | 20 | 21 | 14 – 29 |
| KamLAND-Zen | 19 | 17 | 11 | 7 – 15 |
| NEMO-3 | 1.1 | 1.1 | 0.9 | 0.6 – 1.4 |
Using these distributions and the signal normalisations, the observed 90% CL lower half-life limits can be calculated, and are shown in Table 1, along with the experiments’ published limits, and the expected limits from these distributions (both median expected and the ranges). Overall the calculated limits agree well with the published limits, validating both the method and the use of these distributions in the combination.
3 Combination
As the experiments use different isotopes, their half-life limits cannot be directly combined. Instead the limits are calculated for a common and translated to the signal normalisation in each experiment’s energy distribution using Equation 1, with the values of and taken from recent calculations [7, 8, 9, 10, 11, 12]. The limit is calculated for each NME model seperately.
| NME model | Improvement | value | |||
|---|---|---|---|---|---|
| (meV) | (meV) | Limit | Sensitivity | (HM) | |
| GCM [8] | 130 | 130 | 12% (K) | 8% (E) | 0.001 |
| IBM-2 [9] | 190 | 180 | 15% (K) | 12% (E) | 0.023 |
| NSM [10] | 310 | 290 | 13% (K) | 10% (E) | 0.004 |
| QRPA [11] | 190 | 180 | 26% (K) | 22% (E) | 0.095 |
| (R)QRPA [12] | 300 | 300 | 20% (G) | 19% (G) | 0.39 |
Table 2 shows the 90% CL upper limit on fo each NME calculation, and also shows the improvement in the mass limit over the best individual experiment in that NME model. There can be an improvement of up to in the mass limit, which corresponds to an increase of exposure of a factor of up to . The combined mass limit ranges from meV, depending on the NME model.
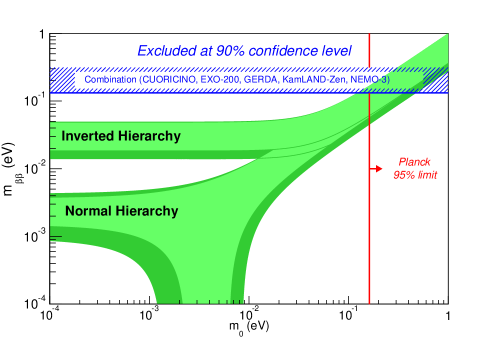
This limit is shown in Figure 2, in the context of the allowed regions depending on the neutrino mass hierarchy and the lightest neutrino mass eigenstate.
We also compare these mass limits (translated back into half-life limits of 76Ge) to the positive claim for neutrinoless double-beta decay of 76Ge in the Heidelberg-Moscow experiment, which measuread y [13]. The level of compatability of the limits with respect to this claim varies strongly with the NME model used, with values ranging from 0.001–0.4.
4 Summary
A first direct combination of neutrinoless double-beta decay experiments on multiple isotopes has been performed, yielding an upper limit on the effective neutrino mass of meV. The combination can improve the limits on the effective neutrino mass by up to compared to the best individual experiment, depending on the choice of NME model. The compatibility of the combined limits with respect to the claimed observation of neutrinoless double-beta decay in the Heidelberg-Moscow experiment also varies significantly depending on the NME calculations chosen.
References
- [1] E. Andreotti et al. (CUORICINO Collaboration), Astropart. Phys. 34 (2011) 822.
- [2] J. B. Albert et al. (EXO-200 Collaboration), Nature 510 (2014) 229.
- [3] M. Agostini et al. (GERDA Collaboration), Phys. Rev. Lett. 111 (2013) 122503.
- [4] A. Gando et al. (KamLAND-Zen Collaboration), Phys. Rev. Lett. 110 (2013) 062502.
- [5] R. Arnold et al. (NEMO-3 Collaboration), Phys. Rev. D 89 (2014) 111101(R)
- [6] P. Guzowski, L. Barnes, J. Evans, G. Karagiorgi, N. McCabe, and S. Söldner-Rembold, arXiv:1504.03600 [hep-ex] (2015), Submitted to Phys. Rev. D.
- [7] J. Kotila and F. Iachello, Phys. Rev. C 85 (2012) 034316.
- [8] T. R. Rodriguez and G. Martinez-Pinedo, Phys. Rev. Lett. 105 (2010) 252503.
- [9] J. Barea, J. Kotila, and F. Iachello, Phys. Rev. C 91 (2015) 034304.
- [10] J. Menendez, A. Poves, E. Caurier, and F. Nowacki, Nucl. Phys. A 818 (2009) 139.
- [11] F. Šimkovic, V. Rodin, A. Faessler, and P. Vogel, Phys. Rev. C 87 (2013) 045501.
- [12] A. Faessler, G. Fogli, E. Lisi, V. Rodin, A. Rotunno, and F. Šimkovic, Phys. Rev. D 79 (2009) 053001.
- [13] H. Klapdor-Kleingrothaus and I. Krivosheina, Mod. Phys. Lett. A 21 (2006) 1547.