Quantum Oscillations and Magnetic Reconstruction in the Delafossite PdCrO2
Abstract
We report quantum oscillation data on the metallic triangular antiferromagnet PdCrO2. We find that, to very high accuracy, the observed frequencies of PdCrO2 can be reproduced by reconstruction of the (nonmagnetic) PdCoO2 Fermi surface into a reduced zone. The reduced zone corresponds to a magnetic cell containing six chromium sites, giving a in-plane reconstruction, and interplane reconstruction. The interplane ordering represents a reduction in lattice symmetry, possibly to monoclinic, and an associated lattice distortion is expected. In addition, we report a magnetic transition under an applied in-plane field that is probably equivalent to the spin-flop transition reported for CuCrO2, and present data on its field-angle dependence. We also report measurements of the resistivity of PdCrO2 up to 500 K.
Magnetic ions coordinated on a triangular lattice often yield interesting magnetic properties. A prominent example is the insulating CrO2 sheet, stabilised in materials like LiCrO2 and PdCrO2. In these compounds, the Cr formal charge is , and its configuration is . The crystal field at the Cr sites is nearly octahedral, inducing a gap between the quasi- (, , and ) and quasi- ( and ) bands. The quasi- levels are therefore half-filled, and the CrO2 sheet is a Mott insulator: strong Hund’s rule coupling aligns the spins on each Cr site, giving a total spin on each Cr site of nearly . The CrO2 sheet is a Heisenberg system, that orders at low temperatures into the triangular Néel phase.
Of materials containing such a CrO2 sheet, AgCrO2, CuCrO2, and PdCrO2 have the delafossite crystal structure, while LiCrO2, NaCrO2, and KCrO2 have the closely-related ordered rock salt structure. All of these systems show order, with the Néel temperature depending strongly on the Cr-Cr spacing. The ordered rock salt structure gives substantially smaller interplane spacings than the delafossite structure, and somewhat higher Néel temperatures. Takatsu14
The interlayer order is a more subtle problem than the intralayer order: in all of these systems the Cr sheets are stacked rhombohedrally, so the molecular fields from first- and second-neighbouring layers cancel. However the interlayer order has observable consequences: AgCrO2 and CuCrO2 show spin-driven ferroelectricity, while NaCrO2 and LiCrO2 do not. Seki08 AgCrO2 and CuCrO2 have the delafossite structure and NaCrO2 and LiCrO2 the ordered rock salt structure, but the more essential difference appears to be the interlayer order: in AgCrO2 Oohara94 and CuCrO2 Kadowaki90 ; Frontzek12 , the interlayer ordering is ferroic, in that the vector chirality, the rotational sense of the spin helices that comprise the phase, is the same in all layers. In LiCrO2, in contrast, neutron scattering data suggest that the vector chirality alternates from layer to layer Kadowaki95 , while the interplane order of NaCrO2 is not clear. Hsieh08
This paper focuses on PdCrO2. The Néel temperature of PdCrO2 is K, and, like LiCrO2, the vector chirality probably alternates from layer to layer, Takatsu09 ; Takatsu14 so this feature is not restricted to the ordered rock salt structure.
Whereas the other compounds discussed above are insulators, PdCrO2 is a metal, due to conduction in the Pd sheets. The isostructural, nonmagnetic compound PdCoO2 also has these Pd sheets, and its carrier mobility was found to exceed that of copper. Hicks12 PdCrO2 therefore is an interesting system, comprised of highly-conducting sheets interleaved with Mott insulating spacer layers. It would be interesting to determine whether the metallic Pd conduction has any effect on the magnetic order.
What is certainly true is that the Pd conduction can be used as a probe of the magnetic order. Quantum oscillation Ok13 and angle-resolved photoemission spectroscopy (ARPES) Sobota13 ; Noh14 studies have shown that the PdCrO2 Fermi surfaces result from reconstruction of the PdCoO2 Fermi surface into the magnetic zone. Observation of an unconventional anomalous Hall effect in PdCrO2 indicates further that the Cr spins are not co-planar. Takatsu10UAHE
In this paper we present measurements of quantum oscillations in PdCrO2, and confirm the overall frequencies reported in Ref. Ok13 . We add greater resolution and a careful comparison with the nonmagnetic PdCoO2 Fermi surface: we show that reconstruction of the PdCoO2 Fermi surface reproduces most of the observed oscillation frequencies to very high accuracy; the PdCrO2 frequencies can be analyzed in detail without recourse to density functional theory calculations. We show that the magnetic coupling is -dependent: it is much weaker at than at . Also, the dominant magnetic scattering vectors are those corresponding to a 6-Cr magnetic unit cell giving a interplane reconstruction in addition to the in-plane reconstruction. The interplane order represents a reduction in lattice symmetry, from (rhombohedral) to, in the highest-symmetry case, (monoclinic).
We also report a magnetic transition under applied field, at a similar field to a spin flop transition reported in CuCrO2, that was observed in the course of measurement of the oscillations. Finally, we present measurements of the resistivity of PdCrO2 to high temperatures.
I Methods
Single crystals of PdCrO2 were grown by a NaCl flux method, using PdCrO2 powder synthesized via a solid-state reaction. Takatsu10crystalGrowth We measured magnetic oscillations in two samples of PdCrO2, by torque magnetometry, using the same piezoresistive AFM cantilevers as in our previous study on PdCoO2. Hicks12 ; Cantilever The cantilevers were mounted on rotatable platforms with integrated field angle sensors.
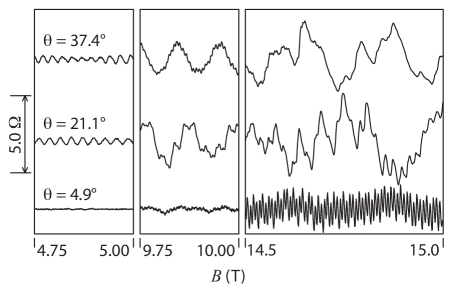
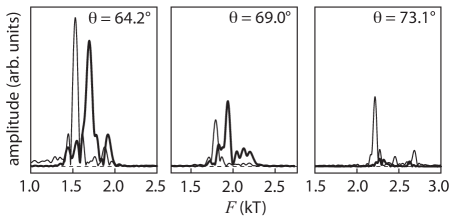
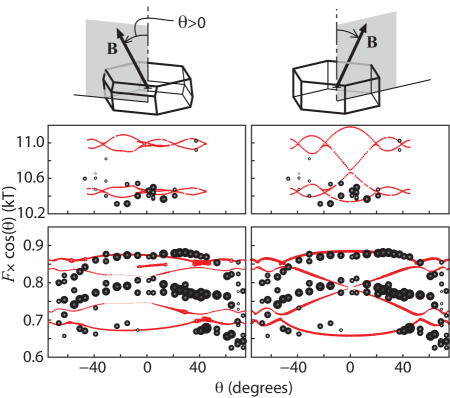
Sample #1 was roughly m, and sample #2 m. For sample #1 the field was rotated about a axis (using hexagonal indexing), and for sample #2 a axis; these axes are illustrated at the bottom right of Fig. 2. Some raw data for sample #1 are shown in Fig. 1. Low-frequency oscillations (800 T for field angle ) dominate the data. At 0.7 K, these oscillations were discernible at fields as low as 2 T. At high fields (above 10 T), the oscillation amplitude was very large, leading to strong torque interaction: the oscillations had a triangular form, and strong sum and difference frequencies appeared in the Fourier transforms. While torque interaction complicates the analysis somewhat, it may be difficult to avoid if the samples are to be large enough for higher-frequency oscillations to be resolved.
The oscillation amplitudes were history-dependent. Cooling the sample through in a 15 T field resulted in oscillation amplitudes for the , , and orbits roughly four times as large as with zero-field cooling. These large amplitudes persisted as long as the field was maintained. Releasing the field and heating the sample to 1 K caused the amplitudes to decrease, and re-applying fields up to 15 T did not recover the large amplitudes. The system therefore appears to be nonergodic. A possible origin of glassy behaviour is domain-boundary Cr spins: the relatively large magnetic unit cell of PdCrO2 means that a complex domain structure is likely.
For measurement of the temperature dependence of the oscillation amplitudes, we cooled the sample in a field and kept the field above 8 T at all times, to maintain large oscillation amplitudes. For measurement of the angle dependence of the frequencies, torque interaction was a greater concern, and the sample was cooled through in zero field. 111While measuring the angle dependence of the oscillations in sample #1, we performed a “de-Gauss” routine at the start of each run, in which the field was ramped to -2 T, then +1 T, then -0.5 T, and so on. The aim was to reduce the probability of the system evolving gradually into a more ordered state, with larger oscillation amplitudes, though it is not clear whether the procedure had much effect.
II Results: the oscillations
The oscillation frequencies as a function of field angle are shown in Fig. 2. Four sets of intrinsic peaks can be identified, located, at , at around 0.8, 3.5, 10.5, and 27.4 kT. Following Ref. Ok13 , we label these , , , and . All the frequencies scale broadly as , indicating that the Fermi surfaces are highly two-dimensional.
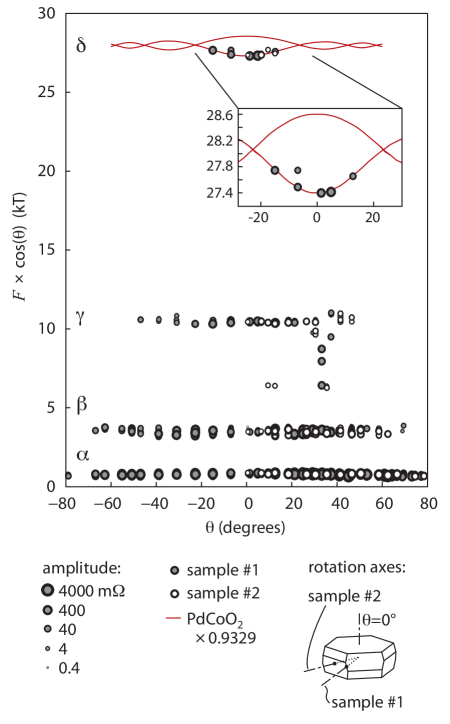
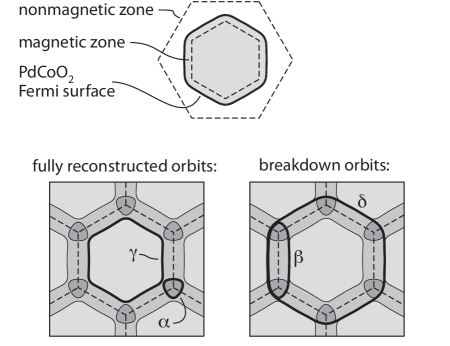
It has been established that the PdCrO2 orbits result from a reconstruction of the PdCoO2 Fermi surface, due to the 120∘ Néel order. Ok13 ; Noh14 This reconstruction is illustrated in Fig. 3. The and orbits are fully reconstructed orbits, while and result from magnetic breakdown, i.e. the orbits cross gaps in -space.
The cyclotron masses were determined for sample #1 by Lifshitz-Kosevich fits to the temperature dependence of the amplitudes. We analysed the data between 7.5 and 11.5 T, avoiding higher fields where torque interaction was very strong, and verified that within this range there was no systematic variation of the masses with field.
The masses obtained for the , , , and orbits are , , , and , respectively, the fits are shown in the Appendix. These are in good overall agreement with ARPES measurements. A Fermi velocity of 4.2 eV-Å was measured, by ARPES, at the corners of the nonmagnetic Fermi surface, and 4.9 eV-Å at the faces. Noh14 If an isotropic Fermi velocity of 4.6 eV-Å is taken along the perimeters of the , , , and orbits, masses of 0.34, 0.63, 1.00, and are obtained, respectively: the cyclotron masses from the Lifshitz-Kosevich fits are in very close agreement with the ARPES estimates for and , and 35% heavier for and . 222For calculation of the and expected masses, we use the and orbits.
Also shown in Fig. 2 are the PdCoO2 frequencies from the parametrised model in Ref. Hicks12 , for comparison with PdCrO2. To make the comparison, the PdCoO2 frequencies need to be scaled by the square of the ratio of in-plane lattice constants. We found that the best match is obtained with a scaling of 93.3%, which is very close to the expected scaling, (2.830 Å/2.923 Å)2 = 93.7%. Takatsu14 ; Takatsu07
From the comparison it is apparent that the lower branch of the PdCoO2 frequencies, arising from the neck orbit (i.e. the orbit), is visible in the PdCrO2 data, while the upper branch, from the belly orbit (), is not. This feature is part of a pattern that extends to the other frequencies: the observed breakdown frequencies derive from reconstruction of the nonmagnetic neck orbit, while the observed fully-reconstructed frequencies derive mainly from the belly orbit. The pattern is illustrated in Table I, which shows the observed PdCrO2 frequencies (for ) and the expected frequencies based on reconstruction of the PdCoO2 neck and belly orbits: the neck reconstruction yields the observed and frequencies, and the belly reconstruction and . (The frequencies comprise three sub-bands, , , and ; we will discuss this in more detail below.)
What this pattern means is that the belly orbit sees the magnetic order more strongly than the neck orbit. This is not surprising: the Cr sites are midway between the Pd sheets (which dominate conduction), and the Bloch states have zero weight at the planes of the Cr nuclei.
| observed frequencies (kT): | 0.87 | 3.45 | 10.52 | 27.40 |
|---|---|---|---|---|
| calc’d freq’s (kT): | 0.91 | 3.92 | 10.50 | 28.60 |
| calc’d freq’s (kT): | 0.69 | 3.36 | 11.27 | 27.40 |
Overall, then, a two-dimensional reconstruction of the PdCoO2 frequencies, where the reconstruction is weak at , gives a good description of the PdCrO2 frequencies at . We now test the reconstruction at other field angles by performing the full three-dimensional reconstruction.
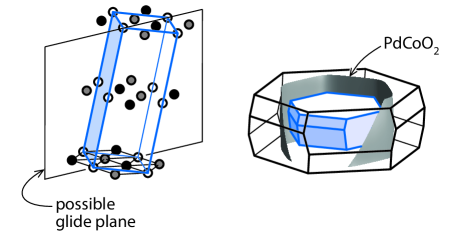
We first need a three-dimensional magnetic cell. It must contain at least six Cr sites: three per layer to capture the Néel order, and two layers to capture the alternating vector chirality. The cell we test is shown in Fig. 4. 333In Refs. Kadowaki95 (LiCrO2) and Takatsu14 (PdCrO2), single-crystal neutron scattering data are analyzed using an 18-site magnetic cell. This is the smallest that can preserve symmetry: to preserve symmetry the interplane ordering vector must take on all three possibilities in an ABCABC order, so six layers are required to capture both this and the alternating vector chirality. The resulting most-likely magnetic structure in Ref. Takatsu14 can be reduced to a six-site magnetic cell. The Cr sites are stacked rhombohedrally, so at there are three equivalent choices for the interplane ordering vector. In choosing one of them the lattice symmetry is reduced. The space group of the nonmagnetic lattice is . The highest-symmetry possible magnetic lattice has space group (base-centered monoclinic): reflection about the glide plane indicated in Fig. 4 reverses the vector chirality within each layer, and translation along the interplane ordering vector restores the original lattice. 444The unit cell shown in Fig. 4 is metrically triclinic — none of the angles are — but if the glide symmetry is preserved then a 12-site monoclinic supercell can be constructed. Magnetostructural coupling should lead to a lattice distortion associated with the reduction in symmetry, and it is possible that more subtle features in the magnetic order reduce the symmetry further.
The reconstruction is performed as described in textbooks: sections of the nonmagnetic Fermi surface are translated by combinations of reciprocal lattice vectors of the reduced zone until all portions of the original surface are represented within the reduced zone. For our nonmagnetic surface, we take the parametrised model for the PdCoO2 Fermi surface that was determined in Ref. Hicks12 . We do not include finite avoided crossings in our calculation, although the topology of the reconstructed Fermi surfaces is determined by the orientations of the avoided crossings that would occur in the real system. Further details of the calculation are given in the appendix. Our results are shown in Fig. 5, together with the observed frequencies.
There are two bands. The lower band, , derives from reconstruction of the belly orbit, and the neck orbit. is not observed in the data because the magnetic coupling is weak for the neck orbit.
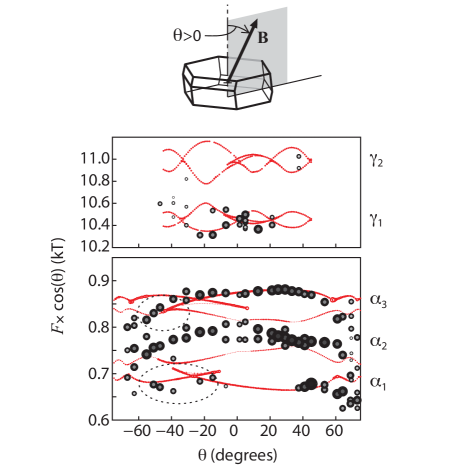
Three bands appear in the data. 555Ok et al also identify three bands. Ok13 However the frequencies they label and are both part of in our labelling scheme, and Ok et al do not resolve the frequency we label . The lower and upper bands, and , are reproduced well by the calculation. is from the nonmagnetic belly orbit and the neck orbit, so has a much lower amplitude in the data. The middle band, , is not reproduced in the calculations. It could be a breakdown orbit. There are prominent breakdown orbits in the data ( and ), and the interplane reconstruction could lead to breakdown orbits that mix segments from the original neck and belly orbits.
For this calculation we supposed that the system chose the interplane ordering vector that aligned the plane of (possible) glide symmetry with the field rotation plane. The other two possibilities would lead to the glide and rotation planes being separated by . We also calculated this possibility, with the result shown in the Appendix. The match to the data is reasonable but not as good, so it appears that either the glide and rotation planes were aligned by chance, or the fields applied during the measurement re-oriented the magnetic reconstruction.
We also show in the Appendix results for a strictly two-dimensional reconstruction, that would preserve the symmetry of the nonmagnetic lattice. The results do not match the data well, and we conclude that the dominant magnetic scattering vectors are those of the magnetic cell shown in Fig. 4.
III Spin flop transition
In addition to quantum oscillations, a large-scale feature appeared during the torque magnetometry measurements on sample #1: a first-order magnetic transition. It occurs at a field of around 6.5 T for (i.e. the field applied in the plane). On the high-field side of the transition the sample has a much larger -axis magnetic moment than on the low-field side. Fig. 6 shows the set of torque curves obtained in this study, divided by the applied field to yield , the magnetisation perpendicular to the applied field, and smoothed so as to exclude the oscillations and show the broad-scale features. The transition and its hysteresis are readily apparent, at . It appeared for sample #1 but not #2, so it is sensitive to the direction of the applied field.
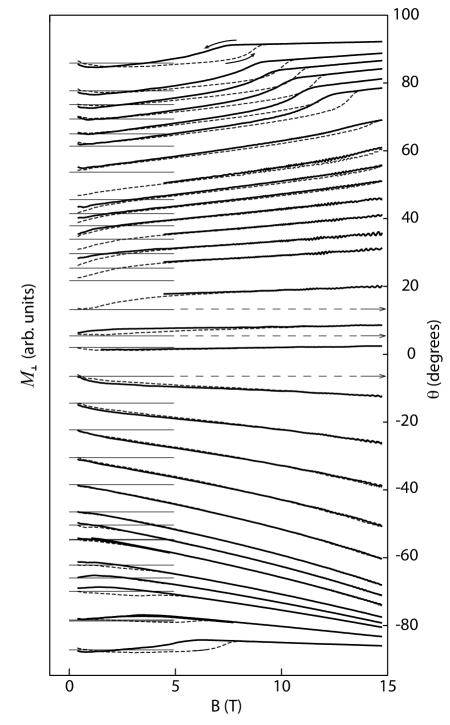
Over a small angle range, quantum oscillations were visible both below and above the transition; the Fourier transforms are shown in the Appendix. At each angle within this range, the oscillations have a lower amplitude on the high-field side of the transition than on the low-field side, and the dominant peak shifts to a slightly higher frequency. That the transition affects the oscillations in a consistent manner shows that it is a bulk property.
This transition is at a similar field to a spin-flop transition reported for CuCrO2, Kimura09_PRL 5.3 T for temperatures well below , and probably has the same origin. In CuCrO2, it has been found by single-crystal neutron diffraction that the spins lie in a plane. Soda10 ; Poienar10 ; Frontzek12 The transition occurs when the field is applied in a direction, but there is no transition for fields applied in a direction. It has been shown by symmetry arguments Kimura09_PRL and by direct observation Soda10 that the transition is a spin flop, where the spin plane rotates by .
For PdCrO2, although observation of an unconventional anomalous Hall effect shows that the spins are not co-planar, neutron scattering data show that the spins lie approximately in a plane, similar to CuCrO2. Furthermore, and also as in CuCrO2, the transition occurs when the field is applied in a direction (sample #1), but not in a direction (#2). Therefore the transition is probably the same spin flop.
IV Resistivity
PdCoO2 has been used as a nonmagnetic analogue of PdCrO2 in order to extract the magnetic contribution to the specific heat and electrical resistivity. Takatsu10JPhys ; Takatsu09 We have shown here that it is a very good comparison: the PdCrO2 Fermi surfaces are, to high precision, a reconstruction of the PdCoO2 Fermi surface, and the cyclotron masses match closely: for the orbit of PdCrO2, against for the (equivalent) neck orbit of PdCoO2. Hicks12 The in-plane resistivity of PdCoO2 is substantially non-linear between 100 and 500 K, a feature attributed to prominent optical phonons. Takatsu07 The resistivity of PtCoO2 also shows this feature. Kushwaha14 We include in this paper data on the resistivity of PdCrO2 up to 500 K, in order to extend the comparison reported in Ref. Takatsu10JPhys to higher temperatures and to see whether the same feature appears in PdCrO2.
All samples for resistivity measurement were cut with a wire saw into bars of nearly constant width and thickness, and with length-to-width ratios of 10, to reduce geometrical uncertainties in conversion of resistance to resistivity. Our data are plotted in Fig. 7. We measured one PdCoO2 and two PdCrO2 samples, labelled A and B; sample A had two pairs of voltage contacts, so in total three PdCrO2 curves were recorded. Averaging the three measurements, the room temperature (295 K) resistivity of PdCrO2 was found to be -cm, where the uncertainty is from uncertainty in the sample dimensions. This is in good agreement with that reported in Ref. Takatsu10JPhys (9.4 -cm).
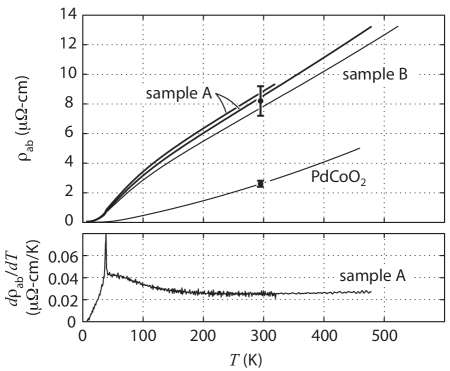
The form of the resistivity of PdCrO2 is well-established. There is a sharp cusp at , and above the magnetic component of the resistivity, , remains well below its saturation value due to short-range correlation. The increase and eventual saturation of as the temperature increases leads to a convex temperature dependence of the resistivity.
The in-plane resistivity of PdCrO2, in contrast to PdCoO2 and PtCoO2, is essentially linear from 200 to at least 500 K. It may be that the temperature dependence of obscures an optical phonon contribution. is expected to saturate when the Cr spins become completely uncorrelated. If is estimated by subtracting the resistivity of PdCoO2 from that of PdCrO2, then our data indicate that continues to increase at temperatures well above room temperature, i.e. continues to evolve to temperatures an order of magnitude greater than . The Weiss temperature of PdCrO2 is -500 K, Takatsu09 so correlations between the Cr spins are expected to persist to temperatures up to 500 K, and a high saturation temperature of may be expected.
V Discussion and Conclusion
The quantum oscillation frequencies indicate that the dominant magnetic scattering vectors are those of a six-site magnetic cell with lower symmetry than the nonmagnetic lattice. An associated lattice distortion is expected to onset at . It has been looked for by both neutron and X-ray diffraction, and not found, Takatsu14 so any distortion must be small.
The distortion, if it occurs, should resemble that observed in CuCrO2; Kimura09 there is also evidence for a lattice distortion in AgCrO2. Lopes11 In CuCrO2, the vector chirality is the same in each layer and the magnetic cell contains three sites. Seki08 ; Kadowaki90 ; Frontzek12 The magnetic transition is split into two, Aktas13 which is expected for easy-axis-type antiferromagnetism: spins first order along the easy axis, then, at a lower temperature, along an in-plane axis. Ultrasound velocity measurements show that the lattice distortion starts at the upper transition, with no apparent anomaly at the lower transition. Aktas13 .
The transition of PdCrO2 may also be split, although if so the splitting is very small and not generally observed in experiment. Takatsu14 Either way, the magnetic order implies two separate reductions in symmetry from : the choice of interplane ordering vector at the (possible) upper transition, and the choice of spin plane at the lower transition (where, again, in PdCrO2 the spins are only approximately co-planar). The two symmetry reductions are likely to couple. The ultrasound data on CuCrO2 suggest that in that system it is the interplane ordering vector that more strongly drives the distortion.
The angle dependence of the spin-flop transition in PdCrO2 is interesting: the transition field appears to vary smoothly from 15 T on one side of the plane (at ) to nearly zero on the other (at ). At , however, the field angle is a meaningless parameter, so if there is in fact an endpoint near then the high- and low-field states are adiabatically connected to each other. Whether this is true and how it might occur for a spin flop requires further investigation.
In summary, PdCrO2 is an interesting system comprised of alternating highly-conductive sheets and Mott-insulating spacer layers. It provides a good model for study of the interaction between metallic conduction and antiferromagnetic order: the conduction is well-characterized, arising from a single, open Fermi surface, and much is known about the magnetic order. Also, there are related compounds that permit precise comparisons, such as the nonmagnetic PdCoO2, and other CrO2-based delafossite and ordered rock salt materials. Several avenues of inquiry remain open.
We acknowledge useful discussions with John W. Allen, Christopher A. Hooley, Peter Thalmeier, and Burkhardt Schmidt, and practical assistance from Nabhanila Nandi. We acknowledge funding from the UK EPSRC, the MEXT KAKENHI (No. 21340100), the Royal Society, the Wolfson Foundation, and the Max Planck Society.
References
- (1) H. Takatsu, G. Nénert, H. Kadowaki, H. Yoshizawa, M. Enderle, S. Yonezawa, Y. Maeno, J. Kim, N. Tsuji, M. Takata, Y. Zhao, M. Green, and C. Broholm, Phys. Rev. B 89 104408 (2014).
- (2) S. Seki, Y. Onose, Y. Tokura, Phys. Rev. Lett. 101 067204 (2008).
- (3) Y. Oohara, S. Mitsuda, H. Yoshizawa, N. Yaguchi, H. Kuriyama, T. Asano, and M. Mekata, J. Phys. Soc. Japan 63 847 (1994).
- (4) H. Kadowaki, H. Kikuchi, and Y. Ajiro, J. Phys.: Condens. Matter 2 4485 (1990).
- (5) M. Frontzek, G. Ehlers, A. Podlesnyak, H. Cao, M. Matsuda, O. Zaharko, N. Aliouane, S. Barilo, and S.V. Shiryaev, J. Phys.: Condensed Matter 24 016004 (2012).
- (6) H. Kadowaki, H. Takei, and K. Motoya, J. Phys.: Condens. Matter 7 6869 (1995).
- (7) D. Hsieh, D. Qian, R.F. Berger, R.J. Cava, J.W. Lynn, Q. Huang, and M.Z. Hasan, Physica B 403 (2008) 1341.
- (8) A.I. Coldea et al, Phys. Rev. B 90 020401R (2014).
- (9) Jong Mok Ok, Y. J. Jo, Kyoo Kim, T. Shishidou, E. S. Choi, Han-Jin Noh, T. Oguchi, B. I. Min, and Jun Sung Kim, Phys. Rev. Lett. 111 176405 (2013).
- (10) J. A. Sobota, K. Kim, H. Takatsu, M. Hashimoto, S.-K. Mo, Z. Hussain, T. Oguchi, T. Shishidou, Y. Maeno, B. I. Min, and Z.-X. Shen, Phys. Rev. B 88 125109 (2013).
- (11) Han-Jin Noh, Jinwon Jeong, Bin Chang, Dahee Jeong, Hyun Sook Moon, En-Jin Cho, Jong Mok Ok, Jun Sung Kim, Kyoo Kim, B. I. Min, Han-Koo Lee, Jae-Young Kim, Byeong-Gyu Park, Hyeong-Do Kim, and Seongsu Lee, Sci. Reports 4 3680 (2014).
- (12) H. Takatsu, S. Yonezawa, S. Fujimoto, and Y. Maeno, Phys. Rev. Lett. 105 137201 (2010).
- (13) H. Takatsu and Y. Maeno, J. Cryst. Growth 312 3461 (2010).
- (14) H. Takatsu, S. Yonezawa, C. Michioka, K. Yoshimura, and Y. Maeno, J. Phys.: Conference Series 200 012198 (2010).
- (15) C.W. Hicks, A.S. Gibbs, A.P. Mackenzie, H. Takatsu, Y. Maeno, and E.A. Yelland, Phys. Rev. Lett. 109 116401 (2012).
- (16) The cantilevers are model PRC120, from Seiko Precision Instruments. The sense element is piezoresistive, and the datasheet lists the response, at room temperature, as 16.5 /m. The spring constant is 40 N/m, and the length 120 m; these parameters can be combined to yield a response to torque of /N-m.
- (17) R.D. Shannon, D.B. Rogers, and C.T. Prewitt, Inorganic Chemistry 10 713 (1971).
- (18) H. Takatsu, H. Yoshizawa, S. Yonezawa, and Y. Maeno, Phys. Rev. B 79 104424 (2009).
- (19) K. Kimura, T. Otani, H. Nakamura, Y. Wakabayashi, and T. Kimura, J. Phys. Soc. Japan 78 113710 (2009).
- (20) O. Aktas, G. Quirion, T. Otani, and T. Kimura, Phys. Rev. B 88 224104 (2013).
- (21) A.M.L. Lopes, G.N.P. Oliveira, T.M. Mendonça, J. Agostinho Moreira, A. Almeida, J.P. Araújo, V.S. Amaral, and J.G. Correia, Phys. Rev. B 84 014434 (2011).
- (22) K. Kimura, H. Nakamura, S. Kimura, M. Hagiwara, and T. Kimura, Phys. Rev. Lett. 103 107201 (2009).
- (23) M. Soda, K. Kimura, T. Kimura, and K. Hirota, Phys. Rev. B 81 100406R (2010).
- (24) M. Poienar, F. Damay, C. Martin, J. Robert, and S. Petit, Phys. Rev. B 104411 (2010).
- (25) H. Takatsu, S. Yonezawa, S. Mouri, S. Nakatsuji, K. Tanaka, and Y. Maeno, J. Phys. Soc. Japan 76 104701 (2007).
- (26) P. Kushwaha, P.J.W. Moll, N. Nandi, and A.P. Mackenzie, arXiv:1411.6162.
- (27) C. Bergemann, A.P. Mackenzie, S.R. Julian, D. Forsythe, and E. Ohmichi, Advances in Physics 52 639 (2003).
VI Appendix
In the Appendix we first present some supplementary data, and then give further details on the calculation of the reconstruction.
Fig. 8 shows the Lifshitz-Kosevich fits to the oscillation amplitudes determined over the field range 8.5–9.5 T. Four such fits were done, over 1 T field ranges starting at 7.5, 8.5, 9.5, and 10.5 T. The masses reported in the main text are the averages of the masses obtained from these fits.
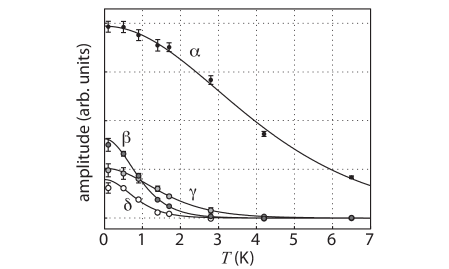
Fig. 9 shows the Fourier transforms of the oscillations above and below the putative spin-flop transition, for the narrow angle range over which oscillations were observed on both sides of the transition. On the high-field side of the transition, the oscillations have lower amplitudes and the main peak a higher frequency. (The reduction in amplitude may not be immediately apparent in the figure, but normally quantum oscillation amplitudes grow rapidly as the field is increased, and the reduction in amplitude is very clear in the raw data.)
We now give further details on the reconstruction. The first step is to determine the misalignment, if any, between the sample and the field angle sensor mounted on the rotator platform. This misalignment is determined, for sample #1, by comparison of the observed frequencies and the scaled PdCoO2 frequencies, shown in Fig. 2. The best match is obtained when a offset is added to the measured field angle. This is our misalignment, and correction for it is incorporated into all plots of sample #1 frequencies presented in this paper.
We take the nonmagnetic Fermi surface to be the parametrised PdCoO2 Fermi surface that was determined in Ref. Hicks12 . The parameters specifying the Fermi surface are the radius of a circular, cylindrical base Fermi surface, , and then the amplitudes of the corrugations on this base. , for example, is the amplitude of the hexagonal distortion. sets the difference between the radii of the neck and belly orbits. A thorough description of this system of parametrization is given in Ref. Bergemann03 .
We allow three parameters to be adjusted, within small ranges that are consistent with experiment, to match the overall levels of the observed PdCrO2 frequencies. We emphasize that this adjustment only tunes the overall levels, and does not substantially alter any of the substructure. These parameters are: (1) The overall size of the Fermi surface (), (2) The magnitude of the hexagonal distortion (), and (3) the in-plane lattice constant, . The -dependent Fermi surface corrugations (, , and ) are left fixed at the amplitudes found for PdCoO2. When is adjusted, the higher-order amplitudes and are adjusted by hand in response, to smooth the faces and sharpen the corners of the Fermi surface so as to match the Fermi surfaces observed by ARPES. Sobota13 ; Noh14
The best match is found with Å-1, Å-1, and Å. Further refinement (for example by allowing a low-temperature lattice distortion, or modification of the -dependent corrugations, or finite avoided crossings) might yield slightly different results— the obtained lattice parameter, for example, is not precisely in line with expectations, as it has been measured to be 2.923 Å at room temperature and some thermal contraction is expected. Takatsu14 But these fitting parameters are within bounds permitted by experiment and are adequate to model the angle dependence.
In addition to the reconstruction shown in the main text, we tested two further possibilities. The first is the same reconstruction but with the other possible orientation relative to the field rotation plane, that the glide plane is rotated from the field rotation plane by . The second tests a hypothetical magnetic zone with vertical side walls, that would preserve the symmetry of the nonmagnetic lattice. The results are shown in Fig. 10.
The rotated reconstruction, shown in the left-hand panels in Fig. 10, gives a reasonable match to the data, but not as good as with the glide and rotation planes aligned: it yields the wrong sign on the slope of against , and too low an amplitude on the substructure of the frequencies. The reconstruction gives a worse match: although it reproduces the and frequencies reasonably well, it does not reproduce the structure on at all. Therefore, we conclude that the magnetic reconstruction illustrated in Figs. 4 and 5 is the correct one.