11email: castelli@oats.inaf.it 22institutetext: Harvard-Smithsonian Center for Astrophysics, 60 Garden Street, Cambridge, MA 02138,USA
22email: rkurucz@cfa.harvard.edu 33institutetext: Department of Astronomy, University of Michigan, Ann Arbor, MI 48109-1042, USA
33email: cowley@umich.edu
New Mn II energy levels from the STIS-HST spectrum of the HgMn star HD 175640††thanks: Tables A.1 and A.2 are only available in electronic form at CDS via anonymous ftp to cdsarc.u-strasbg.fr (130.79.128.5) or via http://cdsweb.u-strasbg.fr/cgi-bin/qcat?J/A+A/
Abstract
Aims. The NIST database lists several Mn ii lines that were observed in the laboratory but not classified. They cannot be used in spectrum synthesis because their atomic line data are unknown. These lines are concentrated in the 2380-2700 Å interval. We aimed to assign energy levels and values to these lines.
Methods. Semiempirical line data for Mn ii computed by Kurucz were used to synthesize the ultraviolet spectrum of the slow-rotating, HgMn star HD 175640. The spectrum was compared with the high-resolution spectrum observed with the HST-STIS equipment. A UVES spectrum covering the 3050-10000 Å region was also examined.
Results. We determined a total of 73 new energy levels, 58 from the STIS spectrum of HD 175640 and another 15 from the UVES spectrum. The new energy levels give rise to numerous new computed lines. We have identified more than 50% of the unclassified lines listed in the NIST database and have changed the assignment of another 24 lines. An abundance analysis of the star HD 175640, based on the comparison of observed and computed ultraviolet spectra in the 1250-3040 Å interval, is the by-product of this study on Mn ii.
Key Words.:
line:identification-atomic data-stars:atmospheres-stars:chemically peculiar- stars:individual: HD 1756401 Introduction
The availability of a reliable and complete set of atomic data is an essential requirement for research in stellar physics, in particular for computing stellar atmospheres and stellar spectra to be compared with observations at various resolutions.
The highresolution, high signaltonoise stellar spectra observed by the modern telescopes and spectrographs have proved to be a useful tool for studies aimed at extending the knowledge of atomic and molecular data. An example is the analysis of the UVES spectrum of the peculiar star HR 6000 which has permitted us to fix about 120 Fe ii energy levels not observed before in the laboratory, but predicted with approximate energy values by the theory (Castelli et al. 2008, Castelli et al. 2009, Castelli & Kurucz 2010). Another example of the use of stellar spectra to derive atomic data is the paper by Peterson & Kurucz (2015) who obtained 66 new energy levels for Fe i from the analysis of HST-STIS spectra of a group of 13 metal-poor stars. In the above works, for each new determined energy level, several new transitions with wavelengths and oscillator strengths are associated, so that the line lists used for computing spectra are considerably augmented.
In this paper we extend to Mn ii the above described studies. History has shown that the refinement and extension of our atomic database has lead to important astronomical discoveries. In the case of the Mn ii spectrum, the subject of the present paper, the extended analysis by Iglesias & Velasco (1964) enabled many new line identifications in the class of stars now known as mercury-manganese (HgMn) stars, occupying the spectral region A0/B9-B6 (10500-16000K). This in turn enabled Bidelman (1962) and Dworetsky (1969) to show that these stars were enormously enriched in mercury and platinum. In the present study, we have been able to obtain abundances for ten elements that were unavailable from the ground spectra (B , N , Al , Cl , V , Zn , Ge , As , Ag , and Cd ). The ability to distinguish their spectral lines from those of Mn ii was essential.
To study the Mn ii spectrum, we adopted the same procedure described by Castelli & Kurucz (2010). We analysed HST-STIS spectra from 1250-3045 Å and a UVES spectrum from 3050 to 10000 Å of the HgMn star HD 175640. It is a slowly rotating star with an abundance in manganese on the order of 2.5 dex over the solar value. The UVES spectrum, previously analyzed to derive stellar parameters and abundances by Castelli & Hubrig (2004), was further examined for this paper to derive new Mn ii energy levels.
To fix new energy levels we adopted the semiempirical Mn ii line data computed by Kurucz. We determined a total of 73 new energy levels, 58 from the HST-STIS spectrum and 15 from the UVES spectrum. Updated line lists for most elements were adopted in order to synthesize the spectra. The most recent work on Mn ii is that of Kramida & Sansonetti (2013) who critically analyzed all the atomic data available in the literature for this ion. They revised the Sugar & Corliss (1985) energy levels and provided a list of Mn ii spectral lines and transition probabilities taken mostly from experimental sources. The Mn ii atomic data of the NIST database (Kramida et al. 2014) are the result of the Kramida & Sansonetti (2013) work. In the database there are numerous unclassified lines of Mn ii. They are concentrated in the 2380-2700 Å interval which was observed for HD 175640 at about 120000 resolution. The new Mn ii energy levels have permitted us to identify more than 50% of the lines unclassified in the NIST database.
2 Observations and data reduction
HD 175640 (HR 7143) is one of the targets included in the “Hot Stars” program (GO-13346), which is part of the “Advanced Spectral Library (ASTRAL)” Project (Ayres 2014). The star was observed in Cycle 21 of the Space Telescope Imaging Spectrograph (STIS). The spectrum covers the range 1150-3045 Å. The nominal resolving power R ranges from about 30000 to 120000; the S/N ratio is larger than 100. We used the final spectrum that resulted from the calibration and the merging of the individual spectra observed in the different wavelength intervals, as performed by the ASTRAL Science Team (Carpenter et al. 2014).
For this work we analyzed the whole region from 1250 to 3045 Å. We used the IRAF tool “continuum” to normalize the observed spectrum to the continuum level. When we compared observed and computed spectra we tentatively fixed different resolving powers for the different spectral intervals roughly corresponding to the different resolutions of the different observed regions (Ayres 2010). In particular, we adopted R equal to 50000, 40000, 25000, 30000, and 120000 for the ranges 1250-1340 Å, 1340-1690 Å, 1690-2200 Å, 2200-2332 Å, and 2332-3045 Å, respectively. The observed spectrum was shifted to the Ritz wavelengths, as derived from the energy levels, using mostly Fe ii lines as reference lines, owing to their accurate wavelengths derived from the Nave & Johansson (2013) energy levels. The shift to superimpose the observed spectrum to the synthetic spectrum is 25 km s-1 in the 1250-2000 Å region. After conversion of the wavelength scale of the 2000-3040 Å interval from vacuum to air, the shift is 24.5 km s-1. We estimate an uncertainty in the velocity shift on the order of 0.5 km sec-1, corresponding to an uncertainty in the wavelength scale of 0.2 mÅ, 0.35 mÅ, and 0.5 mÅ at 1250 Å, 2000 Å, and 3000 Å, respectively.
| Elem. | HD175640 | Sun | ||
|---|---|---|---|---|
| UV | Visible | |||
| He i | 1.73 | 1.11 | ||
| Be ii | 10.64 | 10.99 | ||
| B ii | 8.75 | 9.34 | ||
| C i | 4.00 | 4.110.23 | 3.61 | |
| C ii | 4.00 | 4.050.16 | 3.61 | |
| N i | 5.95 | 5.78 | 4.21 | |
| O i | 3.28 | 3.180.11 | 3.35 | |
| Ne i | 4.35 | 4.11 | ||
| Na i | 5.47 | 5.80 | ||
| Mg i | 4.69 | 4.64 0.06 | 4.44 | |
| Mg ii | 4.69 | 4.71 0.07 | 4.44 | |
| Al i | 7.50 | 5.59 | ||
| Al ii | 7.00 | 5.59 | ||
| Al iii | 7.00 | 5.59 | ||
| Si i | 4.80 | 4.53 | ||
| Si ii | 4.80 | 4.72 0.08 | 4.53 | |
| Si iii | 4.80 | 4.58 0.04 | 4.53 | |
| Si iv | 4.80 | 4.53 | ||
| P i | 6.28 | 6.63 | ||
| P ii | 6.28 | 6.280.08 | 6.63 | |
| P iii | 6.28 | 6.63 | ||
| S i | 5.30 | 4.92 | ||
| S ii | 5.30 | 5.120.03 | 4.92 | |
| Cl i | 7.50 | 6.54 | ||
| Ca i | 5.26 | 5.70 | ||
| Ca ii | 5.54 | 5.67 0.25 | 5.70 | |
| Sc ii | 9.08 | 9.08 0.15 | 8.89 | |
| Sc iii | 9.08 | 8.89 | ||
| Ti ii | 5.67 | 5.670.11 | 7.09 | |
| Ti iii | 5.67 | 7.09 | ||
| V ii | 9.94 | 9.04 | 8.11 | |
| Cr i | 5.22 0.09 | 6.40 | ||
| Cr ii | 5.36 | 5.41 0.07 | 6.40 | |
| Cr iii | 5.36 | 6.40 | ||
| Mn i | 4.20 | 4.200.08 | 6.61 | |
| Mn ii | 4.20 | 4.25 0.04 | 6.61 | |
| Mn iii | 4.20: | 6.61 | ||
| Fe i | 4.83 | 4.780.08 | 4.54 | |
| Fe ii | 4.83 | 4.840.13 | 4.54 | |
| Fe iii | 4.83 | 4.54 | ||
| Co ii | 9.00 | 8.08: | 7.05 | |
| Ni ii | 6.09 | 6.090.16 | 5.82 | |
| Ni iii | 6.09 | 5.82 | ||
| Cu i | 6.52 | 7.85 | ||
| Cu ii | 6.50 | 7.85 | ||
| Zn ii | 8.70 | 7.48 | ||
| Ga i | 5.43 | 9.00 | ||
| Ga ii | 5.43 | 5.430.04 | 9.00 | |
| Ga iii | 5.43 ? | 9.00 | ||
| Ge ii | 10.1 | 8.39 | ||
| As ii | 7.50 | 9.74 | ||
| Br ii | 7.120.04 | 9.50 | ||
| Sr ii | 8.41 | 9.17 | ||
| Y ii | 6.66 | 6.660.20 | 9.83 | |
| Y iii | 6.66 | 9.83 | ||
| elem | HD175640 | Sun | ||
|---|---|---|---|---|
| UV | Visible | |||
| Zr ii | 8.670.17 | 9.46 | ||
| Zr iii | 8.50 | 9.46 | ||
| Rh ii | 8.50 | 8.50 | 11.13 | |
| Pd i | 6.41 0.30 | 10.47 | ||
| Pd ii | 6.30 | 10.47 | ||
| Pd iii | 6.30 | 10.47 | ||
| Ag ii | 8.50 | 11.10 | ||
| Cd ii | 9.53 | 10.33 | ||
| Xe ii | 5.96 0.20 | 9.80 | ||
| Ba ii | 9.27 | 9.86 | ||
| Pr iii | 9.62 | 11.32 | ||
| Nd iii | 9.57 0.08 | 10.62 | ||
| Yb ii | 8.10 | 8.10 0.19 | 11.20 | |
| Yb iii | 8.10 | 7.310.01 | 11.20 | |
| Os ii | 10.55 | 10.64 | ||
| Ir ii | 11.15 | 10.66: | 10.66 | |
| Pt & 10.42 | 7.63 | 10.42 | ||
| Au ii | 7.51 | 7.510.06 | 11.12 | |
| Au iii | 7.51 | 11.12 | ||
| Hg i | 6.60 | 6.19 0.18 | 10.87 | |
| Hg ii | 6.60 | 6.53 0.23 | 10.87 | |
| Hg iii | 6.60 | 10.87 | ||
3 The star HD 175640
The stellar parameters and the abundances of HD 175640 were determined by Castelli & Hubrig (2004) in a previous analysis of the optical spectrum of the star. An ATLAS12 (Kurucz 2005) model with parameters =12000 K, =3.95, and microturbulent velocity =0 km sec-1 was computed for the individual stellar abundances. They were obtained from the equivalent widths of selected lines and are listed in the third column of Table 1. The SYNTHE code (Kurucz 2005) was used to compute a synthetic spectrum for the 3050 10000 Å region which was compared with the observed spectrum. The ATLAS12 model and the given set of abundances were adopted. A rotational velocity of v sini 2.5 km sec-1 was derived from the comparison of the observed and computed spectra. The adopted zero microturbulent velocity was based both on the Adelman (1994) conclusions that most HgMn stars have little or no microturbulent velocity and on the consistent abundances we obtained from the equivalent widths of 55 weak and strong Fe ii lines measured in the optical region (Castelli & Hubrig 2004).
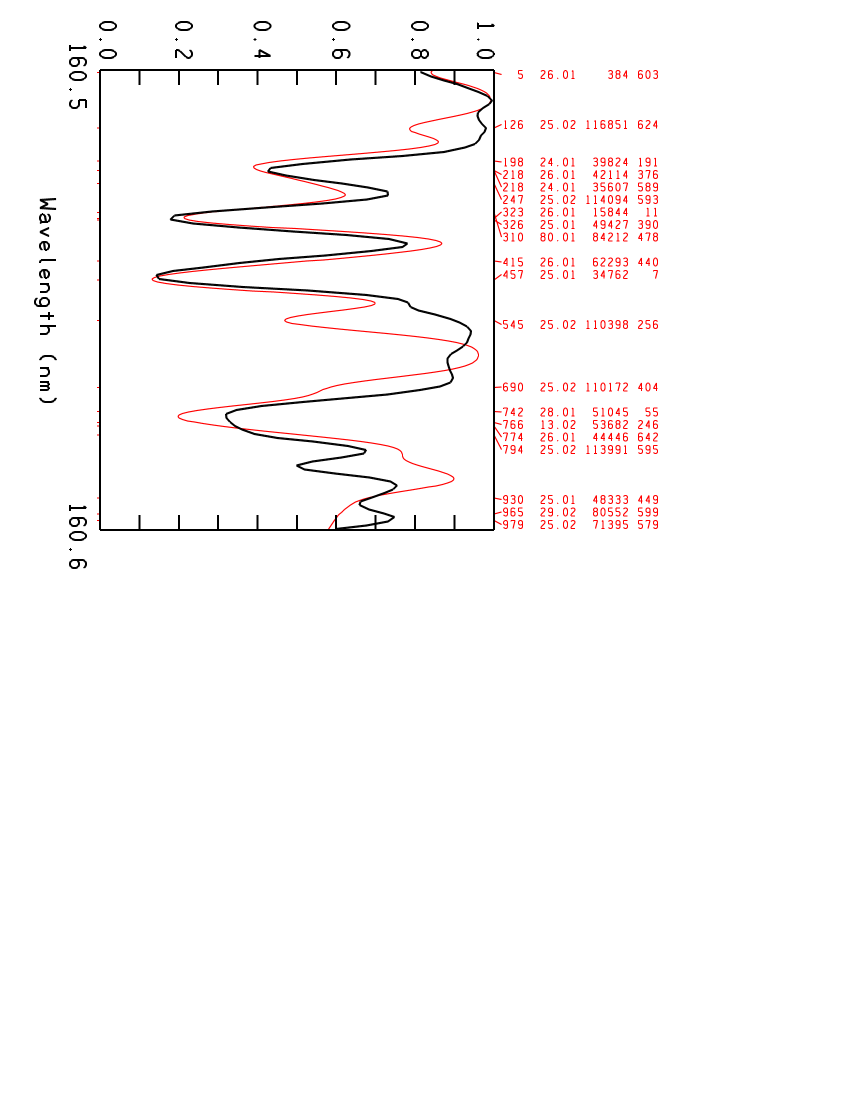
In this paper we compared the observed HST-STIS spectrum with a synthetic spectrum computed for the 1250-3045 Å interval. We used the ATLAS12 model atmosphere adopted in Castelli& Hubrig (2004) and the abundances listed in the second column of Table 1. We started with the abundances adopted to compute the optical spectrum and then we modified some of them in order to better fit the ultraviolet spectrum. The abundances of B , N , Al , Cl , V , Zn , Ge , As , Ag , and Cd were derived only in this paper. For those elements that do not show lines in the HST-STIS spectrum we adopted the abundances derived from the optical region if they did not produce inconsistent results, as is the case of Pt . For the ions C i, P i, Ga iii, Y iii, and Yb iii the ionization equilibria are not satisfied. We did not use their corresponding abundance to compute the synthetic spectrum, but that of the ions in the other ionization stages. In addition, the abundance derived from Mn i and Mn ii gives incorrect profiles for a large number of Mn iii lines, that are either not observed or are computed as too strong (Figure 1). These lines are mostly due to transitions having either an even level with energy larger than 172000 cm-1 or an odd level with energy larger than 130000 cm-1. We compared the Kurucz values that we used with those from Uylings & Raassen (1997) for the lines in common. Because the differences are not larger than 0.2 dex (while fitting the observed lines requires lowering the values by 1.0 up to 2.0 dex or more), we could argue that some physical mechanism like the vertical abundance stratification weakens the high-excitation lines of Mn iii in HD 175640. On the other hand, the low-excitation lines, in particular those of multiplets 10, 11, 12, 13, 14, 15, 16, 17, and 18 (Moore 1950), which lie in the 1900-2400 Å region, are reasonably well predicted by the adopted abundance.
To compute the synthetic spectrum we used the Kurucz database which is formed by the Kurucz (1988; 1993) line lists and by new and revised data (Kurucz 2011). The Kurucz line lists include the hyperfine structure for several elements. In particular, for Mn ii, the magnetic dipole and electric quadrupole coupling constants A and B measured by Holt et al. (1999) for 59 levels were used to compute the hyperfine structure of all the lines with coupling constants available for both levels. The constants and the hyperfine lines are listed on Kurucz’s website111 http://kurucz.harvard.edu/atoms/2501/hyper250155.pos or hyper250155.all. The two files quoted in the footnote differ in that experimental values, when available, are used in the second file instead of the Kurucz computed values which are stored in the first file.
For this work we added lines of Ga ii, Ga iii, Rh ii, Pd ii, Ag ii, Y iii, Zr iii, Yb iii, Pt ii, Pt iii, Au ii, Au iii, Hg ii, Hg iii. The presence of these elements in the STIS spectrum of HD 175640 was inferred from the previous analysis of the optical region (Castelli & Hubrig 2004). We also used predicted lines and intensities for the STIS region using the “predicted stellar” option of the VALD database (Ryabchikova et al. 1997) with stellar parameters for HD 175640 from Castelli & Hubrig (2004). Additionally, we used results from wavelength coincidence statistic (WCS, Cowley & Hensberge 1981), using measurements of STIS wavelengths for 2000 Å. These wavelengths are available online222http://dept.astro.lsa.umich.edu/cowley/HR7143air.html. More information on the heavy elements identified in HD 175640 is given in the Appendix.
In addition to the large overabundance of Mn ([2.4]), Ti ([1.4]), Cr ([1.0]), and the mild underabundance of Fe ([0.3]), mild overabundances of B , Na , and P , a general underabundance of the light elements (He, C, N, Mg, Al, Si, S, Cl), and general overabundance of several heavy elements (Cu, Ga, As, Br, Sr, Y, Zr, Rh, Pd, Ag, Cd, Xe, Yb, Au, and Hg) were measured. This peculiar chemical composition gives rise to a very rich line spectrum in the ultraviolet.
4 New Mn ii energy levels
After adding to the Kurucz line list the missing atomic species relevant for the star and available in the literature, and after comparing the observed spectrum with the synthetic spectrum computed with the abundances given in Table 1, we concentrated on the Mn ii lines. Line data for this ion were recently updated and critically evaluated by Kramida & Sansonetti (2013). They list 3969 Mn ii lines from 933.0682 Å to 9907.26 Å from which they derived 277 even energy levels and 377 odd energy levels. All the lines are classified as transitions between known energy levels, except for 188 lines observed in the laboratory spectra but not classified. Most of these lines lie in the 2380-2700 Å region. Numerous unidentified lines can be observed in this region in HD 175640. The wavelengths of several of them are the unclassified Mn ii lines.
To determine new energy levels we used the same method adopted by Castelli & Kurucz (2010) when they derived new Fe ii energy levels from the optical UVES spectrum of HR 6000. Predicted energy levels and values for Mn ii were computed by Kurucz with his version of the Cowan (1981) code (Kurucz 2011). The calculation included 50 even configurations d6, d54d12d, d44s4d4s9d, d54s12s, d44s2, d44s5s4s9s, d55g9g, d44s5g4s9g, d57i9i, d44s7i4s9i, d44s9l, and d44p2 with 19686 eigenvalues that were fitted with the least-squares method to 277 known levels. The 41 odd configurations included d54p10p, d44s4p4s10p, d3s24p, d54f10f, d44s4f4s10f, d56h9h, d44s6h4s9h, d58k9k, and d44s8k4s9k with 19820 eigenvalues which were least-squares fitted to 377 known levels. The calculations were done in intermediate coupling with all configuration interactions included, with scaled Hartree-Fock starting guesses, and with Hartree-Fock transition integrals. A total of 5146779 lines were saved from the transition array of which 41882 lines are between known levels and have good wavelengths.
To derive new energy levels for Mn ii, we considered predicted wavelengths due to transitions between a measured and a predicted energy level. A predicted line is usually not shifted more than 10 Å from the corresponding unknown observed line. However, owing to the large number of predicted lines, of unidentified lines, and blends in the ultraviolet spectrum of HD 175640, it is not a straightforward task to find the correct correspondence between a predicted line and an unidentified line observed in the spectrum.
| Designation | J | Energy | ||
|---|---|---|---|---|
| cm-1 | ||||
| 3d4(5D)4s4p(3P) | 7Fo | 3.0 | 82303.415 | |
| 3d4(5D)4s4p(3P) | 7Fo | 4.0 | 82564.493 | |
| 3d5(b2D)4p | 3Fo | 2.0 | 100320.586 | |
| 4.0 | 100725.176 | |||
| 3d5(b2D)4p | 3Po | 1.0 | 101807.469 | |
| 3d6(4G)4d | 5F | 1.0 | 106351.582 | |
| 2.0 | 106348.454 | |||
| 3.0 | 106340.485 | |||
| 4.0 | 106324.758 | |||
| 5.0 | 106298.960 | |||
| 3d5(4G)4d | 5G | 2.0 | 106408.011 | |
| 3.0 | 106408.348 | |||
| 4.0 | 106406.642 | |||
| 5.0 | 106400.766 | |||
| 6.0 | 106387.310 | |||
| 3d5(4G)4d | 3D | 3.0 | 107192.929 | |
| 3d5(4G)4d | 3I | 5.0 | 107155.877 | |
| 6.0 | 107145 038 | |||
| 7.0 | 107114.165 | |||
| 3d5(4G)4d | 3G | 3.0 | 107999.208 | |
| 4.0 | 108007.750 | |||
| 5.0 | 108006.293 | |||
| 3d5(4G)4d | 3F | 2.0 | 108420.629 | |
| 3.0 | 108425.105 | |||
| 4.0 | 108420.479 | |||
| 3d6(4P)4d | 5P | 1.0 | 108617.023 | |
| 3.0 | 108399.148 | |||
| 3d6(4P)4d | 5F | 1.0 | 108511.206 | |
| 2.0 | 108521.377 | |||
| 3.0 | 108561.169 | |||
| 4.0 | 108604.283 | |||
| 5.0 | 108661.385 | |||
| 3d5(4G)4d | 3H | 4.0 | 108907.450 | |
| 5.0 | 108906.437 | |||
| 6.0 | 108896.070 | |||
| 3d6(4P)4d | 3D | 1.0 | 109709.489 | |
| 2.0 | 109572.155 | |||
| 3.0 | 109370.762 | |||
| 3d5(4P)4d | 3F | 2.0 | 110664.620 | |
| 3.0 | 110611.014 | |||
| 3d5(4P)4d | 3P | 2.0 | 110998.198 | |
| 3d5(4D)4d | 5G | 2.0 | 111744.523 | |
| 3.0 | 111753.977 | |||
| 4.0 | 111761.546 | |||
| 5.0 | 111761.008 | |||
| 6.0 | 111741.583 | |||
| Designation | J | Energy | ||
|---|---|---|---|---|
| cm-1 | ||||
| 3d5(4D)4d | 5P | 3.0 | 111831.748 | |
| 3d5(4D)4d | 5S | 2.0 | 111991.133 | |
| 3d5(4D)4d | 5F | 2.0 | 112141.748 | |
| 3.0 | 112106.537 | |||
| 4.0 | 112046.403 | |||
| 5.0 | 111943.809 | |||
| 3d5(4D)4d | 5D | 4.0 | 113199.572 | |
| 3d5(2I)4d | 3I | 5.0 | 118544.936 | |
| 6.0 | 118574.338 | |||
| 7.0 | 118585.339 | |||
| 3d5(2I)4d | 1K | 7.0 | 119152.797 | |
| 3d5(2I)4d | 1G | 4.0 | 119937.245 | |
The computed line list was sorted into tables of all the lines with 3.0 connected to every predicted level. At first, we extracted the lines with 1.0 so that only the strongest lines were examined. When at least two strong predicted lines originate from the same predicted level, we searched in the spectrum for an unidentified line with wavelength close to the first of the two predicted lines. From the observed wavelength and the known energy level involved in the transition we derived a possible value for the unknown energy level. We used this energy value to derive the corresponding wavelength of the second predicted line. If there is an unidentified line at this position in the observed spectrum we checked the energy value on other predicted lines connected to the examined predicted level. If the test is positive for a sample of lines (usually from 3 to 5), we assign the checked energy to the unknown level. Otherwise, we selected some other observed unidentified line in the spectrum and we repeated the procedure. We proceed in this way until we find that value for the unknown energy that produces lines which are all observed in the spectrum, but not identified.
Whenever one or more new levels was found, the whole semiempirical calculation was repeated to produce improved predicted wavelengths and values.
Using the above procedure we identified 58 new energy levels from the HST-STIS spectrum of HD 175640; five of them have odd parity, the others have even parity. We added 15 more new odd parity energy levels that we obtained from the UVES spectrum of HD 175640. The new energy levels are listed in Table 2 and Table 3.
| Designation | J | Energy | ||
|---|---|---|---|---|
| cm-1 | ||||
| 3d5(6S)4f | 7Fo | 1.0 | 98423.93 | |
| 0.0 | 98424.00 | |||
| 3d5(6S)6f | 7Fo | 2.0 | 113840.6 | |
| 1.0 | 113840.7 | |||
| 0.0 | 113840.8 | |||
| 3d5(6S)8f | 7Fo | 6.0 | 119197.79 | |
| 5.0 | 119197.79 | |||
| 4.0 | 119197.79 | |||
| 3.0 | 119197.79 | |||
| 2.0 | 119197.79 | |||
| 1.0 | 119197.79 | |||
| 0.0 | 119197.79 | |||
| 3d5(4G)4f | 5Ho | 7.0 | 125218.640 | |
| 9.0 | 125243.338 | |||
| 3d5(4G)4f | 5Io | 6.0 | 125257.344 | |
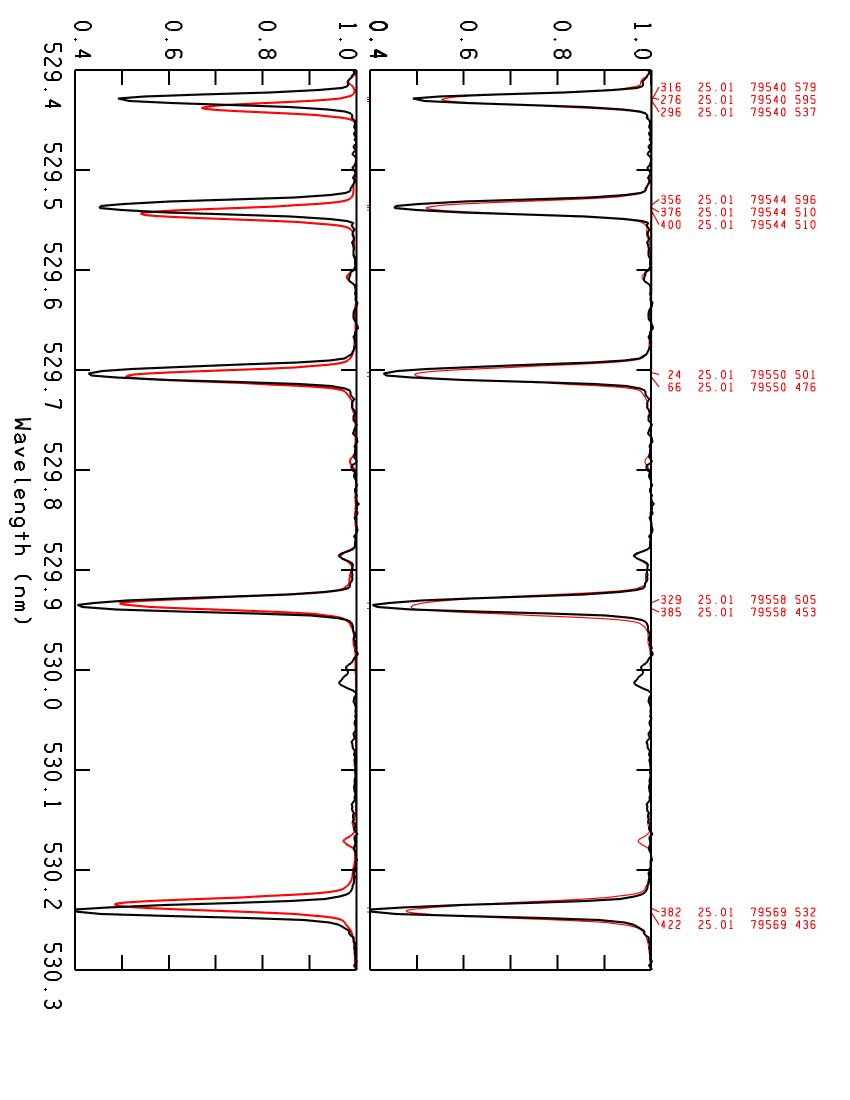
The search for new energy levels in the optical region was rather unsuccessful. The energies 98423.93 cm-1 and 98424.00 cm-1 of the two levels belonging to the term 3d5(6S)4f 7Fo, were obtained from the strong lines of the triplets at 5294 Å and 5295 Å, which are part of the multiplet 3d5(6S)4d e7Do 3d5(6S)4f 7Fo. All the transitions of this multiplet give rise to five strong Mn ii lines observed at 5294, 5295, 5297, 5299, and 5302 Å. Because the lines computed with the energies listed by Kramida & Sansonetti (2013) are more or less displaced from the observed lines, we modified the energy of the upper level in order to better fit the observed line position. Table 4 compares the energies of the 3d5(6S)4f 7Fo term adopted in this paper with those listed in the NIST database. The corresponding wavelengths of the multiplet are also listed. Figure 2 shows the five Mn ii lines computed with wavelengths from this paper listed in the first column of Table 4 and those from Kramida&Sansonetti (2013) listed in the last column of Table 4.
The energies 113840.6 cm-1, 113840.7 cm-1, and 113840.8 cm-1 of the three levels with J=2, 1, and 0 respectively, belonging to the odd parity term 3d5(6S)6f 7Fo were simply extrapolated from the levels with higher J quantum number. The transitions from these levels contribute to two weak and blended lines observed at 7166.4 and 7167.4 Å.
The energy 119197.79 cm-1 was assumed for all the levels with J from 0 to 7 of the term 3d5(6S)8f 7Fo. They give rise to two weak lines observed at 5180.271 Å and 5181.649 Å. The first one is blended with Fe ii 5180.312 Å.
Finally, the observed lines arising from the three last energy levels of Table 3 are listed in the Table A.1 available online. In addition to the corrections of the odd parity levels shown in Table 4, we modified two other odd parity energy levels from Kramida & Sansonetti (2013) on the basis of all the transitions observed in the spectrum related to them. They are: 81802.746 cm-1 instead of 81803.31 cm-1 (3d5 (2I)4p z1Io, J=6) and 94230.94 cm-1 instead of 94231.20 cm-1 (3d5 (2S)4p z3Po, J=2).
| (CKC)a | El(KS)b | Eu(CKC)a | Jl,Ju | Eu(KS)b | (KS)b |
|---|---|---|---|---|---|
| cm-1 | cm-1 | cm-1 | |||
| 5294.276 | 79540.93 | 98424.00 | 1,0 | ||
| 5294.296 | 79540.93 | 98423.93 | 1,1 | ||
| 5294.318 | 79540.93 | 98423.858 | 1,2 | 98423.63 | 5294.379 |
| 5295.356 | 79544.71 | 98423.93 | 2,1 | ||
| 5295.376 | 79544.71 | 98423.858 | 2,2 | 98423.63 | 5295.439 |
| 5295.400 | 79544.71 | 98423.773 | 2,3 | 98423.63 | 5295.439 |
| 5297.003 | 79550.50 | 98423.858 | 3,2 | 98423.63 | 5297.063 |
| 5297.024 | 79550.50 | 98423.773 | 3,3 | 98423.63 | 5297.063 |
| 5297.068 | 79550.50 | 98423.624 | 3,4 | 98423.60 | 5297.072 |
| 5299.288 | 79558.56 | 98423.773 | 4,3 | 98423.63 | 5299.327 |
| 5299.329 | 79558.56 | 98423.624 | 4,4 | 98423.60 | 5299.336 |
| 5299.387 | 79558.56 | 98423.424 | 4,5 | 98423.59 | 5299.338 |
| 5302.327 | 79569.22 | 98423.624 | 5,4 | 98423.60 | 5302.331 |
| 5302.382 | 79569.22 | 98423.424 | 5,5 | 98423.59 | 5302.333 |
| 5302.421 | 79569.22 | 98423.281 | 5,6 | 98423.56 | 5302.342 |
a CKC:this paper;
b KS: Kramida & Sansonetti (2013)
5 The new Mn ii lines
The new Mn ii lines due to transitions from the new Mn ii energy levels listed in Table 2 and Table 3 are given in Table A.1, available online. The new Mn ii lines are mostly concentrated in the 2380-2700 Å interval. The upper energy levels (Cols. 14) were derived as described in Sect. 4; the lower energy levels (Cols. 58) were taken from Kramida & Sansonetti (2013); the wavelength given in Col. 9 is the Ritz wavelength in air for 2000 Å, in vacuum for 2000 Å. The values (Col. 10) were computed by Kurucz with the semi-empirical method, the wavelengths given in Col. 11 are the observed laboratory wavelengths listed by Kramida & Sansonetti (2013). In addition to the 109 newly classified lines, we give a different assignment for 24 other lines of the Kramida & Sansonetti (2013) tabulation. This implies different energy levels for these 24 lines. The last column of Table A.1 indicates whether the new line is listed in the NIST database without any classification (unassigned), listed with a different classification (DIFFERENT assign.), or not listed at all.
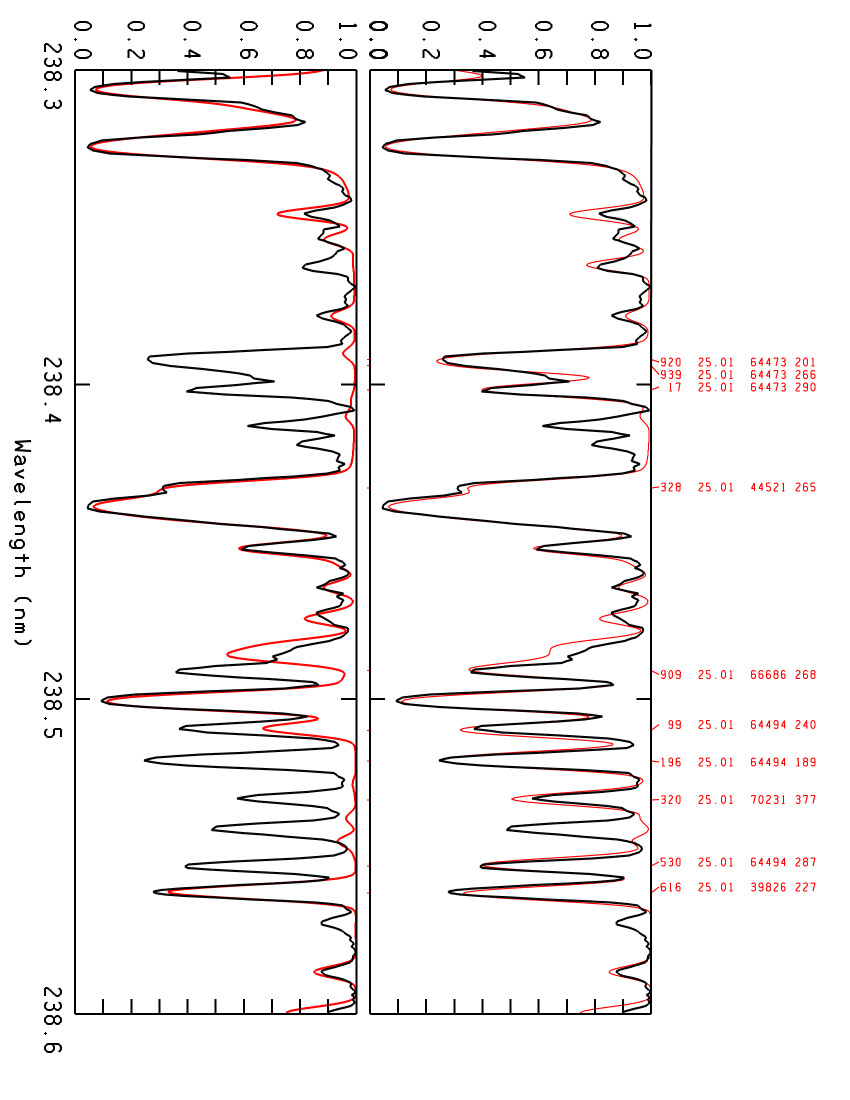
Figure 3 shows the Mn ii spectrum in the regions 2383-2390 Å interval computed before and after the determination of both new energy levels and new Mn ii lines. Figure 4 compares the observed spectrum of HD 175640 with the synthetic spectrum computed both with and without the new Mn ii lines. The improvement of the comparison between the observed and computed spectra due to the addition of the new Mn ii lines is evident.

| wave | E(low) | J(low) | Term | E(up) | J(up) | Term | hfs | Acc. | Abund | |||
|---|---|---|---|---|---|---|---|---|---|---|---|---|
| K14 | cm-1 | cm-1 | KSG | K14-KSG | ||||||||
| 1678.643 | 2.681 | 9472.993 | 2.0 | (6S)4s a 5S | 69044.910 | 2.0 | (4P)4p z3P | no | 2.638 | D+ | 0.043 | 4.20 |
| 2535.659 | 0.478 | 27583.590 | 4.0 | (4G)4s a 5G | 67009.217 | 3.0 | (4P)4p z5D | no | 0.502 | B+ | 0.024 | 3.80 |
| 2535.977 | 1.024 | 27588.534 | 3.0 | (4G)4s a 5G | 67009.217 | 3.0 | (4P)4p z5D | no | 1.045 | B+ | 0.021 | 3.80 |
| 2543.457 | 0.119 | 27589.360 | 2.0 | (4G)4s a 5G | 66894.130 | 1.0 | (4G)4p z5F | no | 0.138 | B | 0.019 | 4.20 |
| 2557.543 | 0.310 | 27588.534 | 3.0 | (4G)4s a 5G | 66676.833 | 2.0 | (4P)4p z5D | no | 0.346 | C+ | 0.036 | 4.10 |
| 2716.793 | 0.664 | 29889.534 | 3.0 | (4P)4s a 5P | 66686.739 | 3.0 | (4G)4p z5F | yes | 0.646 | B+ | 0.018 | 3.80 |
| 2762.558 | 1.422 | 32857.270 | 3.0 | (4D)4s b 5D | 69044.910 | 2.0 | (4P)4p z3P | no | 1.471 | D+ | 0.049 | 4.20 |
| 2933.785 | 1.421 | 32818.440 | 0.0 | (4D)4s b 5D | 66894.130 | 1.0 | (4G)4p z5F | yes | 1.458 | B | 0.037 | 4.20 |
| 2935.362 | 2.047 | 32836.740 | 1.0 | (4D)4s b 5D | 66894.130 | 1.0 | (4G)4p z5F | no | 2.002 | C+ | 0.045 | 3.85 |
| 2949.204 | 0.313 | 9472.993 | 2.0 | (6S)4s a 5S | 43370.537 | 3.0 | (6S)4p z5P | no | 0.253a | A+ | 0.060 | 4.20 |
| 2955.139 | 0.972 | 32857.270 | 3.0 | (4D)4s b 5D | 66686.739 | 3.0 | (4G)4p z5F | no | 0.987 | B+ | 0.015 | 3.80 |
| 2989.730 | 1.934 | 33248.660 | 4.0 | (4G)4s a 3G | 66686.739 | 3.0 | (4G)4p z5F | no | 1.924 | D+ | 0.010 | 3.90 |
| 3050.657 | 0.159 | 36274.620 | 2.0 | (4P)4s b 3P | 69044.910 | 2.0 | (4P)4p z3P | no | 0.206 | B+ | 0.047 | 4.15 |
| 3146.121 | 2.546 | 34910.770 | 4.0 | d6 b 33G | 66686.739 | 3.0 | (4G)4p z5F | no | 2.523 | D | 0.023 | 4.25 |
| 3204.878 | 1.115 | 37851.490 | 3.0 | d6 a 33D | 69044.910 | 2.0 | (4P)4p z3P | no | 1.097 | B+ | 0.018 | 4.15 |
| 4206.368 | 1.584 | 43528.661 | 5.0 | (4F)4s a 5F | 67295.446 | 4.0 | (4P)4p z5D | yes | 1.553 | C+ | 0.031 | 4.05 |
| 4292.233 | 1.581 | 43395.395 | 3.0 | (2D)4s c 3D | 66686.739 | 3.0 | (4G)4p z5F | yes | 1.544 | D+ | 0.037 | 4.20 |
| 4343.983 | 1.105 | 43528.661 | 5.0 | (4F)4s a 5F | 66542.539 | 5.0 | (4G)4p z5F | yes | 1.109 | C+ | 0.004 | 3.80 |
a This value is from Den Hartog et al. (2011)
6 Mn ii values and manganese abundance
For Mn ii, Kramida &Sansonetti (2013) tabulate in the NIST database the experimental values from Den Hartog et al. (2011), Kling & Griesmann (2000), and Kling, Schnabel & Griesmann (2001). For lines with upper levels 3d5(6S)4p z5Po and 3d5(6S)4p z7Po, they adjusted the values given in the last two papers according to the lifetime value recommended by Den Hartog et al. (2011) for these levels. Furthermore, they adopted the semi-empirical values from Kurucz (1988) for several lines.
| wave | E(low) | J(low) | Term | E(up) | J(up) | Term | hfs | Acc. | for the | ||||
|---|---|---|---|---|---|---|---|---|---|---|---|---|---|
| K14 | cm-1 | cm-1 | KSG | K14-KSG | 4.20 dex abund | ||||||||
| 2559.416 | 0.350 | 27583.590 | 4.0 | (4G)4s a 5G | 66643.296 | 4.0 | (4G)4p z5F | no | 1.424 | D | 1.074 | 0.35 | |
| 2717.524 | 0.895 | 29889.534 | 3.0 | (4P)4s a 5P | 66676.833 | 2.0 | (4P)4p z5D | yes | 2.184 | E | 1.289 | 0.70 | |
| 2719.736 | 0.319 | 29919.444 | 2.0 | (4P)4s a 5P | 66676.833 | 2.0 | (4P)4p z5D | yes | 1.500 | D | 1.181 | 0.319 | |
| 2845.848 | 2.732 | 31514.710 | 4.0 | d6 a 3F | 66643.296 | 4.0 | (4G)4p z5F | no | 1.274 | D+ | 1.458 | 2.85 | |
| 2956.005 | 1.325 | 32857.270 | 3.0 | (4D)4s b 5D | 66676.833 | 2.0 | (4P)4p z5D | no | 3.168 | D | 1.843 | 0.75 | |
| 2993.603 | 2.421 | 33147.710 | 5.0 | (4G)4s a 3G | 66542.539 | 5.0 | (4G)4p z5F | no | 1.061 | D+ | 1.360 | 2.35 | |
| 4325.047 | 2.355 | 43528.661 | 5.0 | (4F)4s a 5F | 66643.296 | 4.0 | (4G)4p z5F | yes | 1.115 | C+ | 1.240 | 2.55 | |
| 4393.385 | 2.646 | 44139.031 | 1.0 | (2D)4s c 3D | 66894.130 | 1.0 | (4G)4p z5F | yes | 1.458 | D+ | 1.188 | 2.70 |
The comparison of the experimental values (KGS) with the last version of the semi-empirical oscillator strengths from Kurucz (2014) (K14) is shown in Fig 5. The average of the difference (K14)(KGS) is 0.0680.397. The trend is small, but the dispersion around the zero is rather large. However, on a total of 193 lines, 51 of them have a difference in less than 0.1 dex.

In order to extract a set of lines well suited to deriving the manganese abundance, we presumed that lines with small differences between experimental and semi-empirical values could be used to this purpose. Table 5 lists 18 Mn ii lines with values from K14 and from either KGS or Den Hartog et al. (2011) differing less than 0.06 dex. The smallest difference (0.004 dex) occurs for the line at 4343.983 Å. This line gives an abundance of 3.80 dex. We checked this abundance on the other lines listed in Table 5. Instead of deriving approximately the same abundance from the lines, we found a variety of values ranging from 3.8 dex to 4.2 dex, as is shown in the last column of Table 5. We investigated whether the abundance differences are related to the uncertainty associated with the experimental values. According to Kramida & Sansonetti (2013) their accuracy is 0.009 dex for the score A+ and decreases up to 0.24 dex for the score D. If we restrict our analysis to the lines in Table 5 with the scores B, B+ and A+, corresponding to uncertainties not greater than 0.04 dex, we find that the discrepancies in the abundances are not reduced. Figure 6 shows that the problem occurs because some strong Mn ii lines have profiles that cannot be reproduced by computations for any adopted abundance. For instance, while the high abundance of 3.8 dex improves the agreement between the observed and computed profiles of the strong line with no wings at 2716.793 Å, it is too high for the broad line at 2949.204 Å, which develops unobserved strong wings for abundances larger than 4.20 dex. We note that the experimental value of this line is determined with an uncertainty 0.009 dex, so that it cannot be the cause of the weaker than observed computed core for the 4.20 dex abundance, well suited to fitting the wings. An increase in the microturbulent velocity from 0.0 km sec-1 to higher values does not solve the problem because the effect is the same as that due to an increase in the abundance. The difficulty in fitting the profile of several strong lines can be due to missing hyperfine structure (but this is not the case of the line at 2716.793 Å); uncertainties larger than those estimated; the adopted model, which may have an incorrect stratification in the uppermost layers; and some manganese vertical abundance stratification causing a manganese accumulation in the upper layers.
The analysis of all the Mn ii lines in HD 175640 from 1250 Å to 10000 Å, has shown that the most reliable manganese abundance is that derived from the lines of multiplet 1 in the 3438-3500 Å spectral region. The measured equivalent widths listed in Castelli & Hubrig (2004) together with the values from Den Hartog et al. (2011) give an average abundance of 4.170.03 dex. This abundance reproduces very well both the wings and the core of the lines at 3441.896, 3460.315, 3482.904, and 3488.676 Å. For the other lines of the multiplet the observed core is a little stronger than the computed value.
There are eight points outside the borders of Fig. 5, which were not plotted. They correspond to the lines listed in Table 6 for which the difference between the K14 and KSG values is larger than 1.0 dex. The uncertainties of the experimental values is high because it is included between 0.08 dex (score C+) and 0.24 dex (score E). We note that the source of the values for the first three lines in Table 6 was erroneously indicated in the NIST database as c88 (Kurucz 1988) instead of T7259 (Kling et al. 2001). The value needed to reproduce the line profile when the abundance of 4.20 dex is adopted is given in the last column of Table 6. For all the lines, this value is closer to that from K14 than to that from KGS. This result suggests that, for some lines, the experimental values may be less reliable than the calculated values.
7 Comparison of the observed and computed spectra
The plot of the comparison of the observed and computed spectra of HD 175640 in the whole 1250-3040 Å region is available at the Castelli website333http://wwwuser.oats.inaf.it/castelli/hd175640stis/tab1250-3040.html.
When we compare the whole observed region from 1250 Å to 3046 Å with the synthetic spectrum we are far from satisfied. From 1250 Å to 1692 Å the agreement is poor, except for a few lines. In fact, in spite of the rather high resolving power (R 40000 50000), the blends are so numerous and formed by so many components that it is not easy to compute them correctly. There are numerous missing lines, lines computed that are too strong, lines computed that are too weak, and lines probably affected by small wavelength errors. Furthermore, for a few elements, the abundance is different for the different ionization states. Between 1692 Å and 2332 Å the comparison is even worse because all the above problems are increased by the rather low resolving power (R 2500030000). Only in the 2332 3040 Å region does the comparison show a rather good agreement. This range is less crowded with lines than the previous regions and was observed with a very high resolving power ( 120000).
7.1 Problematic Mn ii lines
If we restrict the discussion only to the Mn ii lines, we see that there are several lines with computed profiles without an observed counterpart. For instance, all the lines arising from the even parity level 43131.51 cm-1 (3d6 a1D, J=2) are predicted as being strong, but they are either not observed at all or have a very weak observed counterpart. Another remarkable line is that at 2703.213 Å, which is predicted as very strong with both the Kurucz (2014) and Kling et al. (2001) values, i.e. 0.484 and 0.808, respectively, but is not observed at all in the spectrum. It would be too long to list here all the Mn ii lines computed as too strong compared to the observed ones. In some cases, a possible explanation for the disagreement is the severe mixing affecting one of the two energy levels involved in the transition and the difficulty in computing it. Furthermore, it is very likely that the computed stellar atmosphere is inadequate to explain all the lines observed in the spectrum, in particular for manganese which is very overabundant. In addition to the shortcoming affecting the core of the strong Mn ii lines which, as discussed in Sect. 6, is computed as too weak compared to the observed core, there are several Mn ii lines in the optical spectrum that seem to be weakened by some emission. While the computed lines are strong the observed lines are weak or even absent. All these lines are due to transitions between high-energy levels like the blend at 6446.188, 6446.247, 6446.330 Å, the lines at 6462.220, 6462.465, 6462.800, 6463.200, 6463.627 Å, those at 9903.853, 9904.428, 9905.216, 9906.2, and 9907.2 Å, among others.
On the other hand, there are a few strong lines observed in the spectrum that are identified as Mn ii in the NIST database, but which are either not predicted by the Kurucz (2014) values or are predicted as much too weak. Table A.2, available online, lists the most significant lines.
7.2 Absorption components of resonance lines
A few strong resonance lines are either double with a red component or are very broad with a redshifted line core. In this last case, the profile is the blend of the line predicted at the Ritz wavelength with an unpredicted redshifted line. In Table 7 we list in Col. 2 the Ritz wavelength and in Cols. 3 and 4 the wavelengths and of the two components when they can be disentangled. In this case is the same as the Ritz wavelength, otherwise is the wavelength of the blend of the two components unless the line is so saturated that the core lies below the zero level of the normalized flux scale and cannot be measured. The velocity shift of the component is given in Col. 5. We estimate an error of about 2.5 km sec-1 related to an uncertainty of 0.02 Å in the position of the component on the wavelength scale. The average velocity shift is 8.290.56 km s-1. We note that the Zn ii line at 2062.001 Å is predicted but not observed, while an unidentified line is present at 2062.060 Å. We assumed that it is the red component of Zn ii 2062.001 Å. However, it could be the unpredicted line of some other element as well.
Other similar peculiarities observed in HD 175640 are the bump and the broad weak component affecting the red wing of the Ca ii profiles at 3933 Å (K-line) and 3968 Å (H-line), respectively. Furthermore, strong red components can be observed for the Na i lines at 5890 Å and 5896 Å (Castelli & Hubrig, 2004). We measured a velocity shift for the Na i components equal to 7.40.7 km sec-1 and 7.70.7 km sec-1, respectively.
We cannot say whether the redshifted components are of interstellar or circumstellar origin.
| Elem | (Ritz) | (obs) | Vshift | Notes | ||
|---|---|---|---|---|---|---|
| () | () | () | km s-1 | |||
| Mg i | 2852.126 | 2852.126 | 2852.20 | 7.78 | double | |
| Mg ii | 2795.528 | saturated | ||||
| 2802.705 | saturated | |||||
| Si ii | 1808.013 | 1808.03 | ||||
| S ii | 1250.584 | 1250.60 | ||||
| Mn ii | 2576.104 | 2576.104 | 2576.18 | 8.84 | double | |
| 2593.721 | 2593.721 | 2593.80 | 9.13 | double | ||
| 2605.680 | 2605.68 | 2605.75 | 8.05 | double | ||
| Fe ii | 2343.495 | 2343.53 | ||||
| 2373.735 | 2373.735 | 2373.80 | 8.21 | double | ||
| 2382.037 | saturated | |||||
| 2585.876 | 2585.876 | 2585.94 | 7.42 | double | ||
| 2599.395 | saturated | |||||
| Zn ii | 2025.484 | 2025.51 | ||||
| 2062.001 | 2062.06 | 8.57 |
8 Conclusions
Ultraviolet and optical stellar spectra of the HgMn slowly rotating star HD 175640, observed with both HST-STIS and UVES instruments, were used to extend and discuss the atomic data of Mn ii available in the NIST database (Kramida & Sansonetti, 2013). To this purpose, Mn ii lines arising both from levels observed in the laboratory and from levels predicted with semi-empirical methods by Kurucz, were adopted.
We assigned wavelengths, energy levels and values to about 257 Mn ii lines. Of them, 109 lines had already been identified as Mn ii by Kramida & Sansonetti (2013), but were unclassfied. For another 24 lines we assigned different energy levels from those in the NIST database. This implies different energy levels, different values, and therefore a different intensity for the lines. The new Mn ii line data improve the computation of the synthetic spectra of B-type stars, although more work needs to be done on the atomic data, especially in the ultraviolet. For instance, we note that in the NIST database only wavelengths and intensities are listed for the Mn iii lines of the 1250-3040 Å region analyzed in the paper. No energy levels and no values are given for them.
As by-product of this study we have extended to the ultraviolet region the abundance analysis performed by Castelli & Hubrig (2004) in the optical region. Except for cobalt, iridium, and platinum, we confirmed the optical abundances within the error limits of the equivalent widths analysis made by Castelli& Hubrig (2004). Abundances for elements not observed in the visible, such as B , N , Al , Cl , V , Zn , Ge , As , Ag , and Cd were obtained. The abundance pattern is similar to that of other HgMn stars which have underabundances of the light elements and overabundances of some iron group elements and of some heavy elements. In the case of HD 175640, the most overabundant elements are Ti , Cr , Mn , Ga , As , Br , Y , Zr , Rh , Pd , Ag , Xe , Yb , Au , and Hg .
References
- Adelman (1994) Adelman, S. J. 1994, MNRAS, 266, 97
- Ansbacher et al. (1985) Ansbacher, W., Pinnington, E. H., Bahr, J. L., & Kernahan, J. A. 1985, Canadian Journal of Physics, 63, 1330
- Ayres (2010) Ayres, T. R. 2010, ApJS, 187, 149
- Ayres (2014) Ayres, T. R. 2014, http://casa.colorado.edu/ayres/ASTRAL/
- Bäckström et al. (2013) Bäckström, E., Nilsson, H., Engström, L., Hartman, H., & Mannervik, S. 2013, Journal of Physics B Atomic Molecular Physics, 46, 205001
- Bidelman (1962) Bidelman, W. P. 1962, AJ, 67, 111
- Biémont et al. (2011) Biémont, É., Blagoev, K., Engström, L., et al. 2011, MNRAS, 414, 3350
- Biémont et al. (2001) Biémont, E., Garnir, H. P., Li, Z. S., et al. 2001, Journal of Physics B Atomic Molecular Physics, 34, 1869
- Carpenter et al. (2014) Carpenter, K. G., Ayres, T. R., & the ASTRAL Science Teams 2014, arXiv:1411.1419
- Castelli & Bonifacio (1990) Castelli, F., & Bonifacio, P. 1990, A&AS, 84, 259
- Castelli et al. (1985) Castelli, F., Cornachin, M., Morossi, C., & Hack, M. 1985, A&AS, 59, 1
- Castelli & Hubrig (2004) Castelli, F., & Hubrig, S. 2004, A&A, 425, 263
- Castelli et al. (2008) Castelli, F., Johansson, S., & Hubrig, S. 2008, Journal of Physics Conference Series, 130, 012003
- Castelli & Kurucz (2010) Castelli, F., & Kurucz, R. L. 2010, A&A, 520, AA57
- Castelli et al. (2009) Castelli, F., Kurucz, R. L., & Hubrig, S. 2009, A&A, 508, 401
- Castelli & Parthasarathy (1995) Castelli, F., & Parthasarathy, M. 1995, Astrophysical Applications of Powerful New Databases, A.S.P. Conf. Ser. 78, 151
- Corliss & Bozman (1962) Corliss, C. H., & Bozman, W. R. 1962, NBS Monograph, Washington: US Department of Commerce, National Bureau of Standards, —c1962,
- (18) Cowan, R. D. 1981, The Theory of Atomic Structure and Spectra (Berkeley: Univ. California Press)
- Cowley & Hensberge (1981) Cowley, C. R., & Hensberge, H. 1981, ApJ, 244, 252
- Den Hartog et al. (2011) Den Hartog, E. A., Lawler, J. E., Sobeck, J. S., Sneden, C., & Cowan, J. J. 2011, ApJS, 194, 35
- Dworetsky (1969) Dworetsky, M. M. 1969, ApJ, 156, L101
- Holt et al. (1999) Holt, R. A., Scholl, T. J., & Rosner, S. D. 1999, MNRAS, 306, 107
- Iglesias & Velasco (1964) Iglesias, L., & Velasco, R. 1964, The spectrum of the Mn+ ion , by Iglesias, Laura.; Velasco, R. Madrid : Consejo Superior de Investigaciones Cientificas, [1964],
- Ivarsson et al. (2004) Ivarsson, S., Wahlgren, G. M., Dai, Z., Lundberg, H., & Leckrone, D. S. 2004, A&A, 425, 353
- Kling & Griesmann (2000) Kling, R., & Griesmann, U. 2000, ApJ, 531, 1173
- Kling et al. (2001) Kling, R., Schnabel, R., & Griesmann, U. 2001, ApJS, 134, 173
- Kramida & Sansonetti (2013) Kramida, A., & Sansonetti, J. E. 2013, ApJS, 205, 14
- Kramida et al. (2014) Kramida, A., Ralchenko, Y., Reader, J., & NIST ASD Team 2014, NIST Atomic Spectra Database (ver. 5.2), available at: http://physics.nist.gov/asd
- Kurucz (1988) Kurucz, R. L. 1988, Trans. IAU,XXB, edited by McNally (Dordrecht:Kluwer,1988),pp.168-172. Data available at http://kurucz.harvard.edu/linelists/gfall/
- Kurucz (1993) Kurucz, R. 1993, SYNTHE Spectrum Synthesis Programs and Line Data. Kurucz CD-ROM No. 18. Cambridge, Mass.: Smithsonian Astrophysical Observatory, 1993., 18. Data available at http://kurucz.harvard.edu/linelists/gfall/
- Kurucz (2005) Kurucz, R. L. 2005, Memorie della Societa Astronomica Italiana Supplementi, 8, 14
- Kurucz (2011) Kurucz, R. L. 2011, Canadian Journal of Physics, 89, 417. Data available at http://kurucz.harvard.edu/atoms/
- Kurucz (2014) Kurucz, R. L. 2014, File hyper250155.pos available at http://kurucz.harvard.edu/atoms/2501/
- Lundberg et al. (1996) Lundberg, H., Johansson, S. G., Larsson, J., et al. 1996, ApJ, 469, 388
- Moore (1950) Moore, C. E. 1950, NBS Circular 488, Washington: US Government Printing Office (USGPO)
- Nave & Johansson (2013) Nave, G., & Johansson, S. 2013, ApJS, 204, 1
- Nielsen et al. (2005) Nielsen, K. E., Wahlgren, G. M., Proffitt, C. R., Leckrone, D. S., & Adelman, S. J. 2005, AJ, 130, 2312
- Peterson & Kurucz (2015) Peterson, R. C., & Kurucz, R. L. 2015, ApJS, 216, 1
- Proffitt et al. (1999) Proffitt, C. R., Brage, T., Leckrone, D. S., et al. 1999, ApJ, 512, 942
- Quinet (1996) Quinet, P. 1996, Phys. Scr, 54, 483
- Quinet et al. (2012) Quinet, P., Biémont, E., Palmeri, P., et al. 2012, A&A, 537, AA74
- Rosberg & Wyart (1997) Rosberg, M., & Wyart, J.-F. 1997, Phys. Scr, 55, 690
- Ryabchikova et al. (1997) Ryabchikova, T. A., Piskunov, N. E., Kupka, F., & Weiss, W. W. 1997, Baltic Astronomy, 6, 244, http://vald.inasan.ru/vald3/php/vald.php
- Ryabtsev et al. (1993) Ryabtsev, A. N., Wyart, J.-F., Joshi, Y. N., Raassen, A. J. J., & Uylings, P. H. M. 1993, Phys. Scr, 47, 45
- Sugar & Corliss (1985) Sugar, J., & Corliss, C. 1985, Washington: American Chemical Society, 1985,
- Uylings & Raassen (1997) Uylings, P. H. M., & Raassen, A. J. J. 1997, A&AS, 125, 539
- Warner & Kirkpatrick (1969) Warner, B., & Kirkpatrick, R. C. 1969, MNRAS, 142, 265
- Wyart et al. (1995) Wyart, J.-F., Blaise, J., & Joshi, Y. N. 1995, Phys. Scr, 52, 535
- Wyart et al. (1996) Wyart, J.-F., Joshi, Y. N., Tchang-Brillet, L., & Raassen, A. J. J. 1996, Phys. Scr, 53, 174
Appendix A Heavy elements in HD 175640
We based the abundance analysis in the ultraviolet mostly on
the lines listed by Castelli et al.
(1985) and by Castelli & Bonifacio (1990) in their study
of HR 6000 and Her, respectively. The multiplet numbers given
in the above papers refer to the Ultraviolet Multiplet Table by Moore (1950).
In addition, we made a wide use of the NIST database (Kramida et al. 2014)
to search for the most intense lines of a given element.
In this section we give some more details only about heavy elements
from copper to mercury.
Copper (Cu) Z=29: The abundance of 6.50 dex was estimated
from the Cu ii lines at 1358.773, 1367.951, 1472.395, 2112.100,
2135.981, 2192.268, 2242.618, and 2247.003 Å. All the lines
are blended. The values are data computed by Kurucz in 2011
and were taken from his database.
Zinc (Zn) Z=30: The zinc abundance was derived from the line of
Zn ii at 2064.227 Å. The value 0.070 is
from the NIST database.
The Zn ii line at 2062.001 Å originating from a lower level
with energy equal to 0.00 cm-1 is predicted, but not observed.
The value 0.329 is from the Kurucz database. The other
line from the zero energy level at 2025.484 Å is computed too weak
and is blended with a strong unidentified line that we assumed to be
of interstellar or circumstellar origin. No Zn iii lines were
observed.
Gallium (Ga) Z=31: For Ga i, Ga ii, and Ga iii,
wavelengths, energy levels, and values were taken from the
NIST database when available.
For Ga i, only the lines at 2874.23, 2943.64, and 2944.17 Å were well observed.
For the Ga ii lines with values not available in the
NIST database, we used values from Nielsen et al. (2005)
(lines at at 1463.576, 1473.690, 1483.453, and 1483.903 Å).
For the remaining lines values were computed from the lifetime
measuraments of Ansbacher et al. (1985) or estimated on the basis
of laboratory intensities and excitation energies
(Castelli & Parthasarathy 1995).
The abundance 5.43 dex ([+3.6]) derived from the optical region
adequately reproduces the unblended Ga ii lines at 1473.690, 1483.903,
1504.334, 1536.276 Å, as well as the blended lines
at 1514.505, 1535.312 Å.
The Ga ii broad line at 1414.399 Å has too narrow wings, but
the classical broadening parameters adopted here are probably not correct.
Vice versa, both Ga iii profiles at 1495.045 and 1534.462 Å display
wings that are too broad. Only these two Ga iii lines have
values available in the NIST database. For other lines we adopted
estimated values.
No isotopic and hyperfine structure was considered in the computations.
Germanium (Ge) Z=32: Several Ge ii lines were observed. From the
line at 1649.19 Å we derived an underabundance of 1.7 dex relative to
the solar value. We adopted loggf= 0.28 from the NIST database
Arsenic (As) Z=33): The lines of As ii at 1263.77, 1266.34, 1280.987,
and 1287.54 Å were observed in the spectrum. We adopted
values from Warner& Kirkpatrick (1969) for all them.
The observed lines are adequately predicted for an overabundance of 7.50 dex.
Yttrium (Y) Z=39: For the Y ii lines, we used the
Kurucz database, which includes hyperfine components for several lines.
All the lines are blended, except for the strong line at 2422.18 Å.
The abundance of 6.66 dex [+3.2] derived from the optical spectrum is well
suited to reproducing the observed profile.
We added to the line list the Y iii lines from Biémont et al. (2011).
We modified the two wavelengths 2817.037 Å and 2946.01 Å in
2817.027 Å and 2945.995 Å, in order
to match the observed spectrum. The Y iii lines at 2367.228,
2414.643, 2817.027, and 2945.995 Å were observed. They are
strong lines, either unblended or marginally blended.
The abundance from Y iii is
larger than the abundance from Y ii by about 1.0 dex.
Zirconium (Zr) Z=40:
Several weak Zr iii lines were observed in the spectrum,
but no Zr ii line. A few Zr iii lines are unblended,
like that at 2102.283 Å.
The Zr iii line data from the NIST database were adopted.
The Zr iii abundance agrees, within the error limits,
with the value we obtained from the Zr ii optical lines.
Rhodium (Rh) Z=45: Numerous weak Rh ii lines were observed
in the spectrum. The line at 1604.45 Å is unblended.
Oscillator strengths from Bäckström et al. (2013),
Quinet et al. (2012), and Corliss& Bozman (1962) were used.
The wavelengths from the NIST database agree more closely with the stellar
wavelengths than the wavelengths adopted by Bäckström et al. (2013).
The difference is on the order of 0.02 Å.
The abundance of 8.50 dex, which was estimated from the UVES spectra on
the basis of estimated values, reproduces the ultraviolet lines
in a satisfactory way. None of the Rh iii lines listed in the NIST database was
identified.
Palladium (Pd) Z=46: Numerous Pd ii lines were identified. All the lines from the
4d85s4d85p transitions and the strongest lines from the
4d85p4d86s transitions, together with their oscillator strengths,
from Quinet (1996) were added in the line lists.
Additional lines were taken from Lundberg et al. (1996) and from the NIST database.
Unblended lines are those at 2351.347, 2367.966, 2388.310, 2414.7303, 2426.867,
2433.102, 2446.713, 2457.257, 2472.502, 2486.256, 2488.914, 2505.729,
2565.505, 2569.544, 2635.93, and 2658.72 Å.
None of the Pd i lines listed in the NIST database was identified.
For Pd iii, only the line at 1782.55 Å, which according to the
NIST data is the one
with the largest intensity in the 1250-3040 Å range,
perhaps contributes to a strong blend observed at 1782.6 Å.
Silver (Ag) Z=47: The Ag ii lines at 2246.412, 2248.749,
2357.917, and
2411.345 Å were observed. The values from
the NIST database were used when available, otherwise we used
the Corliss & Botzman (1962) data, as we did for the line at
2438.325 Å, which is computed as too strong.
Cadmium (Cd) Z=48: The Cd ii lines at 2144.393 Å and 2265.019 Å were observed and predicted by adopting a 0.8 overabundance over the
solar value. The atomic data are from the Kurucz database.
The values are the same as in the NIST database.
Indium (In) Z=49: The In ii line at 1586.331 Å, which is predicted
as rather strong for solar abundance and value
from the NIST database, is the main component
of a complex blend formed by several other lines. We were unable to
determine the indium abundance from the blend.
Barium (Ba) Z=56: The two strongest Ba ii lines at 2304.249 Å and 2335.267 Å are heavily blended, and so they cannot be used
to confirm the abundance derived from the optical region. No other
Ba ii lines were observed.
Ytterbium (Yb) Z=70: We adopted the abundance of 8.10 dex ([+3.0])
derived from the UVES spectra.
We investigated only the Yb ii lines with available
in the NIST database. The lines at
2185.716, 2653.745, and 2750.478 can be observed as single weak lines.
Some other lines are weak components of blends.
We added to the line list all the Yb iii lines
from Biémont et al. (2001)
with an upper energy level lower than 100000 cm-1.
There are numerous Yb iii lines in the spectrum. Their profile
is very sharp and would require an abundance about 1 dex larger than
that derived from the Yb ii lines in order to agree with the
computed profiles. The same behavior for Yb ii and
Yb iii abundances was observed in the visible
(Castelli & Hubrig 2004).
Osmium (Os) Z=76: No Os ii lines were observed
Iridium (Ir) Z=77:
Except for the weak line observed
at 2245.750 Å, no other Ir ii lines can be
conclusively identified in the spectrum. From this
line we derived an abundance of 11.15 dex, i.e
an underabundance of [-0.5]. The values for Ir ii
were taken from the Kurucz database.
None of the Ir ii lines listed in Ivarsson et
al. (2004) was observed in the spectrum, even assuming a
solar abundance.
The Ir ii line at 3042.553 Å is a minor contributor of a blend with Ti ii.
The blending was not considered when we analyzed
the UVES spectrum, so that we derived a solar iridium
abundance (Castelli & Hubrig 2004).
Platinum (Pt) Z=78: For Pt ii and Pt iii we adopted the lines and the
transition probabilities listed by Wyart et al. (1995)
and by Ryabtsev et al. (1993), respectively.
We did not find any clear evidence for a Pt overabundance.
Only the Pt ii line at 1777.086 Å is predicted with solar abundance
and observed. It is a blend with Fe ii 1777.058 Å, which is computed
as weaker than observed, but an overabundance of platinum
gives rise to computed lines not observed in the spectrum.
We believe that the line at 4514.124 Å,
identified as Pt ii in the UVES spectrum (Castelli & Hubrig 2004),
is actually due to some other element.
Gold (Au) Z=79: Gold is overabundant by 3.6 dex. The abundance from the optical region
adequately reproduces the
numerous Au ii lines observed in the ultraviolet. A few of them are unblended,
good examples being the Au ii lines at 1469.142, 1673.587, 1740.475,
1793.297 (blend), and 1800.579 Å. There are several predicted Au iii lines,
but they are all blended, except for those at 1365.382 and 1385.768 Å.
We adopted the Au ii and Au iii line lists from
Rosberg & Wyart (1997) and Wyart et al. (1996), respectively.
Mercury (Hg) Z=80:
The values for Hg i and Hg ii were taken from the NIST
database. For Hg iii we considered only the three lines at 1360.509,
1647.482, and 1738.540 Å listed by
Profitt et al. (1999).
The abundance of 6.60 dex is well suited to reproducing the lines in the ultraviolet,
while 6.30 dex derived from the Hg ii line at 3984 Å (Castelli & Hubrig 2004)
is too large. We did not consider any hyperfine structure in
the computation of the ultraviolet lines.
For Hg i, the line at 1849.499 Å is blended, while the line at 2536.521 Å is very weak.
No other lines with available values were observed.
Numerous lines of Hg ii were observed and computed. For instance, the line at
1942.273 Å is strong, but it is blended with Mn ii at 1942.344 Å.
Two lines at
1321.712 Å and 1331.738 Å are single and well reproduced, those at 1354.289, 1539.142,
and 1869.226 Å are strong, but blended.
For Hg iii, the line at 1360.509 Å is computed as too strong,
that at 1647.471 Å would be adequately
reproduced if the Mn iii line at 1647.497 Å were omitted;
finally, the line at 1738.540 Å is blended with numerous other components.
| Upper level | Lower level | (Ritz) | (NIST) | Notes | |||||||
|---|---|---|---|---|---|---|---|---|---|---|---|
| Eup(cm-1) | Conf. | Term | J | Elow(cm-1) | Conf. | Term | J | Å | K14 | Å | |
| 82303.415 | 3d4(5D)4s4p(3P) | 7Fo | 3.0 | 14325.866 | 3d6 | a5D | 4.0 | 1471.074 | 3.902 | ||
| 14593.835 | 3d6 | a5D | 3.0 | 1476.896 | 3.407 | ||||||
| 14781.205 | 3d6 | a5D | 2.0 | 1480.994 | 1.901 | ||||||
| 29869.420 | 3d6 | a3P | 2.0 | 1907.160 | 3.174 | ||||||
| 43395.395 | 3d5(2D)4s | c3D | 3.0 | 2569.394 | 0.806 | ||||||
| 43696.217 | 3d5(4F)4s | a5F | 3.0 | 2589.416 | 2.294 | 2589.42 | unassigned | ||||
| 43850.341 | 3d5(4F)4s | a5F | 2.0 | 2599.795 | 1.673 | 2599.794 | unassigned | ||||
| 44521.540 | 3d5(2F)4s | b3F | 4.0 | 2645.984 | 1.855 | 2645.99 | unassigned | ||||
| 46903.320 | 3d5(2D)4s | b1D | 2.0 | 2824.020 | 0.594 | ||||||
| 82564.493 | 3d4(5D)4s4p(3P) | 7Fo | 4.0 | 32857.270 | 3d5(4D)4s | b5D | 3.0 | 2011.131 | 2.962 | ||
| 43395.395 | 3d5(2D)4s | c3D | 3.0 | 2552.269 | 2.421 | 2552.272 | unassigned | ||||
| 43528.661 | 3d5(4F)4s | a5F | 5.0 | 2560.983 | 1.875 | 2560.981 | unassigned | ||||
| 43537.186 | 3d5(4F)4s | a5F | 4.0 | 2561.542 | 1.716 | 2561.542 | unassigned | ||||
| 43696.217 | 3d5(4F)4s | a5F | 3.0 | 2572.024 | 2.444 | 2572.023 | unassigned | ||||
| 100320.586 | 3d5(b2D)4p | 3Fo | 2.0 | 31761.210 | 3d6 | a3F | 2.0 | 1458.590 | 1.756 | ||
| 33278.730 | 3d5(4G)4s | a3G | 3.0 | 1491.605 | 1.533 | ||||||
| 35004.790 | 3d6 | b3G | 3.0 | 1531.023 | 1.231 | ||||||
| 37811.880 | 3d6 | a3D | 1.0 | 1599.777 | 1.533 | ||||||
| 62564.771 | 3d5(2D)4s | d3D | 1.0 | 2647.810 | 0.092 | 2647.811 | DIFFERENT assign. | ||||
| 62572.199 | 3d5(2D)4s | d3D | 2.0 | 2648.331 | 0.277 | 2648.339 | unassigned | ||||
| 62587.547 | 3d5(2D)4s | d3D | 3.0 | 2649.408 | 1.196 | ||||||
| 100725.176 | 3d5(b2D)4p | 3Fo | 4.0 | 31514.710 | 3d6 | a3F | 4.0 | 1444.868 | 1.594 | ||
| 33147.710 | 3d5(4G)4s | a3G | 5.0 | 1479.783 | 1.133 | ||||||
| 34762.098 | 3d6 | b3G | 5.0 | 1516.000 | 1.053 | ||||||
| 37851.490 | 3d6 | a3D | 3.0 | 1590.490 | 1.376 | ||||||
| 49517.690 | 3d5(2G)4s | c3G | 5.0 | 1952.839 | 1.587 | ||||||
| 52383.780 | 3d5(2F)4s | d3F | 4.0 | 2067.960 | 1.386 | ||||||
| 62587.547 | 3d5(2D)4s | d3D | 3.0 | 2621.300 | 0.408 | 2621.300 | unassigned | ||||
| 101807.469 | 3d5(b2D)4p | 3Po | 1.0 | 62564.771 | 3d5(2D)4s | d3D | 1.0 | 2547.480 | 0.526 | 2547.48 | unassigned |
| 62572.199 | 3d5(2D)4s | d3D | 2.0 | 2547.962 | 0.338 | 2547.966 | unassigned | ||||
| 106351.582 | 3d6(4G)4d | 5F | 1.0 | 64456.720 | 3d5(4G)4p | z5Go | 2.0 | 2386.200 | 0.175 | 2386.206 | unassigned |
| 66676.833 | 3d5(4P)4p | z5Do | 2.0 | 2519.737 | 0.870 | ||||||
| 66894.130 | 3d5(4G)4p | z5Fo | 1.0 | 2533.614 | 0.211 | 2533.610 | unassigned | ||||
| 66901.494 | 3d5(4G)4p | z5Fo | 2.0 | 2534.087 | 0.725 | ||||||
| 70150.760 | 3d5(4P)4p | y5Fo | 1.0 | 2761.552 | 1.333 | ||||||
| 106348.454 | 3d6(4G)4d | 5F | 2.0 | 64456.720 | 3d5(4G)4p | z5Go | 2.0 | 2386.378 | 0.595 | ||
| 64473.421 | 3d5(4G)4p | z5Go | 3.0 | 2387.330 | 0.094 | ||||||
| 66645.116 | 3d5(4P)4p | z5Do | 1.0 | 2517.922 | 1.189 | ||||||
| 66676.833 | 3d5(4P)4p | z5Do | 2.0 | 2519.935 | 0.488 | ||||||
| 66686.739 | 3d5(4G)4p | z5Fo | 3.0 | 2520.565 | 0.443 | ||||||
| 66894.130 | 3d5(4G)4p | z5Fo | 1.0 | 2533.815 | 0.440 | 2533.817 | unassigned. | ||||
| 66901.494 | 3d5(4G)4p | z5Fo | 2.0 | 2534.288 | 0.312 | ||||||
| 67009.217 | 3d5(4P)4p | z5Do | 3.0 | 2541.228 | 0.989 | ||||||
| 106340.485 | 3d6(4G)4d | 5F | 3.0 | 64473.421 | 3d5(4G)4p | z5Go | 3.0 | 2387.784 | 0.494 | ||
| 64494.140 | 3d5(4G)4p | z5Go | 4.0 | 2388.967 | 0.032 | ||||||
| 66643.296 | 3d5(4G)4p | z5Fo | 4.0 | 2518.312 | 0.342 | 2518.311 | DIFFERENT assign. | ||||
| 66676.833 | 3d5(4P)4p | z5Do | 2.0 | 2520.442 | 0.519 | ||||||
| 66686.739 | 3d5(4G)4p | z5Fo | 3.0 | 2521.071 | 0.003 | 2521.081 | unassigned | ||||
| 66901.494 | 3d5(4G)4p | z5Fo | 2.0 | 2534.800 | 0.465 | 2534.804 | unassigned | ||||
| 67009.217 | 3d5(4P)4p | z5Do | 3.0 | 2541.743 | 0.511 | 2541.740 | DIFFERENT assign. | ||||
| Upper level | Lower level | (Ritz) | (NIST) | Notes | |||||||
|---|---|---|---|---|---|---|---|---|---|---|---|
| Eup(cm-1) | Conf. | Term | J | Elow(cm-1) | Conf. | Term | J | Å | K14 | Å | |
| 106324.758 | 3d6(4G)4d | 5F | 4.0 | 64494.140 | 3d5(4G)4p | z5Go | 4.0 | 2389.865 | 0.611 | ||
| 64518.890 | 3d5(4G)4p | z5Go | 5.0 | 2391.280 | 0.178 | 2391.281 | unassigned | ||||
| 65658.650 | 3d5(4G)4p | z5Ho | 5.0 | 2458.306 | 0.937 | ||||||
| 66542.539 | 3d5(4G)4p | z5Fo | 5.0 | 2512.929 | 0.462 | 2512.932 | unassigned | ||||
| 66643.296 | 3d5(4G)4p | z5Fo | 4.0 | 2519.310 | 0.320 | 2519.312 | DIFFERENT assign. | ||||
| 66686.739 | 3d5(4G)4p | z5Fo | 3.0 | 2522.072 | 0.278 | ||||||
| 67009.217 | 3d5(4P)4p | z5Do | 3.0 | 2542.760 | 0.951 | ||||||
| 67295.446 | 3d5(4P)4p | z5Do | 4.0 | 2561.409 | 0.930 | 2561.412 | unassigned | ||||
| 70497.790 | 3d5(4D)4p | y5Fo | 4.0 | 2790.371 | 0.953 | ||||||
| 106298.960 | 3d6(4G)4d | 5F | 5.0 | 64518.890 | 3d5(4G)4p | z5Go | 5.0 | 2392.757 | 0.993 | ||
| 64550.040 | 3d5(4G)4p | z5Go | 6.0 | 2394.542 | 0.303 | 2394.54 | unassigned | ||||
| 65754.820 | 3d5(4G)4p | z5Ho | 6.0 | 2465.702 | 1.037 | ||||||
| 66542.539 | 3d5(4G)4p | z5Fo | 5.0 | 2514.560 | 0.558 | 2514.567 | unassigned | ||||
| 66643.296 | 3d5(4G)4p | z5Fo | 4.0 | 2520.949 | 0.398 | 2520.958 | unassigned. | ||||
| 70657.595 | 3d5(4D)4p | y5Fo | 5.0 | 2804.902 | 0.782 | ||||||
| 106408.011 | 3d5(4G)4d | 5G | 2.0 | 64456.720 | 3d5(4G)4p | z5Go | 2.0 | 2382.990 | 0.182 | 2382.991 | DIFFERENT assign |
| 64473.421 | 3d5(4G)4p | z5Go | 3.0 | 2383.939 | 0.267 | ||||||
| 65483.120 | 3d5(4G)4p | z5Ho | 3.0 | 2442.760 | 0.781 | ||||||
| 66894.130 | 3d5(4G)4p | z5Fo | 1.0 | 2529.996 | 0.415 | 2529.999 | unassigned | ||||
| 66901.494 | 3d5(4G)4p | z5Fo | 2.0 | 2530.467 | 0.999 | ||||||
| 106408.348 | 3d5(4G)4d | 5G | 3.0 | 64456.720 | 3d5(4G)4p | z5Go | 2.0 | 2382.971 | 0.565 | ||
| 64473.421 | 3d5(4G)4p | z5Go | 3.0 | 2383.920 | 0.229 | 2383.921 | unassigned | ||||
| 64494.140 | 3d5(4G)4p | z5Go | 4.0 | 2385.099 | 0.087 | 2385.096 | unassigned | ||||
| 65483.120 | 3d5(4G)4p | z5Ho | 3.0 | 2442.740 | 0.775 | ||||||
| 65566.030 | 3d5(4G)4p | z5Ho | 4.0 | 2447.699 | 0.799 | 2447.697 | unassigned | ||||
| 66676.833 | 3d5(4P)4p | z5Do | 2.0 | 2516.136 | 0.552 | ||||||
| 66686.739 | 3d5(4G)4p | z5Fo | 3.0 | 2516.764 | 0.705 | ||||||
| 66901.494 | 3d5(4G)4p | z5Fo | 2.0 | 2530.446 | 0.446 | 2530.447 | unassigned | ||||
| 106406.642 | 3d5(4G)4d | 5G | 4.0 | 64473.421 | 3d5(4G)4p | z5Go | 3.0 | 2384.017 | 0.404 | ||
| 64494.140 | 3d5(4G)4p | z5Go | 4.0 | 2385.196 | 0.344 | ||||||
| 64518.890 | 3d5(4G)4p | z5Go | 5.0 | 2386.605 | 0.093 | 2386.605 | DIFFERENT assign. | ||||
| 65566.030 | 3d5(4G)4p | z5Ho | 4.0 | 2447.802 | 0.474 | 2447.803 | unassigned | ||||
| 65658.650 | 3d5(4G)4p | z5Ho | 5.0 | 2453.366 | 0.682 | 2453.371 | unassigned | ||||
| 66643.296 | 3d5(4G)4p | z5Fo | 4.0 | 2514.122 | 0.713 | ||||||
| 66686.739 | 3d5(4G)4p | z5Fo | 3.0 | 2516.872 | 0.103 | 2516.875 | unassigned | ||||
| 67009.217 | 3d5(4P)4p | z5Do | 3.0 | 2537.475 | 0.703 | 2537.480 | unassigned | ||||
| 106400.766 | 3d5(4G)4d | 5G | 5.0 | 64494.140 | 3d5(4G)4p | z5Go | 4.0 | 2385.530 | 0.387 | 2385.532 | unassigned |
| 64518.890 | 3d5(4G)4p | z5Go | 5.0 | 2386.940 | 0.479 | 2386.940 | unassigned | ||||
| 64550.040 | 3d5(4G)4p | z5Go | 6.0 | 2388.717 | 0.289 | 2388.72 | DIFFERENT assign. | ||||
| 65658.650 | 3d5(4G)4p | z5Ho | 5.0 | 2453.720 | 0.319 | 2453.721 | unassigned | ||||
| 65754.820 | 3d5(4G)4p | z5Ho | 6.0 | 2459.526 | 0.466 | 2459.53 | DIFFERENT assign | ||||
| 66542.539 | 3d5(4G)4p | z5Fo | 5.0 | 2508.137 | 1.088 | ||||||
| 66643.296 | 3d5(4G)4p | z5Fo | 4.0 | 2514.494 | 0.145 | 2514.503 | unassigned | ||||
| 106387.310 | 3d5(4G)4d | 5G | 6.0 | 64518.890 | 3d5(4G)4p | z5Go | 5.0 | 2387.707 | 0.513 | ||
| 64550.040 | 3d5(4G)4p | z5Go | 6.0 | 2389.485 | 0.616 | 2389.49 | unassigned | ||||
| 65754.820 | 3d5(4G)4p | z5Ho | 6.0 | 2460.340 | 0.319 | ||||||
| 65847.030 | 3d5(4G)4p | z5Ho | 7.0 | 2465.937 | 0.199 | 2465.944 | unassigned. | ||||
| 66542.539 | 3d5(4G)4p | z5Fo | 5.0 | 2508.984 | 0.281 | 2508.984 | unassigned | ||||
| 107192.929 | 3d5(4G)4d | 3D | 3.0 | 66643.296 | 3d5(4G)4p | z5Fo | 4.0 | 2465.368 | 0.954 | ||
| 67812.087 | 3d5(4G)4p | z3Fo | 3.0 | 2538.543 | 0.477 | 2538.543 | unassigned | ||||
| 67865.945 | 3d5(4G)4p | z3Fo | 4.0 | 2542.020 | 0.499 | 2542.024 | unassigned | ||||
| 73395.444 | 3d5(4D)4p | y3Do | 3.0 | 2957.936 | 0.752 | 2957.920 | DIFFERENT assign. | ||||
| Upper level | Lower level | (Ritz) | (NIST) | Notes | |||||||
|---|---|---|---|---|---|---|---|---|---|---|---|
| Eup(cm-1) | Conf. | Term | J | Elow(cm-1) | Conf. | Term | J | Å | K14 | Å | |
| 107155.877 | 3d5(4G)4d | 3I | 5.0 | 67846.240 | 3d5(4G)4p | z3Ho | 5.0 | 2543.142 | 0.656 | ||
| 67910.560 | 3d5(4G)4p | z3Ho | 4.0 | 2547.310 | 0.810 | 2547.31 | unassigned | ||||
| 107145 038 | 3d5(4G)4d | 3I | 6.0 | 67744.440 | 3d5(4G)4p | z3Ho | 6.0 | 2537.27 | 0.644 | 2537.265 | unassigned |
| 67846.240 | 3d5(4G)4p | z3Ho | 5.0 | 2543.843 | 0.885 | 2543.851 | unassigned | ||||
| 107114.165 | 3d5(4G)4d | 3I | 7.0 | 64550.040 | 3d5(4G)4p | z5Go | 6.0 | 2348.677 | 1.321 | ||
| 67744.440 | 3d5(4G)4p | z3Ho | 6.0 | 2539.260 | 0.960 | 2539.272 | unassigned | ||||
| 107999.208 | 3d5(4G)4d | 3G | 3.0 | 67766.817 | 3d5(4G)4p | z3Fo | 2.0 | 2484.809 | 0.024 | 2484.808 | unassigned |
| 67910.560 | 3d5(4G)4p | z3Ho | 4.0 | 2493.720 | 0.379 | 2493.716 | unassigned | ||||
| 70518.06 | 3d5(4G)4p | z3Go | 3.0 | 2667.215 | 0.351 | 2667.215 | unassigned | ||||
| 108007.750 | 3d5(4G)4d | 3G | 4.0 | 67812.087 | 3d5(4G)4p | z3Fo | 3.0 | 2487.080 | 0.149 | 2487.089 | unassigned |
| 67846.240 | 3d5(4G)4p | z3Ho | 5.0 | 2489.195 | 0.283 | 2489.206 | unassigned | ||||
| 70518.06 | 3d5(4G)4p | z3Go | 3.0 | 2666.607 | 0.996 | ||||||
| 70546.340 | 3d5(4G)4p | z3Go | 4.0 | 2668.620 | 0.440 | 2668.620 | unassigned. | ||||
| 108006.293 | 3d5(4G)4d | 3G | 5.0 | 67744.440 | 3d5(4G)4p | z3Ho | 6.0 | 2482.991 | 0.181 | ||
| 67865.945 | 3d5(4G)4p | z3Fo | 4.0 | 2490.508 | 0.234 | 2490.508 | unassigned | ||||
| 70527.61 | 3d5(4G)4p | z3Go | 5.0 | 2667.390 | 0.553 | 2667.393 | unassigned | ||||
| 73683.440 | 3d5(4D)4p | y3Fo | 4.0 | 2912.658 | 0.989 | ||||||
| 108420.629 | 3d5(4G)4d | 3F | 2.0 | 67766.817 | 3d5(4G)4p | z3Fo | 2.0 | 2459.050 | 0.081 | 2459.042 | unassigned |
| 67812.087 | 3d5(4G)4p | z3Fo | 3.0 | 2461.791 | 0.783 | ||||||
| 70518.06 | 3d5(4G)4p | z3Go | 3.0 | 2637.558 | 0.066 | ||||||
| 71078.501 | 3d5(4P)4p | z3Do | 1.0 | 2677.145 | 0.832 | ||||||
| 108425.105 | 3d5(4G)4d | 3F | 3.0 | 67812.087 | 3d5(4G)4p | z3Fo | 3.0 | 2461.520 | 0.210 | 2461.525 | DIFFERENT assign. |
| 67865.945 | 3d5(4G)4p | z3Fo | 4.0 | 2464.789 | 0.771 | ||||||
| 70497.790 | 3d5(4D)4p | y5Fo | 4.0 | 2645.837 | 1.420 | 2635.84 | unassigned | ||||
| 70546.340 | 3d5(4G)4p | z3Go | 4.0 | 2639.215 | 0.082 | 2639.220 | unassigned. | ||||
| 70940.568 | 3d5(4P)4p | z3Do | 2.0 | 2666.974 | 0.824 | ||||||
| 73396.334 | 3d5(4D)4p | y3Do | 2.0 | 2853.958 | 0.911 | ||||||
| 108420.479 | 3d5(4G)4d | 3F | 4.0 | 67865.945 | 3d5(4G)4p | z3Fo | 4.0 | 2465.070 | 0.389 | 2465.075 | unassigned |
| 70527.61 | 3d5(4G)4p | z3Go | 5.0 | 2638.233 | 0.200 | ||||||
| 70745.387 | 3d5(4P)4p | z3Do | 3.0 | 2653.484 | 0.753 | ||||||
| 73395.444 | 3d5(4D)4p | y3Do | 3.0 | 2854.262 | 0.745 | ||||||
| 73683.440 | 3d5(4D)4p | y3Fo | 4.0 | 2877.927 | 0.892 | ||||||
| 108617.023 | 3d6(4P)4d | 5P | 1.0 | 66901.494 | 3d5(4G)4p | z5Fo | 2.0 | 2396.459 | 1.205 | 2396.467 | unassigned |
| 66929.517 | 3d5(4P)4p | z5So | 2.0 | 2398.070 | 0.018 | 2398.082 | unassigned | ||||
| 68417.697 | 3d5(4P)4p | y5Po | 2.0 | 2486.853 | 0.456 | ||||||
| 68496.694 | 3d5(4P)4p | y5Po | 1.0 | 2491.750 | 1.034 | ||||||
| 69044.910 | 3d5(4P)4p | z3Po | 2.0 | 2526.272 | 1.004 | 2526.287 | unassigned | ||||
| 108399.148 | 3d6(4P)4d | 5P | 3.0 | 66929.517 | 3d5(4P)4p | z5So | 2.0 | 2410.670 | 0.286 | ||
| 68284.664 | 3d5(4P)4p | y5Po | 3.0 | 2492.113 | 0.107 | 2492.129 | DIFFERENT assign. | ||||
| 68417.697 | 3d5(4P)4p | y5Po | 2.0 | 2500.406 | 0.255 | 2500.418 | unassigned | ||||
| 72011.050 | 3d5(4D)4p | y5Do | 4.0 | 2747.339 | 0.857 | ||||||
| 108511.206 | 3d6(4P)4d | 5F | 1.0 | 66625.296 | 3d5(4P)4p | z5Do | 0.0 | 2386.710 | 0.141 | 2386.715 | DIFFERENT assign. |
| 66645.116 | 3d5(4P)4p | z5Do | 1.0 | 2387.840 | 0.132 | ||||||
| 66676.833 | 3d5(4P)4p | z5Do | 2.0 | 2389.651 | 0.974 | ||||||
| Upper level | Lower level | (Ritz) | (NIST) | Notes | |||||||
|---|---|---|---|---|---|---|---|---|---|---|---|
| Eup(cm-1) | Conf. | Term | J | Elow(cm-1) | Conf. | Term | J | Å | K14 | Å | |
| 108521.377 | 3d6(4P)4d | 5F | 2.0 | 66645.116 | 3d5(4P)4p | z5Do | 1.0 | 2387.260 | 0.036 | 2387.268 | unassigned |
| 66676.833 | 3d5(4P)4p | z5Do | 2.0 | 2389.070 | 0.152 | 2389.075 | unassigned | ||||
| 66894.130 | 3d5(4G)4p | z5Fo | 1.0 | 2401.542 | 0.773 | ||||||
| 66901.494 | 3d5(4G)4p | z5Fo | 2.0 | 2401.967 | 0.278 | ||||||
| 67009.217 | 3d5(4P)4p | z5Do | 3.0 | 2408.200 | 0.818 | ||||||
| 72247.730 | 3d5(4D)4p | y5Do | 3.0 | 2756.008 | 1.771 | 2756.01 | unassigned | ||||
| 108561.169 | 3d5(4P)4d | 5F | 3.0 | 66676.833 | 3d5(4P)4p | z5Do | 2.0 | 2386.800 | 0.095 | ||
| 66686.739 | 3d5(4P)4p | z5Fo | 3.0 | 2387.364 | 0.542 | ||||||
| 66901.494 | 3d5(4G)4p | z5Fo | 2.0 | 2399.672 | 0.012 | 2399.685 | unassigned | ||||
| 66929.517 | 3d5(4P)4p | z5So | 2.0 | 2401.288 | 1.439 | 2401.298 | unassigned | ||||
| 67009.217 | 3d5(4P)4p | z5Do | 3.0 | 2405.894 | 0.032 | 2405.90 | unassigned | ||||
| 72307.230 | 3d5(4D)4p | y5Do | 2.0 | 2757.506 | 1.033 | 2757.51 | unassigned | ||||
| 108604.283 | 3d5(4P)4d | 5F | 4.0 | 66686.739 | 3d5(4P)4p | z5Fo | 3.0 | 2384.909 | 0.151 | 2384.912 | unassigned |
| 67009.217 | 3d5(4P)4p | z5Do | 3.0 | 2403.400 | 0.445 | 2403.409 | unassigned | ||||
| 67295.446 | 3d5(4P)4p | z5Do | 4.0 | 2420.054 | 0.025 | 2420.06 | unassigned | ||||
| 72011.050 | 3d5(4D)4p | y5Do | 4.0 | 2731.937 | 0.934 | ||||||
| 72247.730 | 3d5(4D)4p | y5Do | 3.0 | 2749.723 | 0.814 | ||||||
| 108661.385 | 3d5(4P)4d | 5F | 5.0 | 66643.296 | 3d5(4G)4p | z5Fo | 4.0 | 2379.201 | 0.631 | ||
| 67295.446 | 3d5(4P)4p | z5Do | 4.0 | 2416.713 | 0.750 | 2416.712 | unassigned | ||||
| 72011.050 | 3d5(4D)4p | y5Do | 4.0 | 2727.680 | 0.286 | ||||||
| 108907.450 | 3d5(4G)4d | 3H | 4.0 | 67910.560 | 3d5(4G)4p | z3Ho | 4.0 | 2438.470 | 0.281 | 2438.478 | unassigned |
| 70518.06 | 3d5(4G)4p | z3Go | 3.0 | 2604.108 | 0.433 | 2604.124 | unassigned | ||||
| 70546.340 | 3d5(4G)4p | z3Go | 4.0 | 2606.028 | 0.870 | ||||||
| 108906.437 | 3d5(4G)4d | 3H | 5.0 | 67846.240 | 3d5(4G)4p | z3Ho | 5.0 | 2434.710 | 0.358 | 2434.676 | DIFFERENT assign. |
| 70497.790 | 3d5(4D)4p | y5Fo | 4.0 | 2602.803 | 0.961 | ||||||
| 70527.610 | 3d5(4G)4p | z3Go | 5.0 | 2604.825 | 0.913 | ||||||
| 70546.340 | 3d5(4G)4p | z3Go | 4.0 | 2606.097 | 0.525 | ||||||
| 108896.070 | 3d5(4G)4d | 3H | 6.0 | 67744.440 | 3d5(4G)4p | z3Ho | 6.0 | 2429.300 | 0.446 | 2429.297 | DIFFERENT assign. |
| 70527.610 | 3d5(4G)4p | z3Go | 5.0 | 2605.529 | 0.621 | ||||||
| 109709.489 | 3d6(4P)4d | 3D | 1.0 | 69216.059 | 3d5(4P)4p | z3Po | 1.0 | 2468.790 | 0.388 | 2468.786 | unassigned. |
| 69319.330 | 3d5(4P)4p | z3Po | 0.0 | 2475.103 | 0.172 | 2475.095 | unassigned | ||||
| 70940.568 | 3d5(4P)4p | z3Do | 2.0 | 2578.614 | 0.996 | ||||||
| 71078.501 | 3d5(4P)4p | z3Do | 1.0 | 2587.821 | 0.480 | ||||||
| 109572.155 | 3d6(4P)4d | 3D | 2.0 | 69044.910 | 3d5(4P)4p | z3Po | 2.0 | 2466.730 | 0.480 | 2466.723 | unassigned |
| 69216.059 | 3d5(4P)4p | z3Po | 1.0 | 2477.192 | 0.178 | 2477.185 | unassigned | ||||
| 70940.568 | 3d5(4P)4p | z3Do | 2.0 | 2587.781 | 0.273 | 2587.76 | unassigned | ||||
| 109370.762 | 3d6(4P)4d | 3D | 3.0 | 68417.697 | 3d5(4P)4p | y5Po | 2.0 | 2441.080 | 0.964 | ||
| 69044.910 | 3d5(4P)4p | z3Po | 2.0 | 2479.050 | 0.413 | 2479.05 | unassigned | ||||
| 70342.936 | 3d5(4D)4p | y5Fo | 3.0 | 2561.506 | 0.847 | ||||||
| 70745.387 | 3d5(4P)4p | z3Do | 3.0 | 2588.197 | 0.067 | 2588.217 | DIFFERENT assign. | ||||
| 110664.620 | 3d5(4P)4d | 3F | 2.0 | 67766.817 | 3d5(4G)4p | z3Fo | 2.0 | 2330.407 | 0.950 | ||
| 70150.760 | 3d5(4D)4p | y5Fo | 1.0 | 2467.545 | 0.400 | 2467.546 | unassigned | ||||
| 70342.936 | 3d5(4D)4p | y5Fo | 3.0 | 2482.607 | 1.111 | 2482.604 | unassigned | ||||
| 70940.568 | 3d5(4P)4p | z3Do | 2.0 | 2516.609 | 0.584 | ||||||
| 71078.501 | 3d5(4P)4p | z3Do | 1.0 | 2525.378 | 0.238 | ||||||
| Upper level | Lower level | (Ritz) | (NIST) | Notes | |||||||
|---|---|---|---|---|---|---|---|---|---|---|---|
| Eup(cm-1) | Conf. | Term | J | Elow(cm-1) | Conf. | Term | J | Å | K14 | Å | |
| 110611.014 | 3d5(4P)4d | 3F | 3.0 | 67812.087 | 3d5(4G)4p | z3Fo | 3.0 | 2335.791 | 0.884 | ||
| 70231.468 | 3d5(4D)4p | y5Fo | 2.0 | 2475.753 | 0.248 | 2475.751 | unassigned | ||||
| 70745.387 | 3d5(4P)4p | z3Do | 3.0 | 2507.671 | 0.620 | ||||||
| 70940.568 | 3d5(4P)4p | z3Do | 2.0 | 2520.010 | 0.412 | 2520.011 | unassigned | ||||
| 110998.198 | 3d5(4P)4d | 3P | 2.0 | 69044.910 | 3d5(4P)4p | z3Po | 2.0 | 2382.877 | 0.094 | 2382.88 | DIFFERENT assign. |
| 69216.059 | 3d5(4P)4p | z3Po | 1.0 | 2392.638 | 0.666 | ||||||
| 70745.387 | 3d5(4P)4p | z3Do | 3.0 | 2483.549 | 1.102 | 2483.541 | unassigned | ||||
| 71264.390 | 3d5(4D)4p | x5Po | 1.0 | 2515.991 | 1.079 | 2515.994 | unassigned | ||||
| 73911.570 | 3d5(4P)4p | z3So | 1.0 | 2695.590 | 0.092 | 2695.59 | DIFFERENT assign. | ||||
| 111744.523 | 3d5(4D)4d | 5G | 2.0 | 70150.760 | 3d5(4D)4p | y5Fo | 1.0 | 2403.475 | 0.275 | 2403.477 | unassigned |
| 70231.468 | 3d5(4D)4p | y5Fo | 2.0 | 2408.148 | 0.357 | 2408.157 | unassigned | ||||
| 71078.501 | 3d5(4P)4p | z3Do | 1.0 | 2458.311 | 0.400 | 2458.32 | DIFFERENT assign. | ||||
| 111753.977 | 3d5(4D)4d | 5G | 3.0 | 70231.468 | 3d5(4D)4p | y5Fo | 2.0 | 2407.600 | 0.430 | 2407.608 | unassigned |
| 70342.936 | 3d5(4D)4p | y5Fo | 3.0 | 2414.081 | 0.257 | 2414.08 | unassigned | ||||
| 70745.387 | 3d5(4P)4p | z3Do | 3.0 | 2437.774 | 0.872 | ||||||
| 70940.568 | 3d5(4P)4p | z3Do | 2.0 | 2449.433 | 0.272 | 2449.438 | unassigned | ||||
| 111761.546 | 3d5(4D)4d | 5G | 4.0 | 66686.739 | 3d5(4P)4p | z5Fo | 3.0 | 2217.844 | 0.914 | ||
| 70342.936 | 3d5(4D)4p | y5Fo | 3.0 | 2413.640 | 0.540 | 2413.64 | unassigned | ||||
| 70497.790 | 3d5(4D)4p | y5Fo | 4.0 | 2422.698 | 0.191 | 2422.71 | unassigned | ||||
| 70518.06 | 3d5(4G)4p | z3Go | 3.0 | 2423.889 | 0.879 | ||||||
| 70745.387 | 3d5(4P)4p | z3Do | 3.0 | 2437.324 | 0.078 | ||||||
| 111761.008 | 3d5(4D)4d | 5G | 5.0 | 66643.296 | 3d5(4G)4p | z5Fo | 4.0 | 2215.734 | 0.735 | ||
| 70497.790 | 3d5(4D)4p | y5Fo | 4.0 | 2422.730 | 0.758 | 2422.749 | unassigned | ||||
| 70546.340 | 3d5(4G)4p | z3Go | 4.0 | 2425.584 | 0.764 | ||||||
| 70657.595 | 3d5(4D)4p | y5Fo | 5.0 | 2432.150 | 0.441 | ||||||
| 111741.583 | 3d5(4D)4d | 5G | 6.0 | 66542.539 | 3d5(4G)4p | z5Fo | 5.0 | 2211.747 | 0.649 | ||
| 70527.610 | 3d5(4G)4p | z3Go | 5.0 | 2425.625 | 0.996 | ||||||
| 70657.595 | 3d5(4D)4p | y5Fo | 5.0 | 2433.300 | 0.868 | 2433.31 | unassigned | ||||
| 111831.748 | 3d5(4D)4d | 5P | 3.0 | 66929.517 | 3d5(4P)4p | z5So | 2.0 | 2226.368 | 0.976 | ||
| 67295.446 | 3d5(4P)4p | z5Do | 4.0 | 2244.663 | 0.689 | ||||||
| 71323.600 | 3d5(4D)4p | x5Po | 2.0 | 2467.893 | 0.182 | ||||||
| 71390.488 | 3d5(4D)4p | x5Po | 3.0 | 2471.975 | 0.099 | 2471.979 | unassigned | ||||
| 72011.050 | 3d5(4D)4p | y5Do | 4.0 | 2510.501 | 0.210 | ||||||
| 72247.730 | 3d5(4D)4p | y5Po | 3.0 | 2525.531 | 0.099 | ||||||
| 72307.230 | 3d5(4D)4p | y5Do | 2.0 | 2529.315 | 0.594 | 2529.317 | unassigned | ||||
| 111991.133 | 3d5(4D)4d | 5S | 2.0 | 68284.664 | 3d5(4P)4p | y5Po | 3.0 | 2287.285 | 0.759 | ||
| 71264.390 | 3d5(4D)4p | x5Po | 1.0 | 2454.646 | 0.550 | 2454.646 | unassigned | ||||
| 71323.600 | 3d5(4D)4p | x5Po | 2.0 | 2458.220 | 0.212 | 2458.229 | unassigned | ||||
| 71390.488 | 3d5(4D)4p | x5Po | 3.0 | 2462.270 | 0.107 | 2462.276 | unassigned | ||||
| 72247.730 | 3d5(4D)4p | y5Po | 3.0 | 2515.386 | 0.662 | ||||||
| 112141.748 | 3d5(4D)4d | 5F | 2.0 | 70231.468 | 3d5(4D)4p | y5Fo | 2.0 | 2385.320 | 0.382 | ||
| 70342.936 | 3d5(4D)4p | y5Fo | 3.0 | 2391.682 | 0.712 | ||||||
| 70940.568 | 3d5(4P)4p | z3Do | 2.0 | 2426.376 | 0.925 | ||||||
| 72307.230 | 3d5(4D)4p | y5Do | 2.0 | 2509.627 | 0.166 | ||||||
| 72321.020 | 3d5(4D)4p | y5Do | 1.0 | 2510.497 | 0.051 | 2510.494 | unassigned | ||||
| Upper level | Lower level | (Ritz) | (NIST) | Notes | |||||||
|---|---|---|---|---|---|---|---|---|---|---|---|
| Eup(cm-1) | Conf. | Term | J | Elow(cm-1) | Conf. | Term | J | Å | K14 | Å | |
| 112106.537 | 3d5(4D)4d | 5F | 3.0 | 70231.468 | 3d5(4D)4p | y5Fo | 2.0 | 2387.328 | 0.921 | ||
| 70342.936 | 3d5(4D)4p | y5Fo | 3.0 | 2393.700 | 0.202 | 2393.70 | unassigned. | ||||
| 70497.790 | 3d5(4D)4p | y5Fo | 4.0 | 2402.610 | 0.596 | ||||||
| 70745.387 | 3d5(4P)4p | z3Do | 3.0 | 2416.993 | 0.679 | ||||||
| 71323.600 | 3d5(4D)4p | x5Po | 2.0 | 2451.264 | 0.746 | ||||||
| 72247.730 | 3d5(4D)4p | y5Po | 3.0 | 2508.100 | 0.171 | 2508.102 | unassigned | ||||
| 72307.230 | 3d5(4D)4p | y5Do | 2.0 | 2511.850 | 0.244 | 2511.855 | unassigned. | ||||
| 112046.403 | 3d5(4D)4d | 5F | 4.0 | 70342.936 | 3d5(4D)4p | y5Fo | 3.0 | 2397.152 | 0.995 | ||
| 70497.790 | 3d5(4D)4p | y5Fo | 4.0 | 2406.087 | 0.102 | 2406.101 | DIFFERENT assign. | ||||
| 70657.595 | 3d5(4D)4p | y5Fo | 5.0 | 2415.378 | 0.752 | ||||||
| 71390.488 | 3d5(4D)4p | x5Po | 3.0 | 2458.923 | 0.388 | 2458.935 | unassigned | ||||
| 72011.050 | 3d5(4D)4p | y5Do | 4.0 | 2497.039 | 0.336 | 2497.08 | DIFFERENT assign. | ||||
| 72247.730 | 3d5(4D)4p | y5Po | 3.0 | 2511.890 | 0.405 | 2511.905 | unassigned | ||||
| 111943.809 | 3d5(4D)4d | 5F | 5.0 | 67295.446 | 3d5(4P)4p | z5Do | 4.0 | 2239.029 | 0.788 | ||
| 70657.595 | 3d5(4D)4p | y5Fo | 5.0 | 2421.381 | 0.286 | 2421.38 | unassigned | ||||
| 72011.050 | 3d5(4D)4p | y5Do | 4.0 | 2503.455 | 0.615 | 2503.459 | unassigned | ||||
| 113199.572 | 3d5(4D)4d | 5D | 4.0 | 70657.595 | 3d5(4D)4p | y5Fo | 5.0 | 2349.900 | 0.739 | ||
| 71390.488 | 3d5(4D)4p | x5Po | 3.0 | 2391.096 | 0.502 | ||||||
| 72011.050 | 3d5(4D)4p | y5Do | 4.0 | 2427.124 | 0.005 | ||||||
| 72247.730 | 3d5(4D)4p | y5Po | 3.0 | 2441.153 | 0.207 | 2441.147 | DIFFERENT assign. | ||||
| 118544.936 | 3d5(2I)4d | 3I | 5.0 | 77842.130 | 3d5(2I)4p | z3Ko | 6.0 | 2456.090 | 0.055 | ||
| 78085.260 | 3d5(2I)4p | z3Io | 5.0 | 2470.850 | 0.621 | 2470.849 | unassigned | ||||
| 79800.610 | 3d5(2I)4p | y3Ho | 4.0 | 2580.251 | 0.111 | ||||||
| 81802.746 | 3d5(2I)4p | z1Io | 6.0 | 2720.861 | 0.935 | ||||||
| 85447.760 | 3d5(2H)4p | y3Io | 5.0 | 3020.527 | 0.969 | ||||||
| 118574.338 | 3d5(2I)4d | 3I | 6.0 | 77842.130 | 3d5(2I)4p | z3Ko | 6.0 | 2454.317 | 0.040 | ||
| 77945.750 | 3d5(2I)4p | z3Ko | 7.0 | 2460.577 | 0.005 | 2460.59 | DIFFERENT assign. | ||||
| 78340.740 | 3d5(2I)4p | z3Io | 6.0 | 2484.735 | 0.603 | 2484.735 | unassigned | ||||
| 79112.620 | 3d5(2I)4p | z1Ho | 5.0 | 2533.340 | 0.994 | ||||||
| 79739.950 | 3d5(2I)4p | y3Ho | 5.0 | 2574.266 | 0.208 | ||||||
| 85636.170 | 3d5(2H)4p | y3Io | 6.0 | 3035.108 | 0.901 | ||||||
| 118585.339 | 3d5(2I)4d | 3I | 7.0 | 77820.280 | 3d5(2I)4p | z3Ko | 8.0 | 2452.339 | 0.012 | ||
| 77945.750 | 3d5(2I)4p | z3Ko | 7.0 | 2459.910 | 0.181 | ||||||
| 78475.470 | 3d5(2I)4p | z3Io | 7.0 | 2492.400 | 0.629 | 2492.404 | DIFFERENT assign. | ||||
| 79592.420 | 3d5(2I)4p | y3Ho | 6.0 | 2563.800 | 0.316 | ||||||
| 119152.797 | 3d5(2I)4d | 1K | 7.0 | 77945.750 | 3d5(2I)4p | z3Ko | 7.0 | 2426.033 | 0.824 | ||
| 79147.220 | 3d5(2I)4p | z1Ko | 7.0 | 2498.898 | 0.581 | ||||||
| 81802.746 | 3d5(2I)4p | z1Io | 6.0 | 2676.577 | 0.700 | ||||||
| 119937.245 | 3d5(2I)4d | 1G | 4.0 | 79112.620 | 3d5(2I)4p | z1Ho | 5.0 | 2448.76 | 0.491 | 2448.766 | DIFFERENT assign. |
| 79739.950 | 3d5(2I)4p | y3Ho | 5.0 | 2486.979 | 0.437 | ||||||
| 79800.610 | 3d5(2I)4p | y3Ho | 4.0 | 2490.738 | 0.327 | ||||||
| 81220.63 | 3d5(a2D)4p | z1Fo | 3.0 | 2582.098 | 0.861 | ||||||
| (NIST) | Elow | J | Config. | Term | Eup | J | Config. | Term | Notes | |
|---|---|---|---|---|---|---|---|---|---|---|
| cm-1 | cm-1 | |||||||||
| 2409.045 | 3.275 | 55116.333 | 2 | 3d44s2 | c5D | 96613.930 | 2 | 3d4(5D4s4p(3Po) | s3Fo | obs |
| 2421.089 | 3.595 | 49291.360 | 3 | 3d6 | b1F | 90582.550 | 2 | 3d4(5D4s4p(3Po) | w5Fo | obs at 2421.10 |
| 2431.323 | 6.436 | 49465.150 | 3 | 3d5(2G)4s | c3G | 90582.550 | 2 | d4(5D4s4p(3Po) | w5Fo | obs at 2431.33 |
| 2441.226 | 5.624 | 73395.444 | 3 | 3d5(4D)4p | y3Do | 114346.060 | 3 | 3d5(6S)7d | 7D | obs |
| 2443.392 | 5.162 | 35004.790 | 3 | 3d6 | b3G | 75919.107 | 2 | 3d6(4D)4p | y3Po | obs at 2443.41 |
| 2443.809 | 4.828 | 27589.360 | 2 | 3d5(4G)4s | a5G | 68496.694 | 1 | 3d5(4P)4p | y5Po | obs blend |
| 2448.538 | 4.389 | 27589.360 | 2 | 3d5(4G)4s | a5G | 68417.697 | 2 | 3d5(4P)4p | y5Po | obs weak |
| 2458.869 | 4.327 | 29889.534 | 3 | 3d5(4P)4s | a5P | 70546.340 | 4 | 3d5(4G)4p | z3Go | obs weak |
| 2464.565 | 4.819 | 40759.620 | 0 | 3d6 | a1S | 81322.460 | 1 | 3d5(a2D)4p | x3Po | obs blend |
| 2468.395 | 4.488 | 73395.444 | 3 | 3d5(4D)4p | y3Do | 113895.350 | 2 | 3d5(6S)8s | 5S | obs at 2468.41 |
| 2477.954 | 2.323 | 66542.539 | 5 | 3d5(4G)4p | z5Fo | 106886.230 | 4 | 3d5(4D)5s | g5D | obs at 2477.96 |
| 2481.228 | 2.843 | 67812.087 | 3 | 3d5(4G)4p | z3Fo | 108102.540 | 3 | 3d5(4D)5s | e3D | obs blend |
| 2496.885 | 4.119 | 66929.517 | 2 | 3d5(4P)4p | z5So | 106967.350 | 2 | 3d5(4D)5s | g5D | obs blend |
| 2500.480 | 2.155 | 66542.539 | 5 | 3d5(4G)4p | z5Fo | 106522.810 | 6 | 3d5(4G)4d | e5I | obs |
| 2502.709 | 4.230 | 43311.324 | 1 | 3d5(4F)4s | a5F | 83255.990 | 2 | 3d4(5D)4s4p(3Po) | y7Po | obs blend |
| 2505.093 | 3.921 | 44521.540 | 4 | 3d5(2F)4s | b3F | 84428.190 | 5 | 3d5(a2G)4p | x3Ho | obs blend |
| 2518.582 | 7.851 | 79558.560 | 4 | 3d5(6S)4d | e7D | 119251.500 | 3 | 3d5(6S)8f | 5Fo | obs at 2518.56 |
| 2518.988 | 7.659 | 79569.220 | 5 | 3d5(6S)4d | e7D | 119255.760 | 4 | 3d5(6S)8f | 5Fo | obs weak |
| 2519.176 | 6.675 | 79569.220 | 5 | 3d5(6S)4d | e7D | 119252.800 | 5 | 3d5(6S)8f | 5Fo | obs at 2519.16 |
| 2523.188 | 3.091 | 38720.260 | 6 | 3d6 | a1I | 78340.740 | 6 | 3d5(2I)4p | z3Io | STRONG |
| 2532.316 | 2.138 | 66686.739 | 3 | 3d5(4G)4p | z5Fo | 106164.410 | 4 | 3d5(4G)4d | e5H | obs at 2532.341 |
| 2532.320 | 2.627 | 79800.610 | 4 | 3d5(2I)4p | y3Ho | 119278.220 | 5 | 3d5(6S)8g | 5G | obs at 2532.341 |
| 2533.461 | 3.086 | 32787.900 | 4 | 3d5(4D)4s | b5D | 72247.730 | 3 | 3d5(4D)4p | y5Do | STRONG, pred weak |
| 2555.114 | 4.599 | 29919.444 | 2 | 3d5(4P)4s | a5P | 69044.910 | 2 | 3d5(4P)4p | z3Po | obs blend |
| 2560.172 | 4.096 | 43339.452 | 2 | 3d5(2D)4s | c3D | 82387.620 | 3 | 3d5(2F)4p | y3Go | pred weak |
| 2564.447 | 3.612 | 31514.710 | 4 | 3d6 | a3F | 70497.790 | 4 | 3d5(4D)4p | y5Fo | pred weak |
| 2592.397 | 4.652 | 43537.186 | 4 | 3d5(4F)4s | a5F | 82099.990 | 4 | 3d5(2F)4p | y3Go | STRONG, pred weak |
| 2596.836 | 2.244 | 43696.217 | 3 | 3d5(4F)4s | a5F | 82193.110 | 2 | 3d5(4F)4p | y5Go | STRONG, pred weak |
| 2602.356 | 3.726 | 29869.420 | 2 | 3d6 | a3P | 68284.664 | 3 | 3d5(4P)4p | y5Po | pred weak |
| 2639.047 | 3.491 | 43339.452 | 2 | 3d5(2D)4s | c3D | 81220.630 | 3 | 3d5(a2D)4p | z1Fo | obs |
| 2639.706 | 3.992 | 37848.225 | 2 | 3d6 | a3D | 75719.955 | 1 | 3d5(4D)4p | y3Po | STRONG |
| 2666.393 | 2.659 | 72648.860 | 4 | 3d5(2G)4s | d1G | 110141.560 | 4 | 3d4(a3P)4s4p(3P)o) | r3Fo | STRONG |
| 2667.844 | 3.398 | 44521.540 | 4 | 3d5(2F)4s | b3F | 81993.850 | 4 | 3d5(4F)4p | x5Fo | STRONG, blend |
| 2669.604 | 2.382 | 44745.501 | 2 | 3d5(2F)4s | b3F | 82193.110 | 2 | 3d5(4F)4p | y5Go | STRONG, pred weak |
| 2688.221 | 0.785 | 52383.780 | 4 | 3d5(2F)4s | d3F | 89572.060 | 3 | 3d5(b2F)4p | t3Fo | STRONG, pred weak |
| 2716.039 | 3.205 | 29869.420 | 2 | 3d6 | a3P | 66676.833 | 2 | 3d5(4P)4p | z5Do | pred weak |
| 2718 382 | 3.816 | 29869.420 | 2 | 3d6 | a3P | 66645.116 | 1 | 3d5(4P)4p | z5Do | pred weak |
| 2725.555 | 1.652 | 52383.780 | 4 | 3d5(2F)4s | d3F | 89062.690 | 5 | 3d5(a2G)4p | 1Ho | pred weak |
| 2736.423 | 4.455 | 49427.371 | 4 | 3d5(2G)4s | c3G | 85960.622 | 3 | 3d5(6S)5p | x7Po | obs |
| 2739.851 | 3.969 | 49465.150 | 3 | 3d5(2G)4s | c3G | 85952.690 | 3. | 3d5(4F)4p | 3Fo | obs |
| 2760.916 | 5.129 | 30684.960 | 1 | 3d6 | a3P | 66894.130 | 1 | 3d5(4G)4p | z5Fo | obs weak |
| 2764.089 | 2.518 | 46903.320 | 2 | 3d5(2D)4s | b1D | 83070.920 | 2 | 3d5(a2F)4p | w3Do | pred weak |
| 2777.168 | 4.723 | 47073.640 | 3 | 3d5(2F)4s | a1F | 83070.920 | 2 | 3d5(a2F)4p | w3Do | STRONG |
| 2834.640 | 6.234 | 31662.040 | 3 | 3d6 | a3F | 66929.517 | 2 | 3d5(4P)4p | z5So | obs weak |
| 2842.634 | 4.902 | 31761.210 | 2 | 3d6 | a3F | 66929.517 | 2 | 3d5(4P)4p | z5So | obs weak |
| 2844.249 | 3.820 | 46903.320 | 2 | 3d5(2D)4s | b1D | 82051.650 | 3 | 3d5(4F)4p | x5Fo | pred weak |
| 2844.554 | 7.311 | 74560.181 | 3 | 3d5(6S)5s | e77S | 109704.740 | 2 | 3d4(a3P)4s4p(3Po) | y5So | obs at 2844.54 |
| 2870.804 | 2.714 | 55759.322 | 3 | 3d5(2F)4s | c1F | 90582.550 | 2 | 3d4(5D4s4p(3Po) | w5Fo | STRONG |
| 2879.924 | 2.887 | 44745.501 | 2 | 3d5(2F)4s | b3F | 79458.450 | 2 | 3d5(a2D)4p | x3Fo | obs weak |
| 2891.658 | 3.178 | 66929.517 | 2 | 3d5(4P)4p | z5So | 101501.621 | 3 | 3d5(4G)5s | e5G | obs at 2891.65 |
| 2900.889 | 3.778 | 62587.547 | 3 | 3d5(2D)4s | d3D | 97049.640 | 4 | 3d4(5D)4s4p(3Po) | s3Fo | obs |
| 2918.568 | 5.863 | 55697.014 | 4 | 3d44s2 | c5D | 89950.370 | 3 | 3d5(a2G)4p | x1Fo | obs |
| 2931.882 | 4.200 | 39813.760 | 2 | 3d5(4D)4s | b3D | 73911.570 | 1 | 3d5(4P)4p | z3So | pred weak |
| 2932.315 | 4.266 | 32836.740 | 1 | 3d5(4D)4s | b5D | 66929.517 | 2 | 3d5(4P)4p | z5So | STRONG, pred weak |