Lattice dynamics and vibrational spectra of the orthorhombic, tetragonal and cubic phases of methylammonium lead iodide
Abstract
The hybrid halide perovskite \ceCH3NH3PbI3 exhibits a complex structural behaviour, with successive transitions between orthorhombic, tetragonal and cubic polymorphs at ca. 165 K and 327 K. Herein we report first-principles lattice dynamics (phonon spectrum) for each phase of \ceCH3NH3PbI3. The equilibrium structures compare well to solutions of temperature-dependent powder neutron diffraction. By following the normal modes we calculate infrared and Raman intensities of the vibrations, and compare them to the measurement of a single crystal where the Raman laser is controlled to avoid degradation of the sample. Despite a clear separation in energy between low frequency modes associated with the inorganic \ce(PbI3^-)_n network and high-frequency modes of the organic \ceCH3NH3+ cation, significant coupling between them is found, which emphasises the interplay between molecular orientation and the corner-sharing octahedral networks in the structural transformations. Soft modes are found at the boundary of the Brillouin zone of the cubic phase, consistent with displacive instabilities and anharmonicity involving tilting of the \cePbI6 octahedra around room temperature.
pacs:
63.20.D−,63.20.Ry,78.30.-jI INTRODUCTION
Materials that adopt the perovskite crystal structure are known for their complex structural landscapes, with a large number of accessible polymorphs depending on the temperature, pressure, and/or applied electric field. For ternary \ceABX3 perovskites, the A site cation is at the centre of a cube formed of corner sharing \ceBX6 octahedra. Displacement of the A cation is usually associated with a ferroelectric (Brillouin zone centre) instability, while tilting of the \ceBX6 octahedral network is usually linked to antiferroelectric (Brillouin zone boundary) transitions.Glazer (1972); Benedek and Fennie (2013)
Hybrid organic-inorganic perovskites are formed when one of the elemental perovskite building blocks is replaced by a molecular anion or cation.Mitzi (2001); Frost et al. (2014a) There exists a large family of such compounds, including the widely studied formate perovskites, which contain both molecular anions and cations.Cairns and Goodwin (2013); Li et al. (2013); Kieslich et al. (2015) Hybrid halide perovskites are of current intense research effort, due to their high efficiency photovoltaic action.Kojima et al. (2009); Im et al. (2011); Lee et al. (2012); Liu et al. (2013); De Angelis (2014); Even et al. (2015); Walsh et al. (2015); Walsh (2015); Jeon et al. (2015)
Methylammonium lead iodide (\ceMAPbI3, where \ceMA represents the \ceCH3NH3+ cation), was first reported by Weber in 1978.Weber (1978) It is the most relevant hybrid halide perovskite for photovoltaic application. The transition from orthorhombic to tetragonal to cubic perovskite structures as a function of temperature has been studied by techniques including calorimetry and infrared spectroscopyOnoda-Yamamuro et al. (1990), single-crystal X-ray diffractionKawamura et al. (2002), and dielectric spectroscopy.Onoda-Yamamuro et al. (1992) Recently analysis of powder neutron diffraction (PND) measurements has provided more quantitative insights into the temperature dependent behaviour of the MA cation within the anionic \ce(PbI3^-)_n network.Weller et al. (2015) There is now direct evidence for the degree of order of the MA cation in the different phases, and the average lattice parameters (and thus extent of octahedral tilting) as a function of temperature through the first and second order phase transitions. Quasi-elastic neutron scattering has provided further insights into the rotational dynamics of the MA cation with a room temperature residence time of 14 ps,Leguy et al. (2015) while time-resolved vibrational spectroscopy identified fast librations (300 fs) and slow (3 ps) rotations of the molecule.Bakulin et al. (2015)
In this study, we calculate the phonon dispersion in each phase of \ceMAPbI3 within the harmonic approximation, computing the force constants with density functional theory (DFT). We use the PBEsol functional, which is a generalised-gradient-approximation (GGA) to the exchange-correlation functional, numerically evaluated with Perdew’s method, adjusted to give more accurate lattice constants and forces for solids.Perdew et al. (2008) The lattice dynamic calculations allow the atomic origin of each phonon mode to be identified. Changes in lattice polarisation and polarisability for each eigenvector provide the infrared and Raman activity of each mode. Spectral features related to the inorganic and organic components (from 0 to 3000 cm-1) are well reproduced in comparison to the Raman spectra of a single crystal of \ceMAPbI3. Overlap is found between the vibrations of the \ceCH3NH3+ and \cePbI3- components up to 130 cm-1, with the modes from 300 to 3000 cm-1 being associated with pure molecular vibrations. The phonon dispersion has implications for developing quantitative models for the generation, transport and recombination of photo-generated electrons and holes in hybrid perovskite solar cells.
I.1 Structure Models
The normal modes of a system are defined for an equilibrium configuration. Calculating the vibrations for a non-equilibrium structure will result in imaginary frequencies upon diagonalising the dynamical matrix. Therefore we have generated well optimised structures of \ceMAPbI3. One challenge in calculating the phonons of hybrid perovskites is the soft nature and complicated potential energy landscape of some of the restoring potentials, particularly those involving the organic cation.
The models for the crystal structures used in this study are discussed in detail below and a comparison with the measured diffraction patterns are provided as Supplementary Material.si
| Phase | a (Å) | b (Å) | c (Å) | (Pb–I) (Å) | Z | Cut-off (eV) | k-points | Forces (meV/Å) | H (meV) |
|---|---|---|---|---|---|---|---|---|---|
| Orthorhombic | |||||||||
| DFT/PBEsol | 9.04 | 12.66 | 8.35 | 3.18 | 4 | 700 | 5 4 5 | 0 | |
| PND (100 K) | 8.87 | 12.63 | 8.58 | 3.19 | |||||
| Tetragonal | |||||||||
| DFT/PBEsol | 8.70 | 8.72 | 12.83 | 3.19 | 4 | 800 | 5 5 3 | 2 | |
| PND (180 K) | 8.81 | 8.81 | 12.71 | 3.17 | |||||
| Cubic | |||||||||
| DFT/PBEsol | 6.29 | 6.23 | 6.37 | 3.17 | 1 | 700 | 6 6 6 | 90 | |
| PND (352 K) | 6.32 | 6.32 | 6.32 | 3.16 |
I.1.1 Orthorhombic Phase
The orthorhombic perovskite structure is the low temperature ground state of \ceMAPbI3 and maintains its stability up to ca. 165 K. Poglitsch and Weber (1987); Baikie et al. (2013); Weller et al. (2015) A comparison of the enthalpy from DFT calculations confirms this ordering in stability. The difference in enthalpy is small, just 2 meV per \ceMAPbI3 unit compared to the most stable tetragonal phase, yet 90 meV compared to the high-temperature cubic phase.
Initial diffraction pattern solutions assigned the space group.Poglitsch and Weber (1987); Onoda-Yamamuro et al. (1990) Recent analysis of higher quality powder neutron diffraction data reassigns it to (a point group).Weller et al. (2015) The structure is a supercell expansion of the simple cubic perovskite lattice, i.e. following the lattice transformation matrix
| (1) |
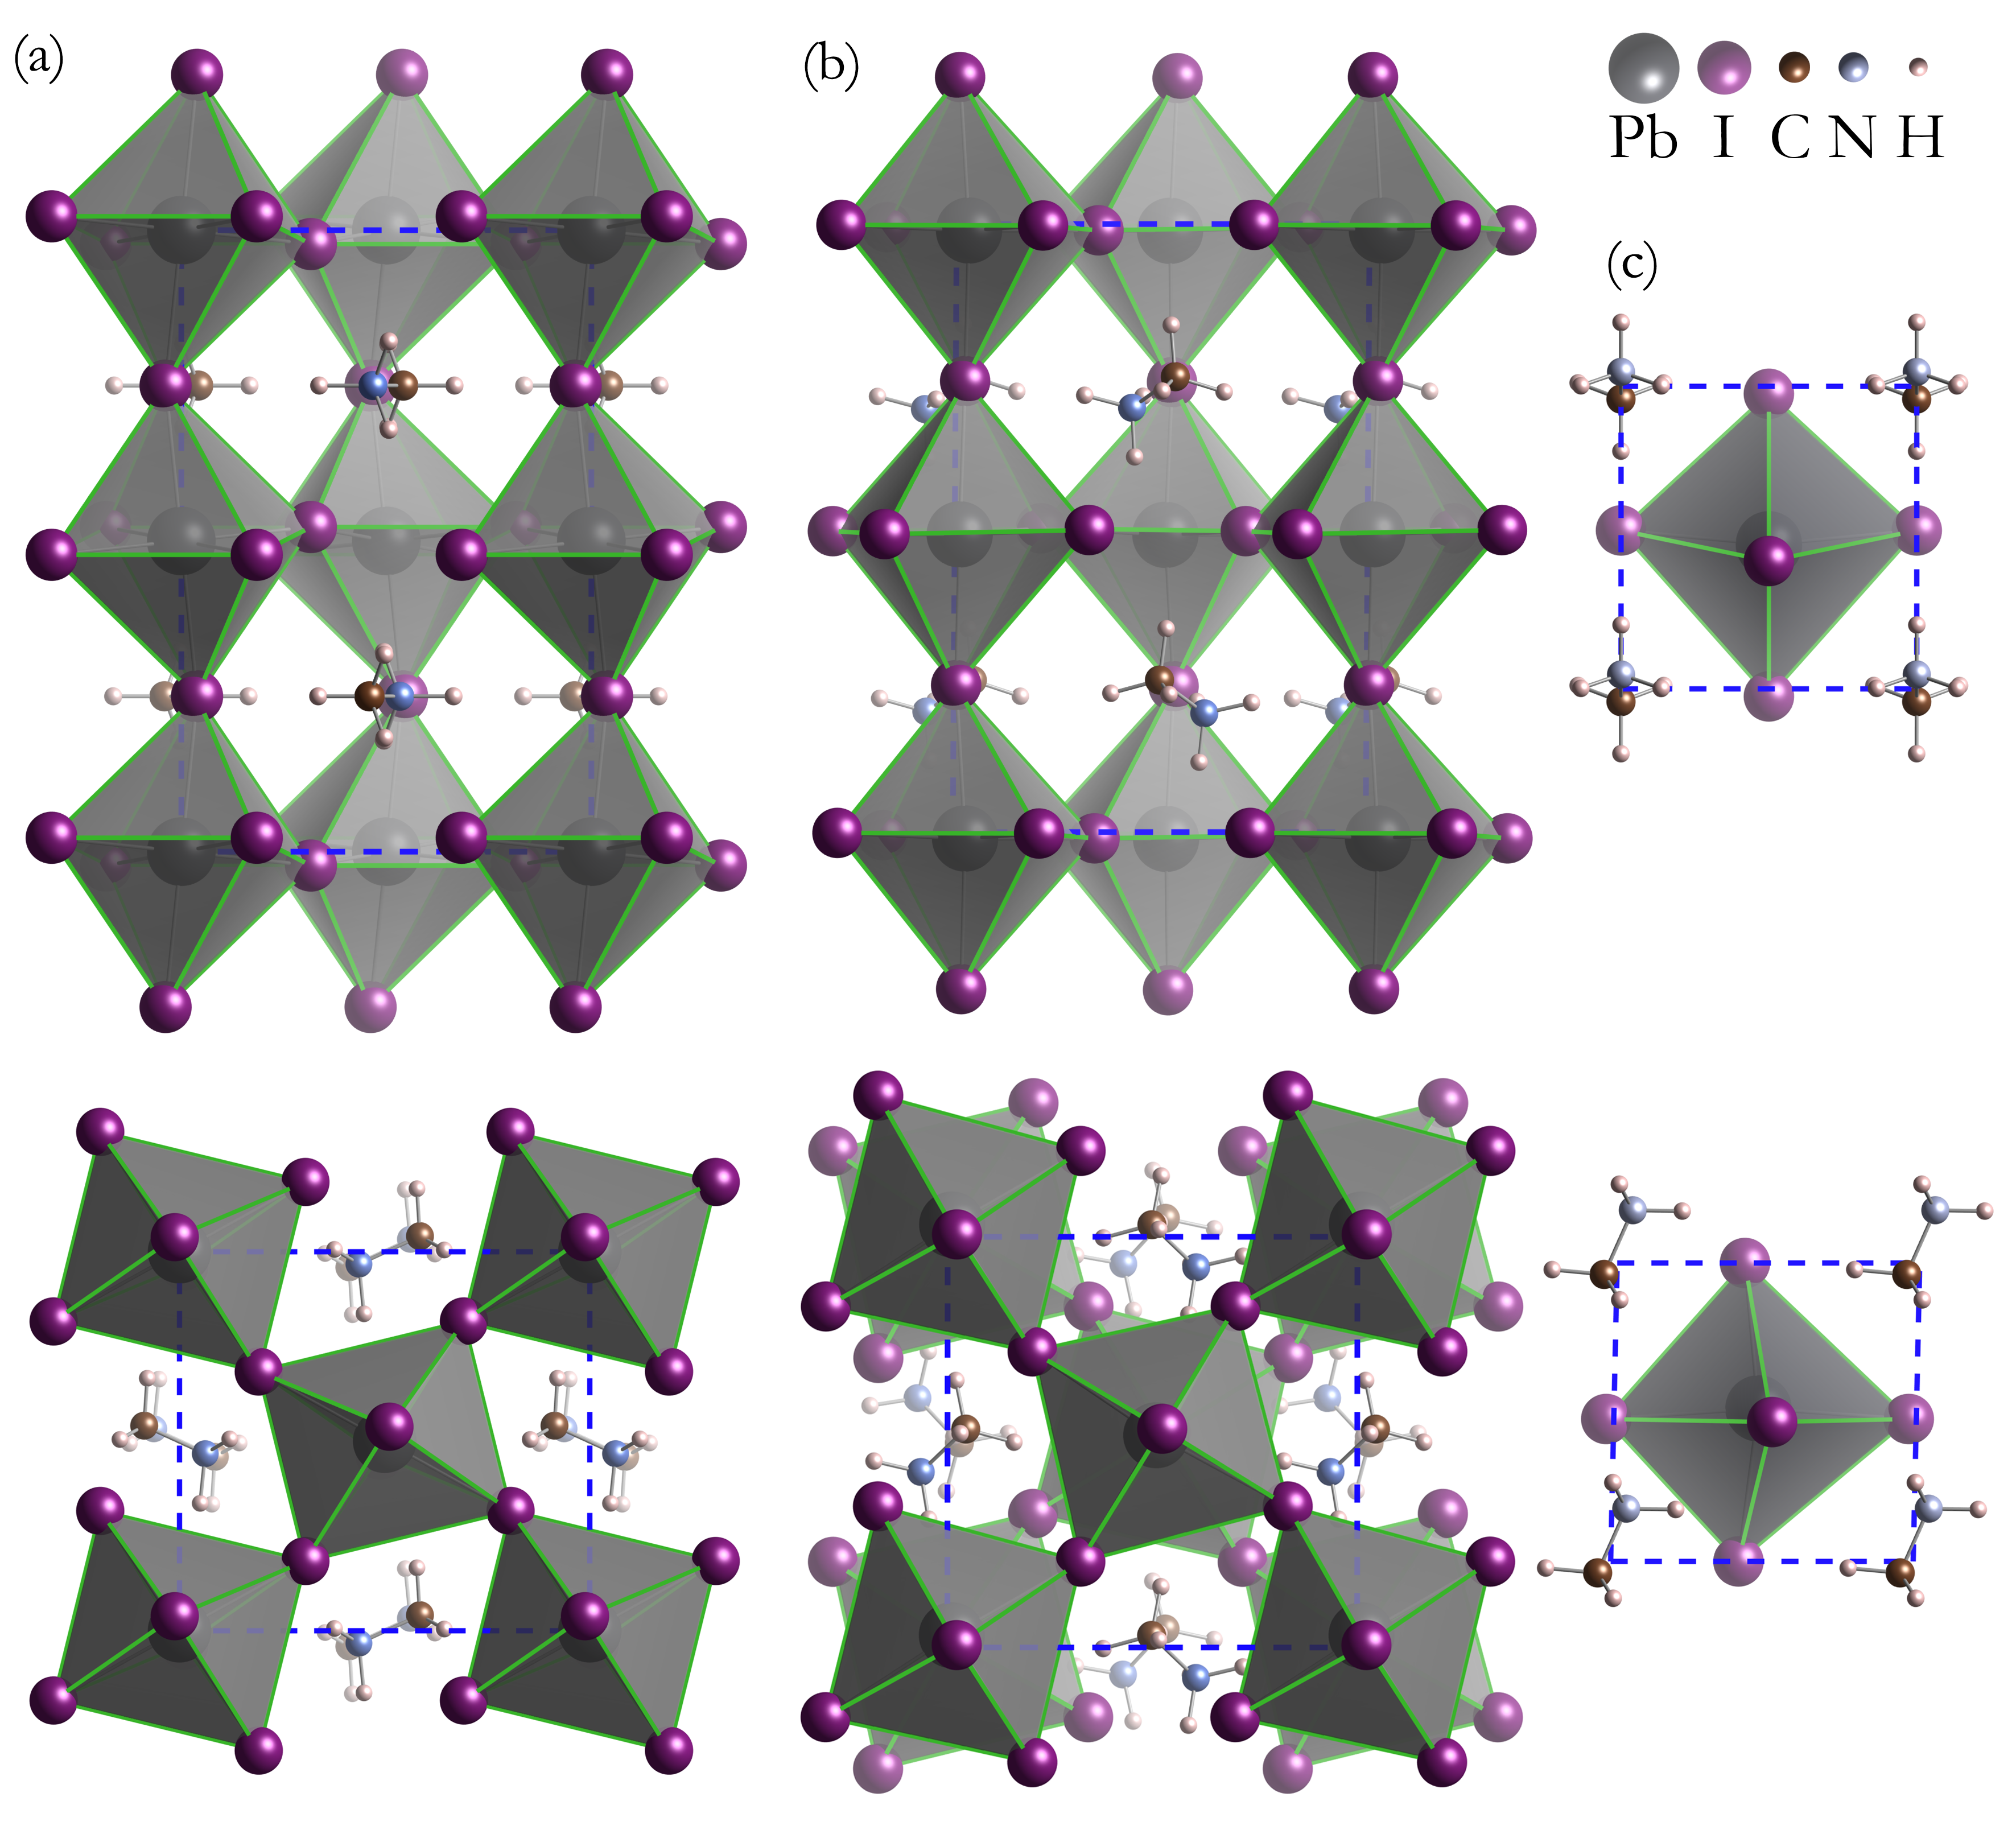
In the phase, the \cePbI6 octahedra are distorted and tilt as in Glazer notationGlazer (1972) with respect to the orientation of the conventional cubic cell. In this low-temperature phase, the four molecular cations in the unit cell are static on the diagonals of the planes pointing towards the undistorted facets of the cuboctahedral cavity. Correspondingly, molecules belonging to different planes are anti-aligned with a head-tail motif. Such an antiferroelectric alignment is expected from consideration of the molecular dipole-dipole interaction.Frost et al. (2014b)
In the low temperature orthorhombic phase the \ceCH3NH3+ sublattice is fully ordered (a low entropy state). The ordering may be sensitive to the material preparation and / or cooling rate into this phase, i.e. the degree of quasi-thermal equilibrium. It is possible that different ordering might be frozen into the low temperature phase by epitaxy or application of external force or electric fields.
I.1.2 Tetragonal Phase
At 165 K \ceMAPbI3 goes through a first-order phase transition from the orthorhombic to the tetragonal space group ( point group), which continuously undergoes a second-order phase transition to the cubic phase by ca. 327 KPoglitsch and Weber (1987); Baikie et al. (2013); Weller et al. (2015). As with the orthorhombic phase, this can be considered a expansion of the cubic perovskite unit cell.
The molecular cations are no longer in a fixed position as in the orthorhombic phase. The molecules are disordered between two non-equivalent positions in each cage.Wasylishen et al. (1985); Baikie et al. (2013). The tetragonal distortion parameter in the cubic basis is greater than unity ( at 300 K), corresponding to an elongation of the \cePbI6 octahedra along the axis. The associated octahedral tilting pattern is in Glazer notation.
Atomistic simulations within periodic boundary conditions require an ordered configuration. The solved crystal structure shows that there are several possible configurations for the organic cations within the tetragonal unit cell. These configurations have similar enthalpies within DFT,Fan et al. (2015) which is consistent with the observed disorder. We choose to use the most energetically stable structure, which is also consistent with a previous DFT investigation.Quarti et al. (2014a)
In the model of the tetragonal structure, the MA cations are aligned as in the orthorhombic phase, towards the face of the perovskite cage, i.e. in the cubic basis. The MA in different (001) planes are approximately orthogonal to one other. The orientional dynamics of the methylammonium ions, which exists above 165 K, is not taken into account in this equilibrium configuration study.
I.1.3 Cubic Phase
With increasing temperature the tetragonal lattice parameters become more isotropic (i.e. moves closer to 1), and the molecular disorder increases, to the point where a transition to a cubic phase occurs around 327 K. The transition can be seen clearly from changes in the heat capacity,Onoda-Yamamuro et al. (1990) as well as in temperature dependent neutron diffractionWeller et al. (2015).
The cubic space group ( symmetry) has been assigned to this high-temperature phase. Although the methylammonium ions posses symmetry, the orientational disorder gives rise to the effective higher symmetry on average. The local structure will necessarily have a lower symmetry. Indeed, for the bromide and chloride analogues of \ceMAPbI3, pair-distribution function analysis of X-ray scattering data indicates a local structure with significant distortion of the lead halide framework at room temperature.Worhatch et al. (2008)
We previously considered alignment of the molecules along the principal (face), (edge), and (diagonal) directions of the cubic unit cell, and showed that they are of similar DFT enthalpy, with a small barrier for rotation.Brivio et al. (2013) Further ab-initio molecular dynamics showed an average preference for the facial configuration at 300 K.Frost et al. (2014b) Therefore we chose the configuration as our reference structure for the lattice vibrations.
Representations of the crystal structure of each phase are shown in Figure 1, the equilibrium structure parameters are listed in Table 1, and the structures themselves are available in an on-line repository.str
II METHODS
II.1 Computational
The total energy and atomic forces were computed from first-principles within density functional theory as implemented in the code VASP.Kresse and Furthmüller (1996); Kresse and Joubert (1999) Noise in the lattice vibrations was minimised by rigorous convergence of total Kohn-Sham energy with respect to the basis set (kinetic energy cut-off for plane waves) and sampling of reciprocal space (density of the k-point mesh). The final computational set-up is summarised in Table 1.
We performed complete optimisation of the cell volume, shape and atomic positions, with the PBEsolPerdew et al. (2008) semi-local exchange-correlation functional. The scalar-relativistic projector-augmented wave methodBlöchl (1994) was employed, with a pseudo-potential treating the Pb 5d orbitals as valence. Spin-orbit coupling was not considered as it mainly affects the Pb 6p conduction band, which does not influence the interatomic interactions at equilibrium. All atomic forces were reduced to below a threshold of 1 meV/Å. Due to the presence of the organic cations, which breaks the ideal lattice symmetry, deviations in the expected parameters can occur, e.g. in the high temperature pseudo-cubic phase, the three equilibrium lattice parameters are not equal. The equilibrium structure parameters (at 0 K and excluding zero-point contributions) are reported in Table 1.
The normal modes are calculated within the harmonic approximation, using the PhonopyTogo et al. (2010); Skelton et al. (2014); Togo et al. (2015) package to construct and evaluate the dynamical matrix composed of DFT force constants. Both the finite displacement method (FDM or supercell approach)Stoffel et al. (2010) and density functional perturbation theory (DFPT)Baroni and Gironcoli (2001) approaches to construct the force constants were tested. The results of both approaches produced similar vibrational spectra, with a variance in the mode energies of 6 cm-1.
Within a primitive cell of N atoms there are 6N possible displacements (), which can be reduced by the crystal symmetry. For the orthorhomic phase, the 288 possible displacements are reduced to 41, while the tetragonal and cubic phases required 288 and 72 displacements, respectively. The phonon dispersion (for q-points away from the Brillouin zone centre, the point) in the cubic phase was probed in a supercell. Due to computational expense, we do not calculate this for the other (larger unit cell) phases. For the phonon density of states, Brillouin-zone integrations were performed with (orthorhombic and tetragonal) and (cubic) -centered Monkhorst-Pack q-meshes.
Once the normal eigenmodes and eigenvalues are calculated, it is possible to model their associated Raman and infrared (IR) activity by mode following. The two spectroscopic techniques probe different physical responses of the material: the change in polarisation for IR and the change in polarisability for Raman. The IR spectra are simulated with the analytic formula of Gianozzi & Baroni (using the Born effective charge tensor)Baroni and Gironcoli (2001). Prediction of the Raman spectra required computing the change in macroscopic dielectric tensor with respect to each normal mode of the system, a significant DFT calculation in terms of computational expense.Skelton et al. (2015a)
II.2 Experimental
Methylammonium lead iodide single crystals were grown according to the method of Poglitsch and Weber.Poglitsch and Weber (1987) 12.5 g of lead acetate trihydrate (\cePb(CH3CO2)2.3H2O, Sigma) was dissolved in 10 mL hydroiodic acid (HIaq, 57 wt%, Sigma) in a 50 mL round bottom flask and heated to 100∘C in an oil bath. Separately, 0.597 g of \ceCH3NH2 (aq, 40 wt%, Sigma) was added dropwise to a further 2 mL of HIaq kept at 0∘C in an ice bath under stirring. The methylammonium iodide solution was then added to the lead acetate solution and the mixture was cooled over five days to a temperature of 46∘C, resulting in the formation of black crystals with largest face length around 8 mm. The content of the flasks was subsequently filtered and dried for 12 hours at 100∘C.
Raman spectra were collected in backscattering geometry with a high resolution LabRam HR800 spectrometer using a grating with 600 lines per millimetre and equipped with a liquid-nitrogen-cooled charge coupled device (CCD) detector. The 785 nm line of a diode-pumped solid state laser was used as excitation beam and focused onto the sample using a long distance 20 microscope objective. Raman measurements were carried out at 100 K using a gas-flow-type cryostat with optical access that fits under the microscope of the Raman setup. The high spectral resolution and stray-light rejection of the LabRam spectrometer, particularly in combination with the 785 nm line, allowed us to measure the Raman spectrum of MAPI at very low Raman shifts down to 20 to 30 cm-1. This way and for the first time, we were able to spectrally resolve several low-frequency modes associated to vibrations of the inorganic cage of the hybrid perovskite.
Heating by laser light directly absorbed by \ceCH3NH3PbI3 has been shown to lead to rapid degradation of the material resulting in \cePbI2 Raman signatures.(Ledinský et al., 2015) Since 785 nm light is only weakly absorbed the heating effect of the laser was low enough to ensure the crystal structure was preserved. The power density incident on the sample was kept at 80 W/cm2. At such power level, it was checked that no appreciable spectral changes in peak width and/or position occurred, yet maintaining a good signal-to-noise ratio. Further, samples were kept under vacuum inside the cryostat during the measurements.
III RESULTS
III.1 Harmonic Phonons
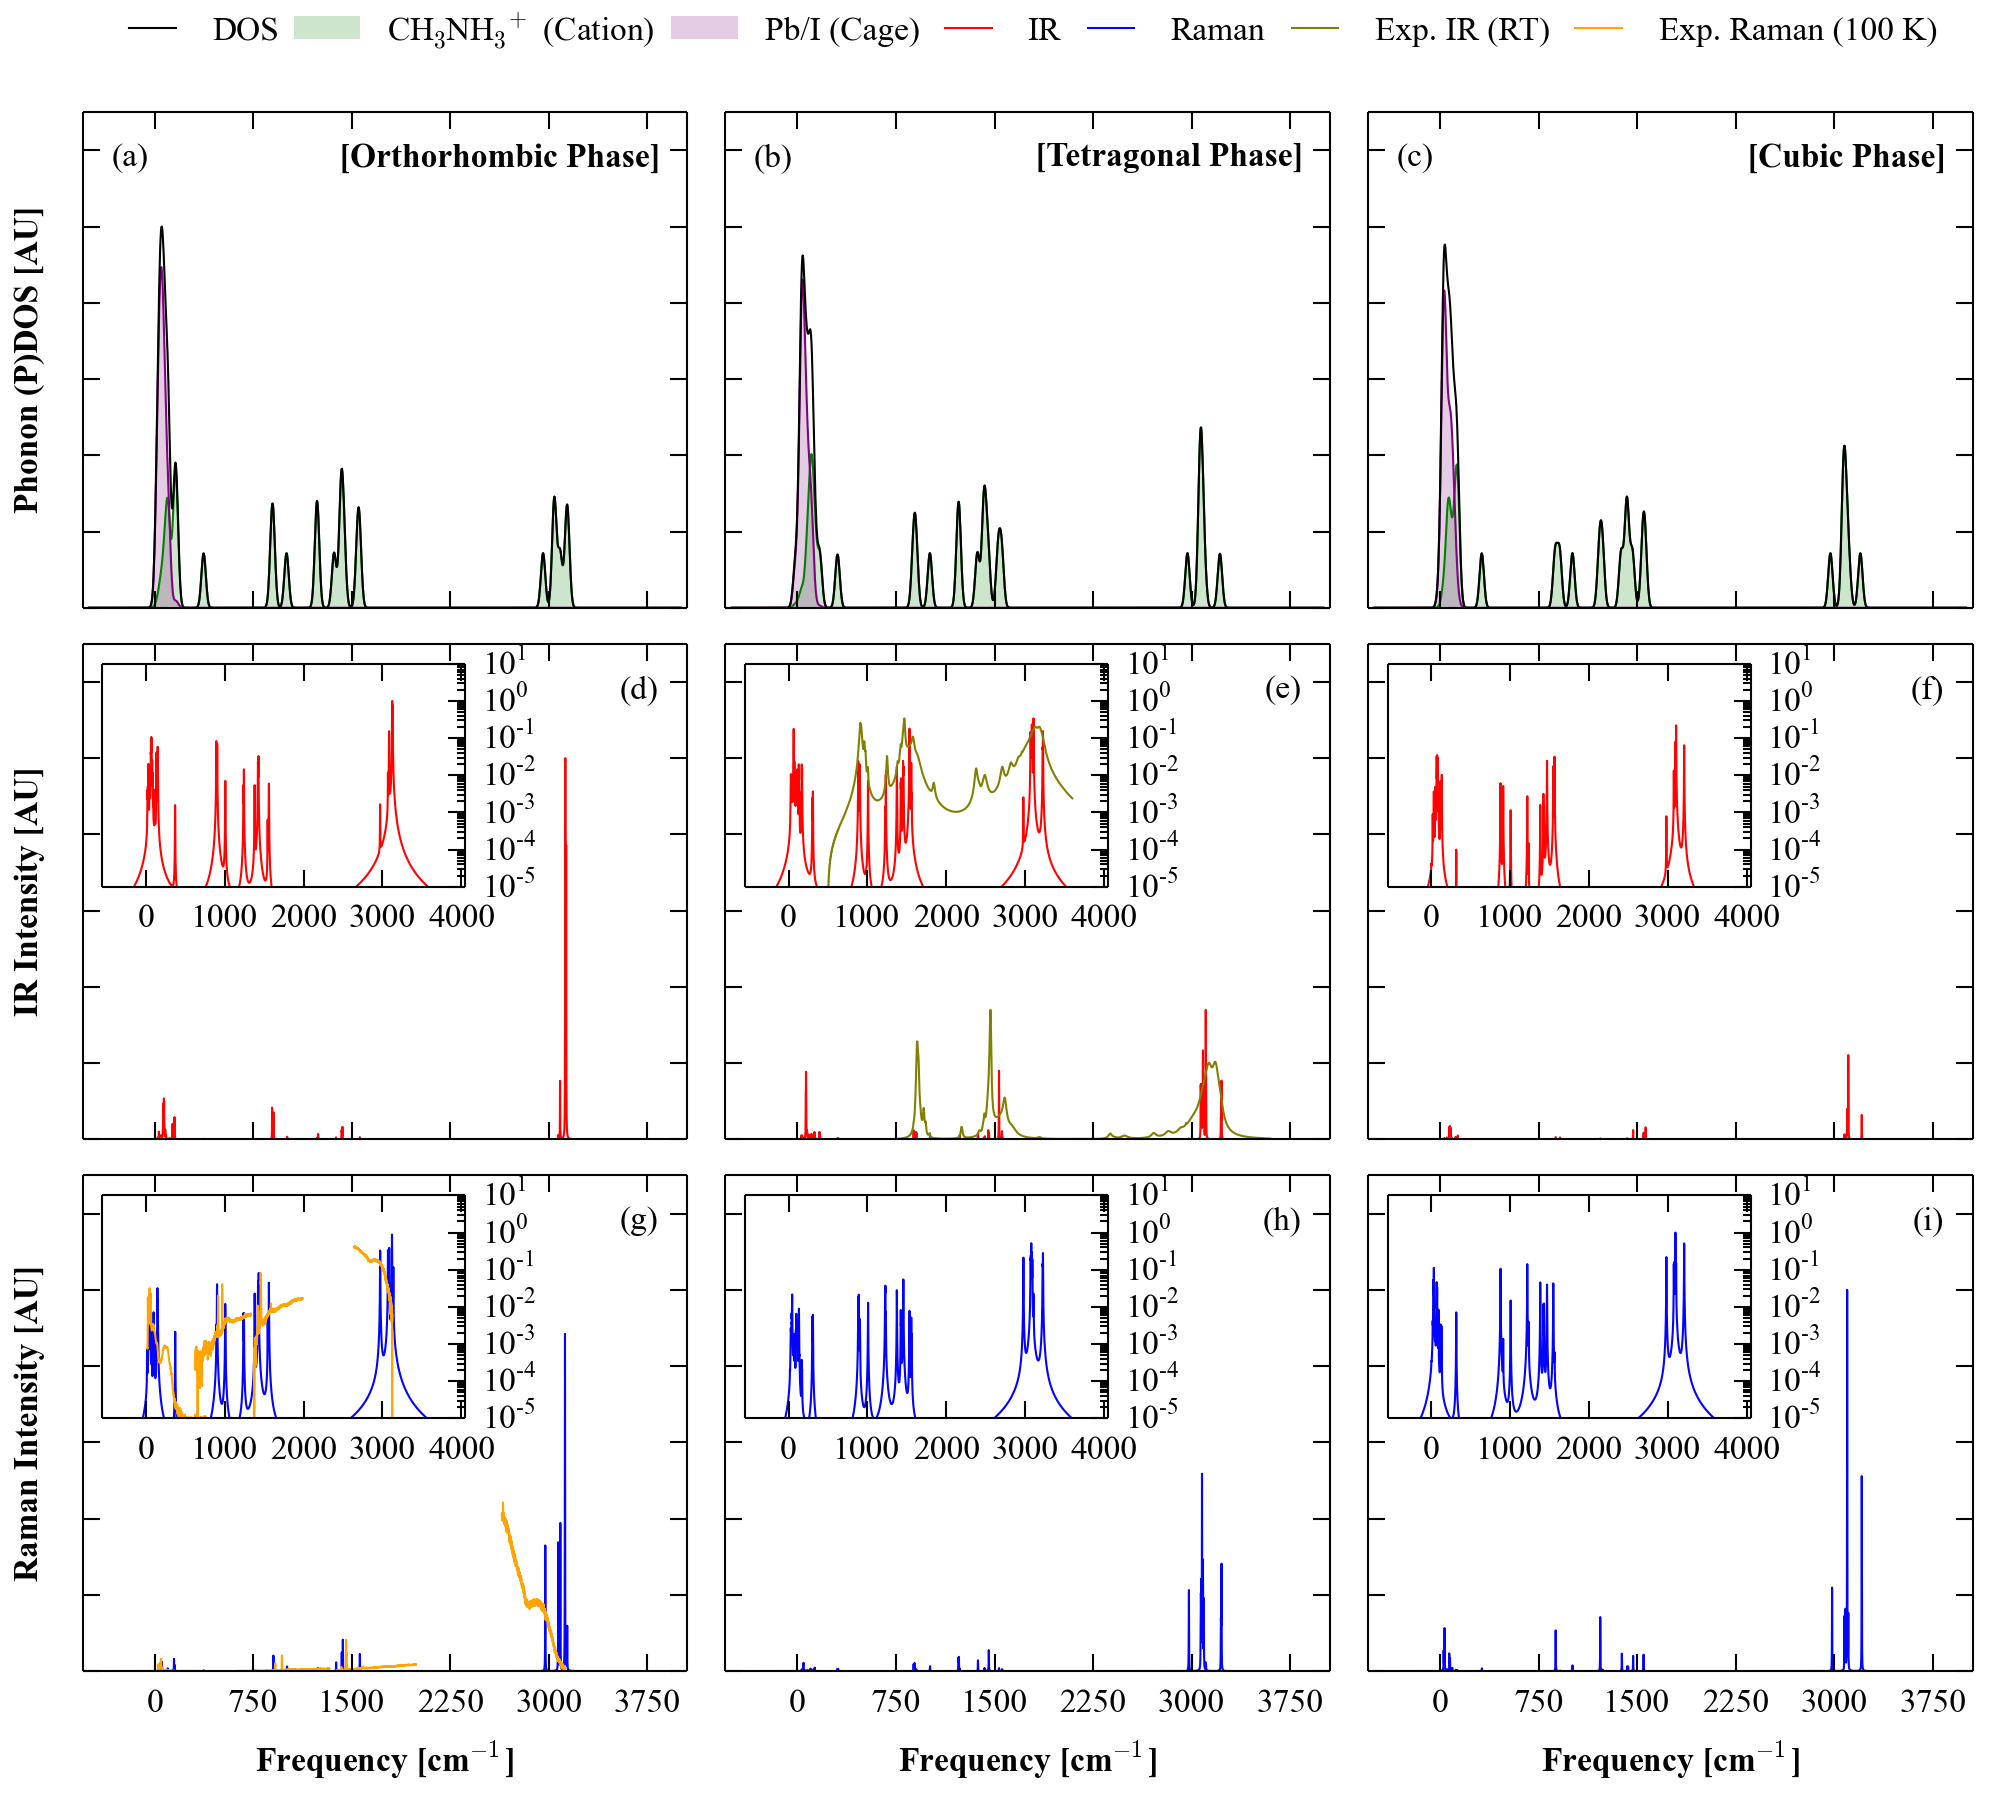
The full phonon density of states (DOS) is shown for the three phases of \ceCH3NH3PbI3 in Figure 2. Also plotted is the partial DOS, where assignment to \ceCH3NH3+ or \cePbI3- is performed based on the atomic contribution to each eigenvector. An animation of all 36 eigenmodes of the cubic phase is provided as Supplementary Materialsi .
Qualitatively, each \ceMAPbI3 phase shows similar vibrational properties with three energetic regions of phonons: (i) a low-frequency band from 0–150 cm-1; (ii) a mid-frequency band from 280–1600 cm-1; (iii) a high-frequency band from 2900–3300 cm-1. These ranges are consistent with previous computational reports.Quarti et al. (2014b); Ahmed et al. (2014)
Due to the large difference in atomic mass of the organic and inorganic components, and to the difference in bonding between the inorganic cage and the covalently bonded molecule, we anticipated that the low frequency modes would comprise entirely of motion by the \cePbI6 octahedra, while the high frequency modes will involve the \ceCH3NH3+ cation. This is qualitatively the case, but there is also significant coupling between the two. Taking the example of the cubic phase with 36 modes: the highest-energy 18 modes (forming bands ii and iii) correspond to molecular vibrations, i.e. the 3N-6 modes of the methylammonium ion. For an isolated non-linear molecule, the 6 translational and rotational degrees of freedom do not contribute to the pure vibrational spectrum, but this is not the case for a molecule inside a cuboctahedral cavity.
The 6 additional molecular modes are strongly coupled to the 9 modes (i.e. 3-3 for \cePbI3-) associated with stretching of the Pb–I bonds and breathing of the \cePbI6 octahedra, which results in the spectral overlap observed in the partial DOS of band i. Particularly striking is the low-frequency pivoting motion associated with the libration of the molecular dipole, coupled with a breathing of the octahedral framework (e.g. modes 10 and 15 in the SI). The final three zero-frequency modes correspond to acoustic translations of the lattice.
III.2 Vibrational Spectra
For \ceMAPbI3 it is not possible for the relaxed (non-idealised) crystal structures to assign the spectral activity directly with group theoretic irreducible representation analysis of the phonon modes. The molecule breaks the average crystal symmetry. This symmetry lowering allows for simultaneous Raman and IR activity even in the pseudo-cubic phase. The predicted spectra (the point phonon modes weighted by the computed spectral intensity, convolved with a Lorentizian for experimental comparison) are reported in Figure 2 for each phase.
Raman and IR activity is observed across each of the three phonon bands previously discussed. A notable exception is the lowest-energy purely molecular vibration near 300 cm-1, which is neither Raman nor IR active.
To understand the effect of embedding the methylammonium in \ceMAPbI3, we calculate the normal mode vibrations of an isolated methylammonium ion in vacuum with a similar density functional theory method to our periodic calculations (PBE with an atom centered augmented cc-pVQZ basis set). Thereby we calculate the 18 molecular modes, directly accessing their symmetries and nature. The C3v symmetry of the molecule separates the vibrational bands into one symmetric mode and blue-shifted two-fold degenerate asymmetric modes. The six bands we find are in ascending energy: twist around the C–N axis (282, 886 cm-1); vibration along the C–N axis (923, 1239 cm-1); bending of the C–H bonds (1418, 1451 cm-1); bending of the N–H bonds (1478, 1622 cm-1); stretching of the C–H bonds (3018, 3119 cm-1); stretching of the N–H bonds (3321, 3395 cm-1).
As the cation charge density is centred towards the N, the motion of the protons associated with N have the strongest affect on the dipole moment and therefore strongest IR activity. Due to the stronger bonds, their frequencies are consistently blue shifted relative to the C end. Owing to the molecular dipole moment (2.2 D,Frost et al. (2014b) which is rotation and position invariant, and corresponds to a polarisation contribution of 3 C/cm2), the two high-frequency asymmetric stretching modes of \ceNH3+ (band iii) results in the strongest absolute IR intensity. The hydrogen stretching modes (band iii) are responsible for significant Raman activity. The only mode involving C or N motion is the weakly IR and Raman active vibration at 923 cm-1(vacuum), 1007 cm-1(cubic perovskite).
The rotation of the \ceCH3 against the \ceNH3 unit, while being strongly populated in molecular dynamic simulations, and which forms the main source of quasi-inelastic neutron scattering, is entirely IR and Raman inactive in vacuum. This is the mode responsible for the 282 cm-1(vacuum), 318 cm-1(cubic) , 300–310 cm-1(tetragonal), 370–372 cm-1(orthorhombic) vibration. Progressive confinement of MA from vacuum to the orthorhombic phase blue-shifts the energy of the vibration.
In the solid state, the degeneracies in the molecular modes are typically split by local environment effects, peaks are both redshifted and blue-shifted, and the IR and Raman activity varies. As such, it is evident that analysis of the Raman and IR spectra in the experimentally easily accessible molecular frequency range can enable statements to be made about the local structure and configuration of the hybrid perovskite. Our data is collected for a particular representation of the cubic and tetragonal phase; in reality the location of the MA in these phases will be disordered. As such, detailed comparison of theory to experiment will require sampling the thermodynamic ensemble of structures.
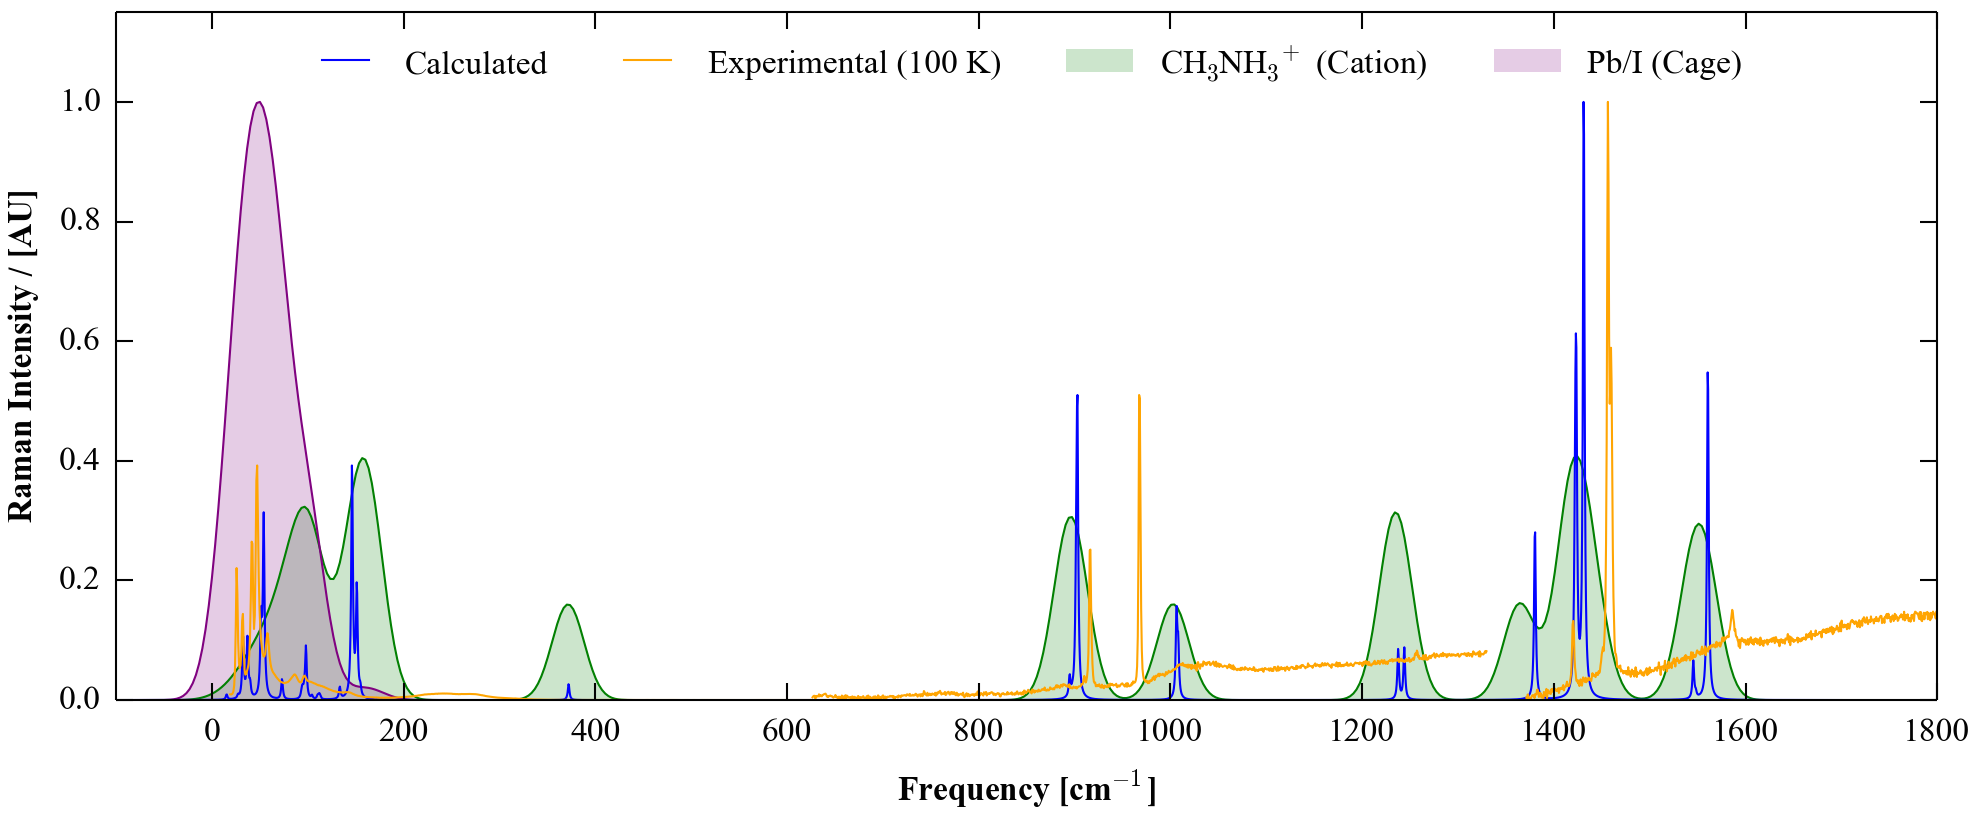
To our knowledge, no Raman spectra for the three phases have previously been reported across the full frequency range. The spectrum up to 450 cm-1 was reported in Ref. Quarti et al., 2014b. Reliable measurements are a challenge due to chemical instability of the material. \ceMAPbI3 is strongly affected by environmental conditions, such as the presence of ambient moisture(Baikie et al., 2013; Noh et al., 2013). Isolated in vacuum the material can still decompose and bleach due to heating, including by that imposed by the (typically high) Raman laser fluence.(Ledinský et al., 2015) Such degradation leads to the formation of \cePbI2, which overlaps in Raman spectra with \ceMAPbI3, and so easily leads to misinterpretation.
The Raman spectra of a high-quality single crystal of \ceMAPbI3 is shown in Figure 2, and compared in detail with the calculations in Figure 3. Across the full spectral range, the agreement between the predicted and measured spectra is good, with the response across bands i, ii and iii well reproduced. On closer inspection in Figure 3, there are noticeable shifts in peak positions, which can be attributed to three potential sources of error: (a) the harmonic approximation (anharmonic renormalisation may be large); (b) the limits of the exchange-correlation treatment (non-local interactions may be important); (c) the assumption of a fully-ordered structure (local inhomogenity may be prevalent). There is also a notable case of a missing peak around 150 cm-1, which we can tentatively attribute to a lifetime broadening effect. The same level of theory applied to the lead based semiconductors PbS and PbTe results in quantitative agreement with measured phonon frequencies and dispersion,Skelton et al. (2015b) which highlights the complex nature of \ceCH3NH3PbI3.
We have also included in Figure 2 a room temperature IR spectrum reported by Glaser et al.Glaser et al. (2015), which again shows excellent agreement across the spectrum. A number of very weak absorption peaks below 3000 cm-1 are evident, which could be related to molecular disorder and/or partial decomposition. The temperature resolved (between 140 and 299 K) IR spectra for tetragonal and orthorhombic phases have been previously reported by Yamamuro(Onoda-yamamuro, 1992). We reproduce the position and the intensity of the peak observed at 900 cm-1, reliably assigning it to the (also Raman active) C–N bond stretch. High quality IR measurements, in particular looking at the very low energy transitions, would provide considerable information on the nature of the domains and local structure in a \ceMAPbI3 film.
III.3 Anharmonic Effects
The lattice dynamic simulations discussed above were performed within the harmonic approximation. All eigenmodes at the centre of the Brillouin zone were real (positive frequencies) for each phase, i.e. the structures are locally stable.
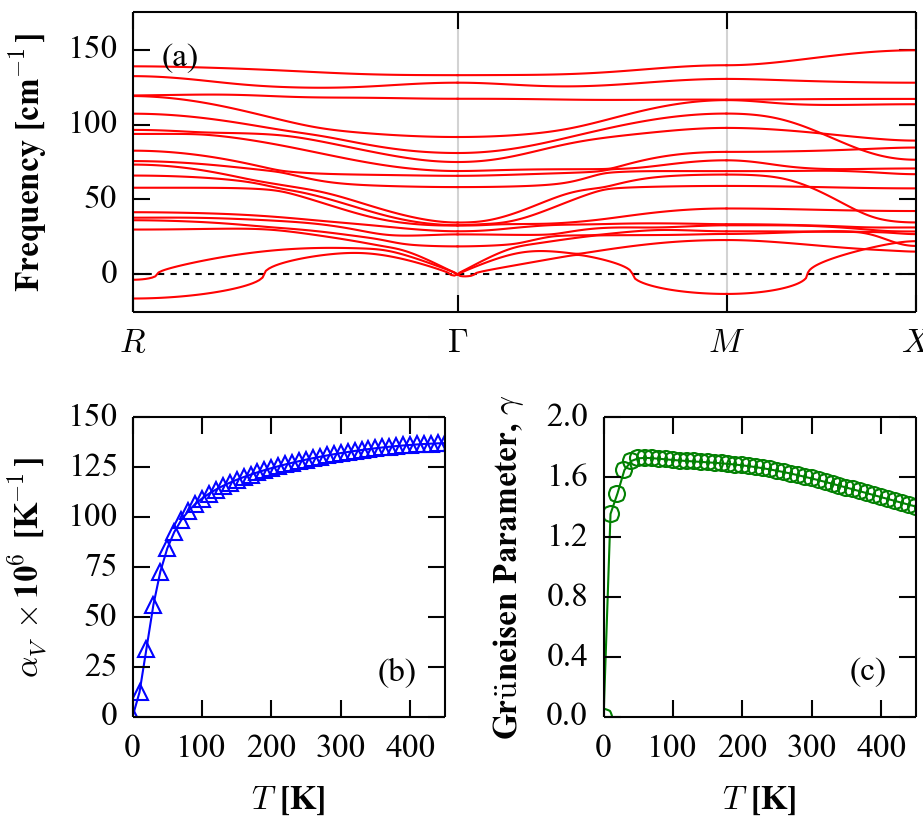
The phonon dispersion across the first Brillouin zone is shown for the cubic perovskite structure in Figure 4. Here imaginary (negative frequency or ‘soft’) modes are found at the zone boundaries. Such instabilities are a common feature of the perovskite structure, and represent antiferroelectric distortions linked to to rotations and tiling of the octahedra in neighbouring unit cells.Benedek and Fennie (2013) The soft modes are centred around the R and M points, which correspond to the and directions in the cubic lattice. This behaviour is similar to the inorganic perovskite \ceCsPbCl3, where neutron scattering was used to probe condensation of these modes, which leads to successive transitions from the cubic to tetragonal to orthorhombic phases.Fujii et al. (1974) The effect of these modes in \ceMAPbI3, and the associated high levels of anharmonicity at room temperature can be observed directly in molecular dynamics simulations, where temporal rotations of the \ceCH3NH3+ ions and distortions of the \cePbI6 octahedra have been found in several studies.Leguy et al. (2015); Frost et al. (2014b); Quarti et al. (2015)
An approach to including the effects of temperature (thermal expansion) and first-order anharmonicity in lattice dynamic calculations is the quasi-harmonic approximation (QHA).Dove (1997); Buckeridge et al. (2013) The computational cost is one order of magnitude higher than the harmonic approximation and thus was considered for the cubic phase only. The volumetric thermal expansion coefficient extracted from the PND data at 300 K is K, which compares very well to the value of K computed within the QHA. The predicted thermal expansion for \ceMAPbI3 is similar to inorganic semiconductors (e.g. for PbTe the value is K at 300 KSkelton et al. (2014)) and positive over the full temperature range.
The temperature dependence of the phonon modes can be described by the Grüneisen parameter, which has an average of around 1.6 (see Figure 4), slightly below the value of 1.7 found in \cePbI2(Sears et al., 1979). The imaginary modes at R and M remain at all temperatures, consistent with the cubic lattice being a dynamic average of a locally distorted structure; the same phenomenon is observed in \ceCsSnI3.Silva et al. (2015) The high level of anharmonicity associated with the soft titling modes is consistent with the ‘ultra low’ ( 1 Wm-1K-1 at 300 K) lattice thermal conductivity reported for single crystals and polycrystalline \ceMAPbI3.Pisoni et al. (2014) Hybrid halide perovskites are thus also promising for application in thermoelectric devices if thermal stability issues can be overcome.He and Galli (2014)
IV CONCLUSIONS
The vibrational frequencies of three crystallographic phases of the hybrid perovskite \ceCH3NH3PbI3 have been investigated. We identified three main phonon branches present in the three phases. Two high-frequency branches are associated with the vibration and bond stretching of the molecular cation with frequencies in the range 300 cm-1 to 3300 cm-1. The lowest energy branch, below 150 cm-1, arises predominately from the inorganic cage, but with half the modes coupled to the motion of the molecule. The simulated Raman spectrum is in good agreement with measurements on a single crystal of \ceMAPbI3. Dynamic instabilities occur at the zone boundaries, which requires methods beyond the harmonic approximation, such as self-consistent phonon theory, for an accurate treatment. These results suggest that the room temperature structure of \ceMAPbI3 is fluctional, owing to the persistent titling and distortion of the octahedral networks and rotations of the molecular cations.
These factors may be important for developing a quantitative understanding and model of how hybrid perovskite solar cells operate. Upon excitation, the relative stability of free carriers and excitons depends intimately on the dielectric screening of the material, which includes vibrational and rotational components. The transport and recombination of photo-generated charge carriers will also be influenced by electron-phonon coupling, which can significantly reduce the effective size and distribution of electrons and holes within the perovskite layer.
V Web Enhanced
An animation of the 36 -point phonon modes of the cubic phase of \ceMAPbI3 in gif format is available at http://people.bath.ac.uk/aw558/temp/mapi_phonon.gif.
Acknowledgements.
The authors are grateful for helpful discussions with Mariano Campoy-Quiles. The research at Bath has been supported by the EPSRC (Grant No. EP/K016288/1 and EP/M009580/1), the ERC (Grant No. 277757), EU-FP7 (Grant No. 316494), and the Royal Society. AJJ and OJW were funded through the CDT in Sustainable Chemical Technologies (EPSRC Grant No. EP/ G03768X/1). PRFB and AMAL are grateful to the EPSRC (Grant Nos. EP/J002305/1, EP/M014797/1, and EP/M023532/1). ARG acknowledges the Spanish Ministerio de Economía y Competitividad (MINECO) through project number MAT2012-37776 and CSD2010-00044 (Consolider NANOTHERM). This work benefited from access to both the University of Bath’s High Performance Computing Facility and ARCHER, the UK’s national high-performance computing service, which is funded by the Office of Science and Technology through EPSRC’s High End Computing Programme (Grant No. EP/L000202).References
- Glazer (1972) A. M. Glazer, Acta Crystallogr. Sect. B 28, 3384 (1972).
- Benedek and Fennie (2013) N. A. Benedek and C. J. Fennie, J. Phys. Chem. C 117, 13339 (2013).
- Mitzi (2001) D. B. Mitzi, J. Chem. Soc. Dalt. Trans. 2001, 1 (2001).
- Frost et al. (2014a) J. M. Frost, K. T. Butler, F. Brivio, C. H. Hendon, M. Van Schilfgaarde, and A. Walsh, Nano Lett. 14, 2584 (2014a), arXiv:1402.4980 .
- Cairns and Goodwin (2013) A. B. Cairns and A. L. Goodwin, Chem. Soc. Rev. 42, 4881 (2013).
- Li et al. (2013) W. Li, Z. Zhang, E. G. Bithell, A. S. Batsanov, P. T. Barton, P. J. Saines, P. Jain, C. J. Howard, M. A. Carpenter, and A. K. Cheetham, Acta Mater. 61, 4928 (2013).
- Kieslich et al. (2015) G. Kieslich, S. Kumagai, K. T. Butler, T. Okamura, C. H. Hendon, S. Sun, M. Yamashita, A. Walsh, and A. K. Cheetham, Chem. Commun. , Advance Article (2015).
- Kojima et al. (2009) A. Kojima, K. Teshima, Y. Shirai, and T. Miyasaka, J. Am. Chem. Soc. 131, 6050 (2009).
- Im et al. (2011) J.-H. Im, C.-R. Lee, J.-W. Lee, S.-W. Park, and N.-G. Park, Nanoscale 3, 4088 (2011).
- Lee et al. (2012) M. M. Lee, J. Teuscher, T. Miyasaka, T. N. Murakami, and H. J. Snaith, Science (80-. ). 338, 643 (2012).
- Liu et al. (2013) M. Liu, M. B. Johnston, and H. J. Snaith, Nature 501, 395 (2013).
- De Angelis (2014) F. De Angelis, Acc. Chem. Res. 47, 3349 (2014).
- Even et al. (2015) J. Even, L. Pedesseau, C. Katan, M. Kepenekian, J.-S. Lauret, D. Sapori, and E. Deleporte, J. Phys. Chem. C 119, 10161 (2015).
- Walsh et al. (2015) A. Walsh, D. O. Scanlon, S. Chen, X. G. Gong, and S.-H. Wei, Angew. Chemie Int. Ed. 54, 1791 (2015), arXiv:1411.7606 .
- Walsh (2015) A. Walsh, J. Phys. Chem. C 119, 5755 (2015).
- Jeon et al. (2015) N. J. Jeon, J. H. Noh, W. S. Yang, Y. C. Kim, S. Ryu, J. Seo, and S. I. Seok, Nature 517, 476 (2015).
- Weber (1978) D. Weber, Zeitschrift für Naturforsch. B 33b, 1443 (1978).
- Onoda-Yamamuro et al. (1990) N. Onoda-Yamamuro, T. Matsuo, and H. Suga, J. Phys. Chem. Solids 51, 1383 (1990).
- Kawamura et al. (2002) Y. Kawamura, H. Mashiyama, and K. Hasebe, J. Phys. Soc. Japan 71, 1694 (2002).
- Onoda-Yamamuro et al. (1992) N. Onoda-Yamamuro, T. Matsuo, and H. Suga, J. Phys. Chem. Solids 53, 935 (1992).
- Weller et al. (2015) M. T. Weller, O. J. Weber, P. F. Henry, A. M. Di Pumpo, and T. C. Hansen, Chem. Commun. 51, 4180 (2015).
- Leguy et al. (2015) A. M. A. Leguy, J. M. Frost, A. P. McMahon, V. G. Sakai, W. Kochelmann, C. Law, X. Li, F. Foglia, A. Walsh, B. C. O’Regan, J. Nelson, J. T. Cabral, and P. R. F. Barnes, Nat. Commun. 6, 7124 (2015).
- Bakulin et al. (2015) A. A. Bakulin, O. Selig, H. J. Bakker, Y. L. A. Rezus, C. Müller, T. Glaser, R. Lovrincic, Z. Sun, Z. Chen, A. Walsh, J. M. Frost, and T. L. C. Jansen, J. Phys. Chem. Lett. 6, 3663 (2015).
- Perdew et al. (2008) J. P. Perdew, A. Ruzsinszky, G. I. Csonka, O. A. Vydrov, G. E. Scuseria, L. A. Constantin, X. Zhou, and K. Burke, Phys. Rev. Lett. 100, 136406 (2008).
- (25) See Supplemental Material at [URL will be inserted by publisher] for an animation of the zone-centre vibrational modes of the cubic perovskite phase and a comparison of the simulated and measured diffraction patterns.
- Poglitsch and Weber (1987) A. Poglitsch and D. Weber, J. Chem. Phys. 87, 6373 (1987).
- Baikie et al. (2013) T. Baikie, Y. Fang, J. M. Kadro, M. Schreyer, F. Wei, S. G. Mhaisalkar, M. Gratzel, and T. J. White, J. Mater. Chem. A 1, 5628 (2013).
- Frost et al. (2014b) J. M. Frost, K. T. Butler, and A. Walsh, APL Mater. 2, 081506 (2014b).
- (29) https://github.com/WMD-Bath/Hybrid-perovskites (Accessed 1st July 2015).
- Wasylishen et al. (1985) R. Wasylishen, O. Knop, and J. Macdonald, Solid State Commun. 56, 581 (1985).
- Fan et al. (2015) Z. Fan, J. Xiao, K. Sun, L. Chen, Y. Hu, J. Ouyang, K. P. Ong, K. Zeng, and J. Wang, J. Phys. Chem. Lett. 6, 1155 (2015).
- Quarti et al. (2014a) C. Quarti, E. Mosconi, and F. De Angelis, Chem. Mater. 26, 6557 (2014a).
- Worhatch et al. (2008) R. J. Worhatch, H. J. Kim, I. P. Swainson, a. L. Yonkeu, and S. J. L. Billinge, Chem. Mater. 20, 1272 (2008).
- Brivio et al. (2013) F. Brivio, A. B. Walker, and A. Walsh, APL Mater. 1, 042111 (2013), arXiv:1309.4215 .
- Glaser et al. (2015) T. Glaser, C. Müller, M. Sendner, C. Krekeler, O. E. Semonin, T. D. Hull, O. Yaffe, J. S. Owen, W. Kowalsky, A. Pucci, and R. Lovrinčić, J. Phys. Chem. Lett. 6, 2913 (2015).
- Kresse and Furthmüller (1996) G. Kresse and J. Furthmüller, Comput. Mater. Sci. 6, 15 (1996).
- Kresse and Joubert (1999) G. Kresse and D. Joubert, Phys. Rev. B 59, 1758 (1999).
- Blöchl (1994) P. E. Blöchl, Phys. Rev. B 50, 17953 (1994).
- Togo et al. (2010) A. Togo, L. Chaput, I. Tanaka, and G. Hug, Phys. Rev. B 81, 174301 (2010).
- Skelton et al. (2014) J. M. Skelton, S. C. Parker, A. Togo, I. Tanaka, and A. Walsh, Phys. Rev. B 89, 205203 (2014).
- Togo et al. (2015) A. Togo, L. Chaput, and I. Tanaka, Phys. Rev. B 91, 094306 (2015).
- Stoffel et al. (2010) R. P. Stoffel, C. Wessel, M.-W. Lumey, and R. Dronskowski, Angew. Chem. Int. Ed. Engl. 49, 5242 (2010).
- Baroni and Gironcoli (2001) S. Baroni and S. D. Gironcoli, Rev. Mod. Phys. 73, 515 (2001).
- Skelton et al. (2015a) J. M. Skelton, E. L. da Silva, R. Crespo-Otero, L. E. Hatcher, P. R. Raithby, S. C. Parker, and A. Walsh, Faraday Discuss. 177, 181 (2015a).
- Ledinský et al. (2015) M. Ledinský, P. Löper, B. Niesen, J. Holovský, S.-J. Moon, J.-H. Yum, S. De Wolf, A. Fejfar, and C. Ballif, J. Phys. Chem. Lett. 6, 401 (2015).
- Quarti et al. (2014b) C. Quarti, G. Grancini, E. Mosconi, P. Bruno, J. M. Ball, M. M. Lee, H. J. Snaith, A. Petrozza, and F. D. Angelis, J. Phys. Chem. Lett. 5, 279 (2014b).
- Ahmed et al. (2014) T. Ahmed, C. La-o vorakiat, T. Salim, Y. M. Lam, E. E. M. Chia, and J.-X. Zhu, Europhys. Lett. 108, 67015 (2014).
- Noh et al. (2013) J. H. Noh, S. H. Im, J. H. Heo, T. N. Mandal, and S. I. Seok, Nano Lett. 13, 1764 (2013).
- Skelton et al. (2015b) J. M. Skelton, D. Tiana, S. C. Parker, A. Togo, I. Tanaka, and A. Walsh, J. Chem. Phys. 143, 064710 (2015b).
- Onoda-yamamuro (1992) N. Onoda-yamamuro, Physico-chemical Study of Some Perovskite-type Methyl- ammonium Trihalogenometallates, Doctoral thesis, Osaka University (1992).
- Fujii et al. (1974) Y. Fujii, S. Hoshino, Y. Yamada, and G. Shirane, Phys. Rev. B 9, 4549 (1974).
- Quarti et al. (2015) C. Quarti, E. Mosconi, and F. De Angelis, Phys. Chem. Chem. Phys. 17, 9394 (2015).
- Dove (1997) M. T. Dove, Am. Mineral. 82, 213 (1997).
- Buckeridge et al. (2013) J. Buckeridge, D. O. Scanlon, A. Walsh, C. R. A. Catlow, and A. A. Sokol, Phys. Rev. B 87, 214304 (2013).
- Sears et al. (1979) W. Sears, M. Klein, and J. Morrison, Phys. Rev. B 19, 2305 (1979).
- Silva et al. (2015) E. L. Silva, J. M. Skelton, S. C. Parker, and A. Walsh, Phys. Rev. B 91, 144107 (2015).
- Pisoni et al. (2014) A. Pisoni, J. Jaćimović, O. S. Barišić, M. Spina, R. Gaál, L. Forró, and E. Horváth, J. Phys. Chem. Lett. 5, 2488 (2014), arXiv:1407.4931 .
- He and Galli (2014) Y. He and G. Galli, Chem. Mater. 26, 5394 (2014).