WISE colours and star-formation in the host galaxies of radio-loud narrow-line Seyfert 1
Abstract
We investigate the mid-infrared properties of the largest (42 objects) sample of radio-loud narrow-line Seyfert 1 (RL NLS1) collected to date, using data from the Wide-field Infrared Survey Explorer (WISE). We analyse the mid-IR colours of these objects and compare them to what is expected from different combinations of AGN and galaxy templates. We find that, in general, the host galaxy emission gives an important contribution to the observed mid-IR flux in particular at the longest wavelengths (W3, at 12µm, and W4, at 22µm). In about half of the sources (22 objects) we observe a very red mid-IR colour (W4-W32.5) that can be explained only using a starburst galaxy template (M82). Using the 22µm luminosities, corrected for the AGN contribution, we have then estimated the star-formation rate for 20 of these “red” RL NLS1, finding values ranging from 10 to 500 M☉ y-1. For the RL NLS1 showing bluer colours, instead, we cannot exclude the presence of a star-forming host galaxy although, on average, we expect a lower star-formation rate. Studying the radio (1.4 GHz) to mid-IR (22µm) flux ratios of the RL NLS1 in the sample we found that in 10 objects the star-forming activity could represent the most important component also at radio frequencies, in addition (or in alternative) to the relativistic jet. We conclude that both the mid-IR and the radio emission of RL NLS1 are a mixture of different components, including the relativistic jet, the dusty torus and an intense star-forming activity.
keywords:
galaxies: active - galaxies: nuclei - galaxies: jets - galaxies: starburst1 Introduction
The importance of the nuclear active accretion phase (AGN) in the context of galaxy evolution has been fully recognized only in the last years (e.g see Heckman & Best 2014 for a recent review). According to the galaxy-AGN co-evolution scenario, at high redshifts, both star-forming (SF) activity and nuclear accretion must have proceeded simultaneously and at high rates thanks to the abundance of cold gas and to the frequent galaxy mergers that made the gas available for both processes. In a second phase, when the AGN luminosity was high enough to expel the gas from the galaxy, both star-formation and accretion rates gradually reduced eventually leading to a “passive” elliptical hosting a quiescent super-massive black-hole.
At low redshift, however, galaxy interactions and/or internal galaxy dynamics can destabilize the residual gas and make it available for new episodes of SF and nuclear activity at high accretion rates. Mathur (2000) has proposed that the so-called Narrow-Line Seyfert 1 galaxies (NLS1), a peculiar sub-class of AGN that is characterized by rapidly accreting central black-holes with relatively small masses (between 105 and 108 M☉ ), may represent the low-redshift, low-luminosity analogues of the first high-z quasars, hosted by rejuvenated, gas-rich galaxies. In support to this hypothesis, it has been noted that NLS1 are more frequently associated to host galaxies with large levels of star-forming activity than Broad Line Seyfert 1 (BLS1) galaxies (e.g. Deo, Crenshaw & Kraemer 2006; Sani et al. 2010, 2012). In this context, NLS1 could be systems that are building up mass, evolving eventually into BLS1. The time-scale of this process should depend on the radiative efficiency of the accretion process, as discussed in Orban de Xivry et al. (2011).
Interestingly, NLS1 may be considered as “young systems” also from the radio point-of-view. NLS1s are typically radio-quiet (RQ) sources with only a small fraction that can be classified as radio-loud (RL, 7%, Komossa et al. 2006 and about 50 in total known to date, Foschini 2011). The radio properties of these RL NLS1 seem to be different from those observed in RL BLS1 mainly because of the lack of extended radio structures, except for very few cases (e.g. Doi et al. 2012). It has been proposed that at least some of the RL NLS1 can be associated to young radiogalaxies whose relativistic jet is still digging its way through the ISM of the host galaxy possibly evolving into a “classical” giant radiogalaxy (Moran 2000; Oshlack, Webster & Whiting 2001; Gallo et al. 2006; Komossa et al. 2006; Yuan et al. 2008; Caccianiga et al. 2014). Notably, young and compact radiogalaxies are observed also in the 3 radio-loud QSO discovered to date at z6 (Frey et al. 2011, 2012). This further increases the possible analogies between local NLS1 and high-z QSO.
| name | other name | z | W1 | W2 | W3 | W4 | ||||||||
|---|---|---|---|---|---|---|---|---|---|---|---|---|---|---|
| (3.4µm) | (4.6µm) | (12 µm) | (22µm) | |||||||||||
| mag | unc. | S/N | mag | unc. | S/N | mag | unc. | S/N | mag | unc. | S/N | |||
| J0100-0200 | FBQSJ0100-0200 | 0.227 | 12.859 | 0.023 | 46.5 | 11.754 | 0.023 | 46.7 | 8.407 | 0.024 | 44.7 | 6.187 | 0.060 | 18.0 |
| J0134-4258 | PMNJ0134-4258 | 0.237 | 12.157 | 0.024 | 46.1 | 11.129 | 0.021 | 52.4 | 8.125 | 0.022 | 49.1 | 5.924 | 0.042 | 25.9 |
| J0324+3410 | 1H0323+342 03 1 2 | 0.061 | 10.743 | 0.022 | 49.1 | 9.791 | 0.020 | 54.7 | 7.179 | 0.016 | 67.4 | 4.847 | 0.027 | 40.1 |
| J0706+3901 | FBQSJ0706+3901 | 0.086 | 12.888 | 0.024 | 45.6 | 11.959 | 0.022 | 48.9 | 8.599 | 0.026 | 41.0 | 6.049 | 0.051 | 21.4 |
| J0713+3820 | FBQSJ0713+3820 | 0.123 | 10.040 | 0.022 | 49.3 | 8.990 | 0.020 | 53.5 | 6.261 | 0.015 | 74.8 | 3.984 | 0.021 | 51.7 |
| J0744+5149 | NVSSJ074402+514917 | 0.460 | 13.397 | 0.024 | 44.4 | 12.384 | 0.025 | 43.7 | 9.636 | 0.044 | 24.7 | 6.829 | 0.069 | 15.6 |
| J0804+3853 | SDSSJ080409.23+385348.8 | 0.211 | 11.745 | 0.023 | 46.4 | 10.750 | 0.020 | 54.3 | 8.077 | 0.022 | 48.8 | 5.372 | 0.032 | 33.5 |
| J0814+5609 | SDSSJ081432.11+560956.6 | 0.509 | 14.221 | 0.027 | 40.4 | 13.139 | 0.028 | 38.9 | 10.411 | 0.074 | 14.6 | n.d. | - | - |
| J0849+5108 | SDSSJ084957.97+510829.0 1 2 | 0.584 | 12.887 | 0.024 | 44.7 | 11.956 | 0.022 | 48.8 | 10.042 | 0.049 | 22.0 | 7.552 | 0.135 | 8.0 |
| J0902+0443 | SDSSJ090227.16+044309.5 | 0.532 | 13.927 | 0.026 | 41.0 | 13.096 | 0.029 | 37.7 | 10.015 | 0.064 | 16.9 | 7.058 | 0.086 | 12.7 |
| J0937+3615 | SDSSJ093703.02+361537.1 | 0.179 | 12.165 | 0.024 | 45.7 | 11.202 | 0.021 | 51.5 | 8.135 | 0.021 | 50.8 | 5.472 | 0.035 | 31.1 |
| J0945+1915 | SDSSJ094529.23+191548.8 | 0.284 | 12.042 | 0.024 | 45.9 | 11.078 | 0.022 | 50.1 | 8.279 | 0.023 | 47.4 | 5.705 | 0.044 | 25.0 |
| J0948+0022 | SDSSJ094857.31+002225.4 2 | 0.585 | 13.282 | 0.024 | 44.5 | 12.204 | 0.023 | 46.5 | 9.096 | 0.032 | 33.4 | 6.682 | 0.088 | 12.3 |
| J0953+2836 | SDSSJ095317.09+283601.5 | 0.658 | 14.809 | 0.032 | 33.9 | 13.924 | 0.039 | 27.6 | 11.335 | 0.179 | 6.1 | n.d. | - | - |
| J1031+4234 | SDSSJ103123.73+423439.3 | 0.376 | 14.323 | 0.029 | 37.8 | 13.300 | 0.030 | 35.8 | 10.446 | 0.078 | 14.0 | 8.392 | 0.343 | 3.2 |
| J1037+0036 | SDSSJ103727.45+003635.6 | 0.595 | 15.108 | 0.037 | 29.5 | 13.854 | 0.039 | 27.8 | 10.698 | 0.103 | 10.6 | n.d. | - | - |
| J1038+4227 | SDSSJ103859.58+422742.2 | 0.220 | 12.549 | 0.024 | 46.0 | 11.532 | 0.021 | 50.7 | 8.870 | 0.028 | 39.1 | 6.576 | 0.058 | 18.8 |
| J1047+4725 | SDSSJ104732.68+472532.0 | 0.798 | 14.749 | 0.031 | 35.2 | 13.641 | 0.033 | 33.3 | 10.435 | 0.089 | 12.2 | 7.748 | 0.189 | 5.7 |
| J1048+2222 | SDSSJ104816.58+222239.0 | 0.330 | 13.499 | 0.025 | 44.3 | 12.356 | 0.026 | 42.4 | 9.292 | 0.044 | 24.5 | 7.087 | 0.114 | 9.5 |
| J1102+2239 | SDSSJ110223.38+223920.7 | 0.453 | 13.167 | 0.024 | 45.7 | 12.042 | 0.024 | 44.7 | 9.146 | 0.034 | 31.5 | 6.489 | 0.069 | 15.7 |
| J1110+3653 | SDSSJ111005.03+365336.3 | 0.630 | 16.038 | 0.058 | 18.6 | 15.230 | 0.090 | 12.1 | n.d. | - | - | n.d. | - | - |
| J1138+3653 | SDSSJ113824.54+365327.1 | 0.356 | 14.055 | 0.026 | 42.1 | 13.139 | 0.028 | 39.1 | 10.532 | 0.084 | 13.0 | 8.007 | 0.207 | 5.2 |
| J1146+3236 | SDSSJ114654.28+323652.3 | 0.465 | 14.099 | 0.027 | 39.8 | 13.208 | 0.029 | 38.0 | 10.509 | 0.080 | 13.6 | 8.571 | 0.313 | 3.5 |
| J1159+2838 | SDSSJ115917.32+283814.5 | 0.210 | 13.451 | 0.025 | 42.6 | 12.343 | 0.023 | 46.3 | 9.015 | 0.034 | 32.2 | 5.982 | 0.042 | 25.8 |
| J1227+3214 | SDSSJ122749.14+321458.9 | 0.137 | 11.441 | 0.023 | 48.2 | 10.328 | 0.020 | 53.7 | 7.420 | 0.018 | 60.8 | 4.802 | 0.024 | 44.8 |
| J1238+3942 | SDSSJ123852.12+394227.8 | 0.623 | 15.327 | 0.037 | 29.7 | 14.525 | 0.050 | 21.9 | 11.700 | 0.183 | 5.9 | n.d. | - | - |
| J1246+0238 | SDSSJ124634.65+023809.0 | 0.363 | 14.163 | 0.029 | 37.4 | 13.094 | 0.029 | 37.2 | 10.346 | 0.084 | 12.9 | 7.517 | 0.161 | 6.7 |
| J1333+4141 | SDSSJ133345.47+414127.7 | 0.225 | 13.102 | 0.023 | 47.2 | 11.947 | 0.022 | 49.5 | 8.763 | 0.024 | 44.6 | 5.846 | 0.043 | 25.1 |
| J1346+3121 | SDSSJ134634.97+312133.7 | 0.246 | 13.744 | 0.025 | 43.1 | 12.850 | 0.026 | 41.8 | 9.693 | 0.039 | 27.6 | 7.283 | 0.105 | 10.3 |
| J1348+2622 | SDSSJ134834.28+262205.9 | 0.918 | 14.710 | 0.029 | 37.0 | 13.368 | 0.028 | 38.2 | 10.400 | 0.064 | 16.9 | 8.574 | 0.287 | 3.8 |
| J1358+2658 | SDSSJ135845.38+265808.5 | 0.331 | 13.133 | 0.024 | 44.7 | 12.069 | 0.022 | 48.3 | 9.225 | 0.030 | 36.2 | 6.531 | 0.058 | 18.6 |
| J1421+2824 | SDSSJ142114.05+282452.8 | 0.538 | 13.674 | 0.025 | 43.0 | 12.607 | 0.024 | 45.8 | 9.614 | 0.038 | 28.7 | 7.194 | 0.096 | 11.3 |
| J1505+0326 | SDSSJ150506.47+032630.8 | 0.409 | 14.028 | 0.027 | 40.1 | 13.093 | 0.029 | 37.8 | 9.840 | 0.045 | 24.4 | 7.061 | 0.086 | 12.7 |
| J1548+3511 | SDSSJ154817.92+351128.0 | 0.479 | 13.770 | 0.026 | 42.1 | 12.771 | 0.024 | 44.8 | 9.883 | 0.035 | 31.4 | 7.200 | 0.072 | 15.1 |
| J1612+4219 | SDSSJ161259.83+421940.3 | 0.234 | 13.308 | 0.024 | 45.8 | 12.199 | 0.022 | 48.9 | 8.135 | 0.018 | 62.0 | 5.572 | 0.030 | 36.3 |
| J1629+4007 | SDSSJ162901.30+400759.9 | 0.272 | 13.290 | 0.024 | 45.6 | 12.177 | 0.022 | 49.1 | 9.471 | 0.037 | 29.4 | 6.865 | 0.070 | 15.6 |
| J1633+4718 | SDSSJ163323.58+471858.9 1 | 0.116 | 12.135 | 0.023 | 46.6 | 11.318 | 0.020 | 53.2 | 7.642 | 0.017 | 64.0 | 4.974 | 0.024 | 44.8 |
| J1634+4809 | SDSSJ163401.94+480940.2 | 0.495 | 14.883 | 0.028 | 39.0 | 13.884 | 0.031 | 35.1 | 10.711 | 0.049 | 22.1 | 8.081 | 0.119 | 9.2 |
| J1644+2619 | SDSSJ164442.53+261913.2 | 0.145 | 13.283 | 0.024 | 44.7 | 12.294 | 0.024 | 44.4 | 9.455 | 0.040 | 27.1 | 7.019 | 0.100 | 10.8 |
| J1709+2348 | SDSSJ170907.80+234837.7 | 0.254 | 13.758 | 0.026 | 42.5 | 12.785 | 0.024 | 44.4 | 9.903 | 0.044 | 24.6 | 7.343 | 0.117 | 9.2 |
| J2007-4434 | PKS 2004-447 | 0.240 | 13.445 | 0.025 | 43.7 | 12.349 | 0.024 | 44.8 | 9.467 | 0.035 | 31.1 | 7.025 | 0.098 | 11.0 |
| J2021-2235 | IRAS 20181-2244 1 | 0.185 | 11.880 | 0.023 | 48.0 | 10.997 | 0.021 | 51.6 | 7.601 | 0.017 | 63.5 | 4.710 | 0.034 | 32.2 |
Notes: 1=flagged as extended in one or more bands in the AllWISE catalogue (ext_flg=3 or 5); 2=flagged as possible variable in W1 and W2 band in the AllWISE catalogue (var_flg7)
The possibility that NLS1 are “young” systems where the AGN-galaxy co-evolution is taking place and where, in some cases, a young relativistic jet is ejected and observed in the early phase of its evolution, is intriguing: the study of these sources may offer a unique opportunity of investigating the co-evolution mechanism in both radio-loud and radio-quiet objects at relatively low-redshifts where the observational constraints are less challenging with respect to high-z QSO.
In this paper we focus on the radio-loud fraction of NLS1 that is still poorly studied. In particular, we want to assess if RL NLS1 are similar to RQ NLS1 for what concerns their preference in being hosted by star-forming galaxies. To date, only few RL NLS1 have been studied from this point of view. Optical imaging has revealed the existence of arms or circumnuclear rings (possibly the consequence of a recent merger) and the presence of a circumnuclear starburst in at least one RL NLS1 (1H 0323+342, Zhou et al. 2007; Antón, Browne & Marchã 2008; León-Tavares et al. 2014). In a recent paper (Caccianiga et al. 2014), a new case of RL NLS1 has been presented whose Spectral Energy Distribution (SED) is strongly suggestive of the presence of a quite intense star-formation (50 M☉ y-1). The presence of this intense SF was revealed by the mid-infrared (mid-IR) data at 12 and 22µm from the Wide-field Infrared Survey Explorer (WISE) catalogue (Wright et al. 2010) that showed a clear excess with respect to a typical dust emission from a radio-quiet AGN or to the IR non-thermal spectrum coming from a jet. We now want to extend such a result on a large sample of RL NLS1 to establish whether the presence of star-formation is a peculiar characteristic of some isolated sources or, instead, is a global property of the entire class.
The sample and the data used in this study are presented in Section 2. In Section 3 we discuss how the mid-IR colours (particularly those including the 22µm band) of the sources cannot be satisfactorily explained by the AGN emission alone. In Section 4 we consider the effect of galaxy emission on the observed IR colours and we infer the presence of a star-forming host in many objects of the sample. In Section 5 we compare the 1.4 GHz to 22µm flux ratios of the RL NLS1 with those of blazars and infrared galaxies while in Section 6 we estimate the star-formation rate (SFR) present in the sources with the reddest W3-W4 colours. Conclusions are finally presented in Section 7.
Throughout the paper we assume a flat CDM cosmology with H0=71 km s-1 Mpc-1, =0.7 and =0.3. Spectral indices are defined assuming S.
2 The sample of RL NLS1 and WISE data
Foschini et al. (2015) has presented an extended study of the 42 RL NLS1 with a large radio-loudness parameter111The radio-loudness parameter used in Foschini et al. (2015) is defined as the 5 GHz to 4400Å flux density ratio. (10, see Foschini et al. 2015 for details) and a flat radio-spectrum (i.e. with blazar-like characteristics) discovered so far222We note that only 22 sources out of 42 have a measured radio spectral index. Of these 22 objects, 20 have a flat slope (0.5) while 2 have marginally above this value (0.55 and 0.58, respectively) but consistent with it taking into account the errors (see Foschini et al. 2015 and also Richards & Lister 2015 for the recently measured spectral index of J0953+2836). The remaining 20 sources have no information on the radio spectral index and should be considered more properly as “flat-spectrum candidates”.. Several pieces of information, from the radio to the X-ray and gamma-ray band, have been collected and studied. The physical properties of the inner supermassive black-hole (SMBH), like its mass and the accretion rate, have been also discussed. This is the largest sample of RL NLS1 collected so far and, therefore, it represents the best starting point to study the incidence of star-formation in the galaxies hosting these AGNs. It should be noted, however, that the type of selection of this sample, namely the requirement of a flat radio spectrum, strongly favours the presence of a relativistically beamed jet emission (as in blazars), which could be important also in the mid-IR band. This may partly (or totally) hide the emission from the host galaxy. To date, however, only few RL NLS1 without “blazar-like” characteristics have been discovered and, therefore, the Foschini et al. (2015) sample is the only possibility for this type of analysis, at the moment.
The mid-IR data have been collected from the WISE all-sky catalog (Wright et al. 2010) and, in particular, we have used the last version of the catalogue, the AllWISE data release (November 2013), which has an enhanced photometric sensitivity and accuracy compared to the 2012 WISE All-Sky Data Release. All the NLS1 of the sample are detected (S/N3) in the WISE survey at 3.4 and 4.6 micron (W1 and W2 bands, respectively), all but one are detected at 12µm (W3) and 37 are detected at 22µm (W4). Data for the 42 RL NLS1 are reported in Table 1.
Four sources are flagged in the catalogue as possibly extended i.e. the source profile fit has a large () value in one or more bands. In one of these sources (J0324+3410/1H 0323+342) imaging in R and B has revealed the existence of extended structures (arms/rings) that could be the consequence of a recent merger (Antón, Browne & Marchã 2008). In the remaining 3 sources the available optical images (from SDSS or UKST) show the presence of a nearby (5) object, possibly in interaction with the NLS1. Finally, 3 sources in the catalogue (J0324+3410, J0849+5108 and J0948+0022) are flagged as variable in the W1 and W2 band and for two of them (J0849+5108 and J0948+0022) intra-day variability has been studied by Jiang et al. (2012).
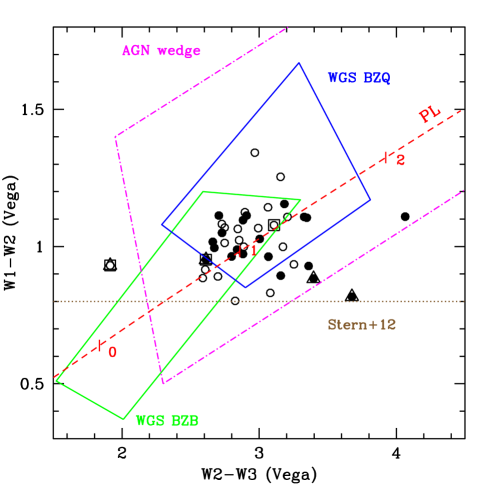
In Fig. 1 we show the distribution of the WISE colours in the W1, W2 and W3 filters for the 41 RL NLS1 detected in all the 3 bands. In this figure we also show some characteristic regions recently adopted to select different types of AGN (see figure caption for details). Not surprisingly, all the objects fulfill the AGN definition (W1-W20.8) proposed by Stern et al. (2012) and all but 2 lie in the AGN wedge discussed by Mateos et al. (2012, 2013). Most (78%) of the RL NLS1 occupy the region where blazars are usually found (blue and green solid regions) while 9 sources lie outside it. One source, in particular, shows a very blue W2-W3 colour (W2-W3=1.914), which is significantly different from the values observed in the other objects. This source, however, is one of the 3 objects flagged as variable (J0849+5108, one of the sources detected also in gamma-rays by FERMI, Foschini et al. 2015). Indeed, the W1 and W2 magnitudes reported in Jiang et al. (2012), based on the previous version of the WISE All-Sky catalogue, are significantly fainter (1.1 mag) than the ones reported here. Therefore, the position on the W1-W2 vs W2-W3 plot of this objects is likely affected by the observed flux variations and, for this reason, it is not indicative of the real spectral distribution of the source333 It should be considered that the AllWISE catalogue, that we are using in this work, has been produced by combining all the data from both the WISE cryogenic and post-cryogenic survey phases, the latter being carried out only in the W1 and W2 bands. Therefore, the periods over which the images have been collected and combined are different for the 4 bands.
3 AGN emission and WISE colours
Even if the RL NLS1 are broadly clustered around the region expected for a power-law (PL) spectrum (with a spectral index ranging from 0.5 to 1.5), many departures from this region are also observed: some sources occupy the region above this line (towards redder W1-W2 colours) while others occupy a region bluer in W1-W2 and redder in W2-W3.
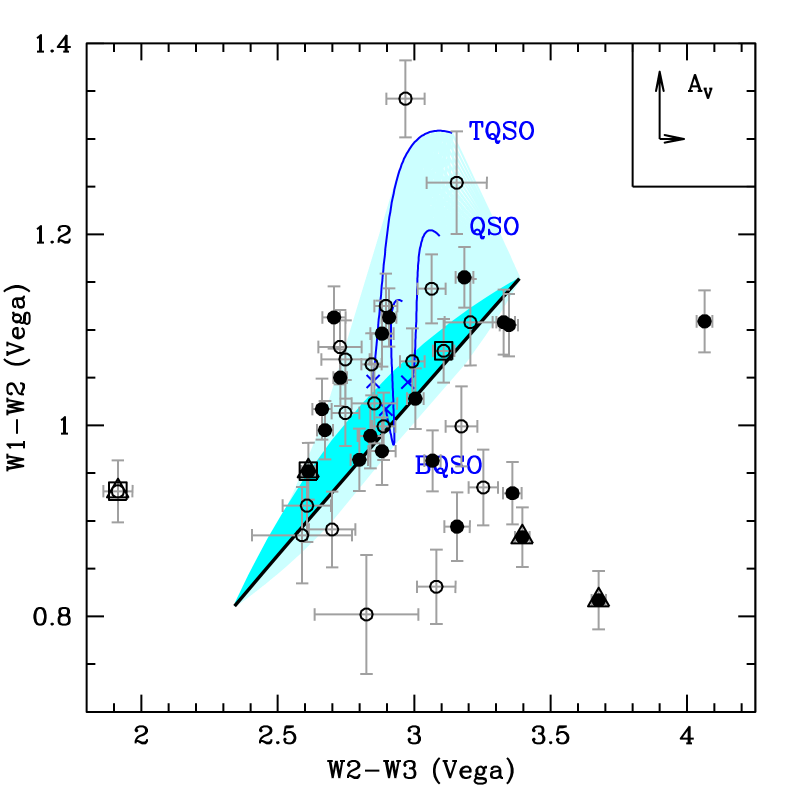
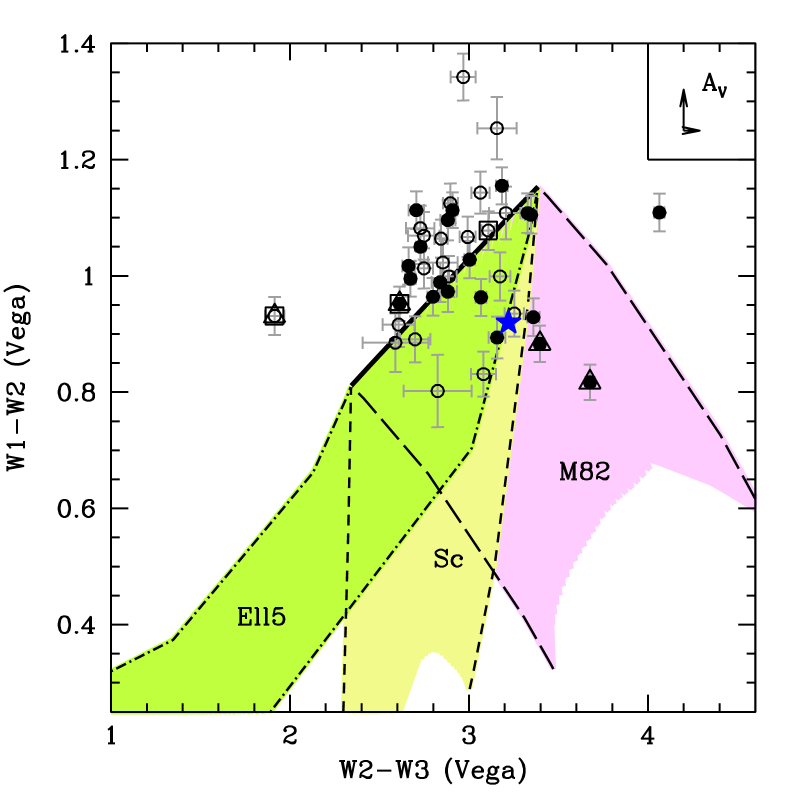
If the WISE emission of these RL NLS1 were totally dominated by the non-thermal jet we would expect a power-law or a broken power-law spectral shape. In Fig. 2 (left) we show the region on the W1-W2 vs W2-W3 plot where we expect to find a source whose IR spectrum is described by a broken power-law with a slope before the break ranging from 0.5 to 1 and a slope after the break of 1.5 and with the position of the break varying within the WISE bands (dark blue shaded area). As clear from Fig. 2 (left), we expect that a source with a broken power-law spectrum would fall above the PL line. Several sources are actually found in this region although the majority of them seem to be much “redder”, in terms of W1-W2 colour, than what is expected from a broken power-law.
In principle a significant level of extinction could change the position of a source with a power-law spectrum moving it away from the expected region, towards redder values of W1-W2 and W2-W3. However, since these sources are, by definition, type 1 AGNs, i.e. objects where both the AGN continuum and the broad emission lines are visible in the optical spectrum, the extinction is not expected to have an important impact on the mid-IR colours (e.g. see Mateos et al. 2015). In the upper-right side of both panels of Fig. 2 we indicate with an arrow the expected effect of an extinction of AV=2 mag at the mean redshift of the sample (z=0.36). An AV of 2 magnitudes is the maximum expected for type 1 AGNs as discussed, for instance, in Caccianiga et al. (2008).
It is also possible that part (or the totality) of the observed IR emission is produced by the radio-quiet component of the source (i.e. the dusty torus) and not by the non-thermal jet. Indeed, the presence of this component is expected and it has been revealed in many radio-loud AGN and blazars (e.g. Malmrose et al. 2011; Raiteri et al. 2014; Gurkan, Hardcastle & Jarvis 2014; Castignani & De Zotti 2015). In Fig. 2 (left) we plot the position of 3 radio-quiet type 1 QSO templates444 These templates have been derived by Polletta et al. (2007) by combining the SDSS quasar composite spectrum and rest-frame IR data of a sample of optically-selected type 1 QSOs observed in the SWIRE program. The 3 templates have the same optical spectrum but three different IR SEDs: a mean IR spectrum, obtained from the average fluxes of all measurements (“QSO1”), a template with high IR/optical flux ratio template, obtained from the highest per cent measurements per bin (“TQSO1”), and a low-IR emission SED obtained from the lowest per cent measurements per bin (“BQSO1”). (from Polletta et al. 2007) in the range of redshift between 0 and 0.9 (the range of z of the sample, red solid lines). The regions occupied by these 3 templates lie above the PL line and reach redder W1-W2 values than the broken power-law, in particular for high redshift sources (z between 0.5 and 0.9). Notably, the source with the reddest value of W1-W2 (=1.34, J1348+2622) is also the object with the largest redshift in the sample (z=0.918). Only the TQSO1 template can reach such a red W1-W2 colour that a broken power-law, instead, does not seem able to reproduce. We consider this as an indication that, at least in a number of objects, the mid-IR emission is probably mainly produced by the radio-quiet component (i.e. the torus) rather than the relativistic jet.
Finally, we consider also the possibility that both the dusty-torus and the jet emissions are present in the spectrum. To this end, we combine the 3 QSO templates with a power-law emission, at different values of redshift (from 0 to 0.9), varying the relative normalizations of the two components (light blue shaded area).
From the analysis of Fig. 2 (left) we conclude that the sources lying above the PL line in the W1-W2 vs W2-W3 plot could be explained either by a broken power-law emission, expected when the jet emission is dominant, or by a RQ AGN (i.e. torus) emission or by a combination of the two components. Only one object (J0849+5108) lies above the PL but in a isolated region toward blue W2-W3 values (W1-W2=0.931 and W2-W3=1.914). As said before, this is a highly variable source and, therefore, its position is not indicative of the actual IR spectral shape.
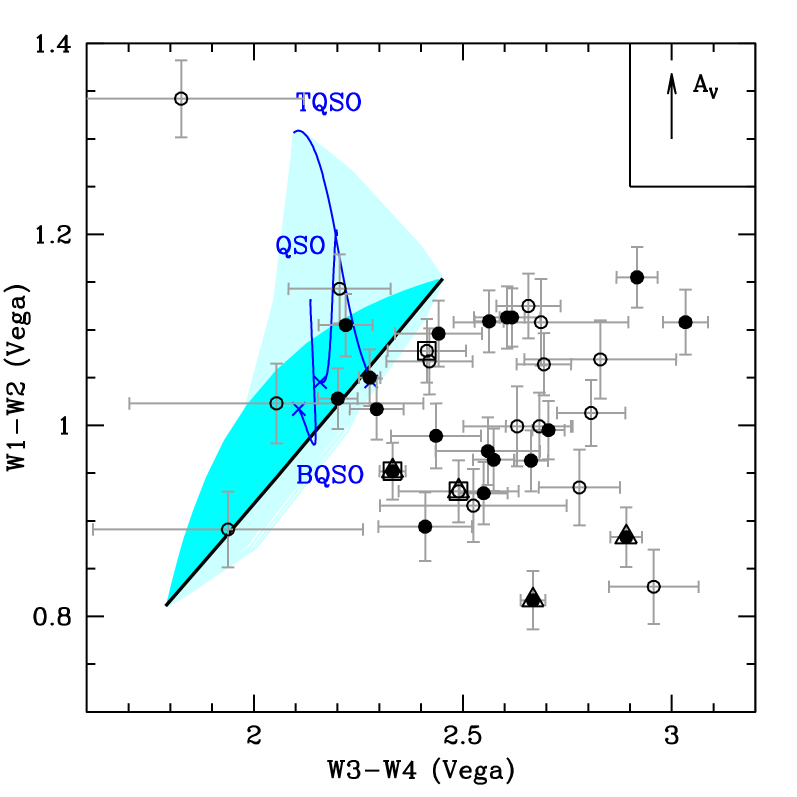
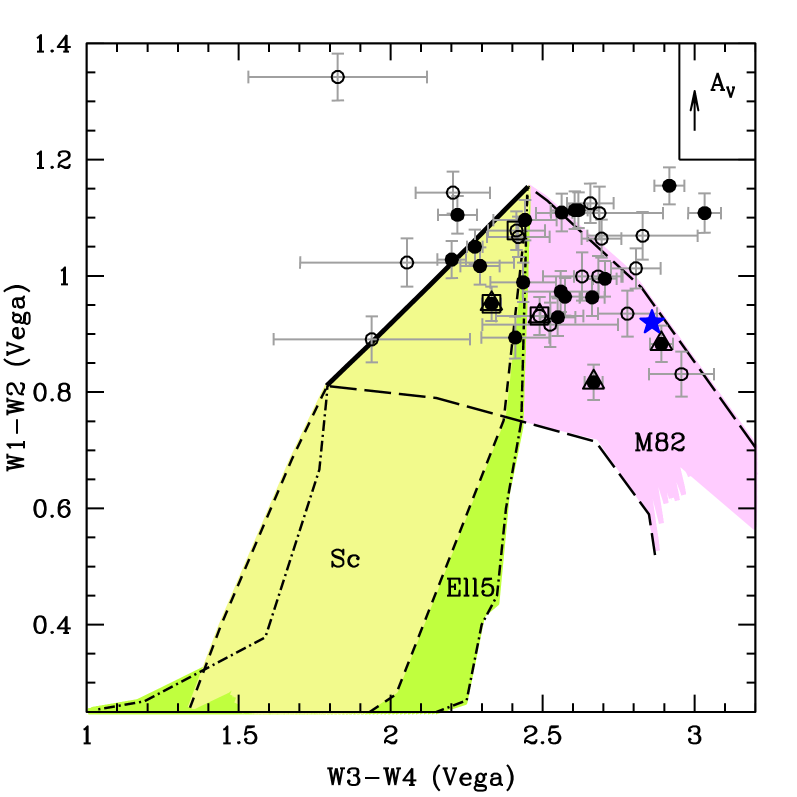
In 10 cases, the objects fall well below the PL line and, therefore, their colours are not easily explained by a torus/jet emission nor by a combination of the two. The number of sources not explained by these models is even higher if we consider the longest wavelength magnitude (W4, at =22µm) in the diagnostic plot i.e. if we plot W1-W2 vs W3-W4 (Fig. 2, right). As before, we over-plot the expected regions followed by a power-law, a broken power-law and a RQ AGN component plus a power-law emission. From this figure it is clear that only few objects can be explained by these models while the large majority ( 80-90%) lie well below the PL line thus requiring a different (very red) component. As described in the following section, the best candidate for the emission of this red component is the host galaxy.
4 The effect of galaxy dilution on IR colours
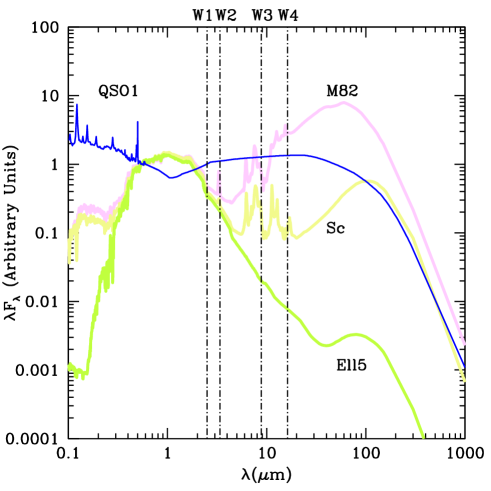
We consider here the effect of the combination of an AGN plus the host galaxy emission on the WISE colour plots. To this end, we use some representative templates of the SWIRE library (Polletta et al. 2007) Specifically, we use an early-type galaxy (“Ell5” template), an Sc galaxy (“Sc” template) and a starburst galaxy (“M82” template, Fig. 3). We start from a galaxy template and add a PL with different slopes and varying the relative AGN/galaxy normalization. In Fig. 4 we show the predicted effect of the host galaxy dilution on a power-law emission. An early-type host is expected to move the AGN colours towards the left/bottom side of the plot i.e. it is expected to produce bluer colours in both W1-W2 and W2-W3 (W3-W4) values as it gets more and more important. A starburst host, instead, is expected to make the W1-W2 values bluer than the power-law while both the W2-W3 and the W3-W4 colours become redder, thus bringing the object on the right-most side of the plot. Other starburst templates show a similar behaviour. This is the effect of the strong IR emission of the starburst component that becomes more and more important in the W3 (and W4) bands.
In Fig. 4 we also show the position of SDSSJ143244.91+301435.3, a RL NLS1 discussed in Caccianiga et al. (2014) whose SED has revealed the presence of a star-forming host galaxy with a SFR of 50 M☉ y-1. In order to correctly reproduce the infrared SED (in particular the W4 photometric point) of this object we used the M82 template by Polletta et al. (2007).
Fig. 4 (left) shows that the host galaxy may be contributing significantly to the mid-IR emission in a number (10) of sources of the sample, i.e. those objects that occupy the region below the PL line. For the sources just below this line the contribution from the host galaxy in these WISE bands is not enough to distinguish the type of the host galaxy. In 4 cases, instead, the very red W2-W3 colours seem to favour a star-forming host galaxy. We note that the position of SDSSJ143244.91+301435.3 on this plot does not clearly indicate a star-forming host galaxy. Indeed, as discussed in Caccianiga et al. (2014), the strongest indication for a M82-like host galaxy comes from the W4 band (22µm) which shows a clear excess. Fig. 4 (right) shows that using the W4 filter we can better discriminate between the different types of host galaxy. In particular, the mid-IR colours of the 22 sources with W3-W42.5 (like SDSSJ143244.91+301435.3) can be explained only by combining the AGN emission to a starburst galaxy host.
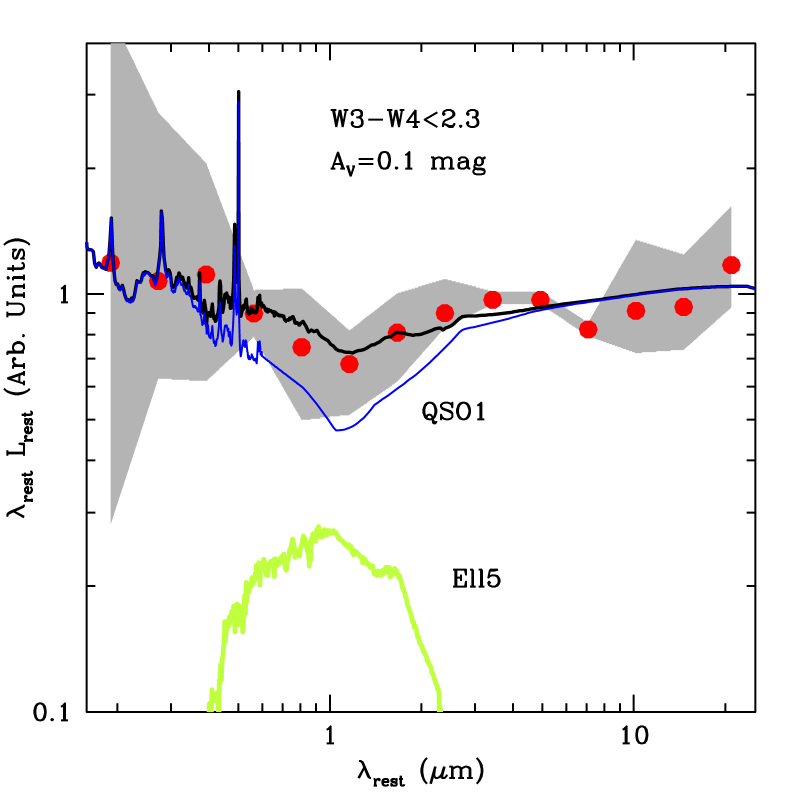
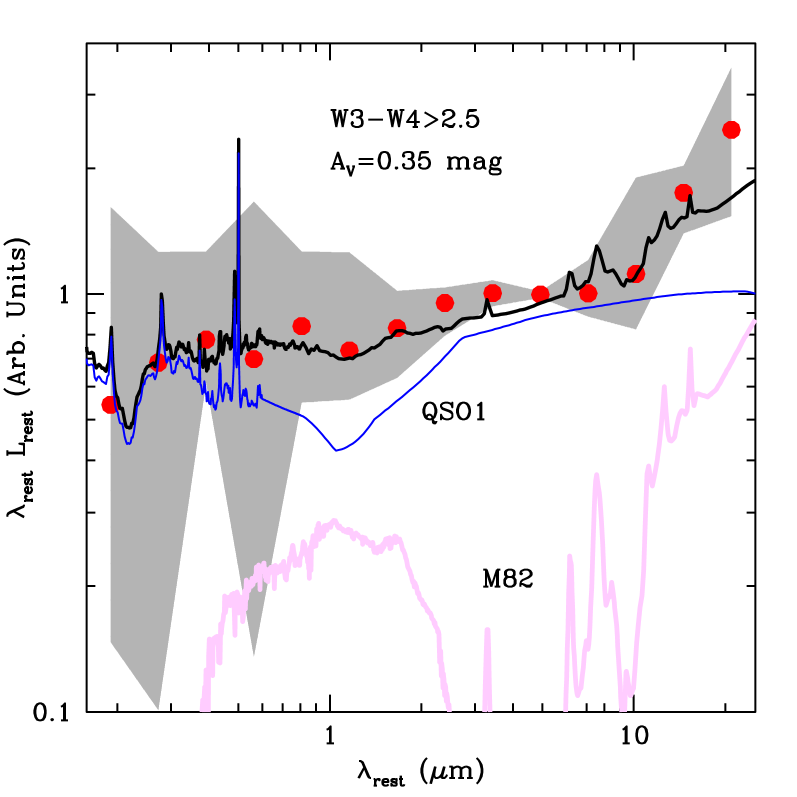
In order to better show the effect of the host galaxy on the observed spectrum we report in Fig. 5 the average UV-to-mid-IR SED of the NLS1 of the sample divided according to the value of W3-W4 colour (greater than 2.5 or lower than 2.3, in order to keep more separated the two groups). The average SEDs have been created by normalizing each rest-frame SEDs at 4µm and computing the average value of LogLλ in bins of Log. The grey area reports the region including 68% of points. The data used to produce these SED are taken from Foschini et al. (2015) and include, besides WISE photometry, data from Swift/UVOT observations and from existing public surveys like SDSS (DR9, Ahn et al. 2012), 2MASS (Cutri et al. 2003) and USNO-B (Monet et al. 2003).
To correctly interpret the shape of these average SEDs we model them with the sum of a galaxy and a QSO template, varying the relative normalization, the amount of nuclear extinction and the host morphology (see Ballo et al. 2014 for a more detailed description of the procedure). We consider different combinations of extinctions and galaxy/AGN templates and we find that templates with a low IR emission (early-type/Sc galaxies) are able to describe the observed average SED of the objects with bluer W3-W4 colours (left panel) while these templates systematically fail in reproducing the W3/W4 data points in the average SED of sources with redder W3-W4 (right panel). In this latter case, instead, a starburst galaxy template, like M82, is more suited to reproduce the steep increase of the data points towards longer wavelengths.
We note that the two average SEDs show some differences also in the UV/optical part. We can explain this difference with a different (average) extinction level. While to model the average-SED of the sources with a blue W3-W4 colour we have to apply only a small level of extinction (AV=0.1 mag), in the case of the red W3-W4 objects, we need a higher value of AV (0.35 mag). The explanation of this result could be related to the enhanced presence of dust in highly star-forming galaxies with respect to less star-forming galaxies (see e.g. Buat et al. 2002 and Domínguez et al. 2013).
5 Jet or star-formation?
So far, we have focused our analysis on the UV to mid-IR data and, in particular, on the mid-IR colours. From these data we have inferred the presence of a star-forming/starburst host galaxy in at least half of the RL NLS1 in the sample. Since an intense SF is expected to produce an important emission also in the radio band it is possible that the radio luminosities observed in these sources are in part contaminated by the SF activity. In principle, it is even possible that a high SFR can explain the totality of the observed radio emission. This would be an unexpected result, since the sample under investigation is composed by objects with large radio-loudness parameters and, in some cases, a flat radio spectrum. These properties are usually considered as strong indications that the radio emission is likely produced by a relativistic jet pointing towards the observer (and, thus, relativistically beamed).
Since jet-dominated objects and star-forming galaxies have significantly different radio-to-mid-IR flux ratios, it is interesting to compare this parameter computed for the RL NLS1 to the values usually observed in jet-dominated AGN (i.e. blazars), from the one hand, and to the values observed in star-forming galaxies, on the other hand.
To quantify the radio-to-mid-IR flux ratios we use two equivalent parameters. The two point spectral-index, defined between 1.4 GHz and 22µm (rest-frame555For the K-correction we use, for each source, the slope computed between 12 and 22µm (observed frame) fluxes and we assume =0 in the radio band.) as:
| (1) |
which is typically used in blazars studies, and the parameter q22 defined as:
| (2) |
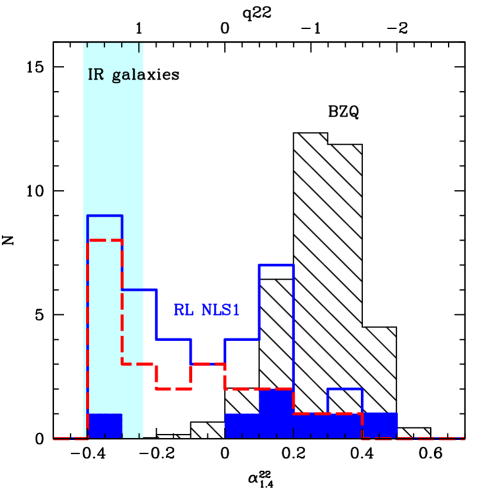
The radio-to-mid-IR indices for the 37 RL NLS1 in the sample detected in the W4 band are reported in Fig. 6. For comparison, we also report the distribution of for a sample of 430 blazars with a quasar spectrum (Flat Spectrum Radio Quasar, FSRQ) extracted from the BZCAT (Massaro et al. 2009) and detected with high significance (S/N10) in all the WISE filters. To help the comparison, this latter histogram has been re-normalized by a factor 10. We also indicate the typical range of radio-to-mid-IR values observed in the infrared galaxies reported by Rieke et al. (2009). In particular, we report the observed range of q24, a quantity similar to q22 but defined at 24µm instead of 22µm using Spitzer MIPS data. The average value found is 1.2-1.4, depending on the infrared luminosity of the source, with a dispersion of 0.24 dex.
The first consideration on Fig. 6 is that the RL NLS1 span a wide interval of radio-to-mid-IR indices, covering the entire range between the values observed in infrared galaxies to those observed in blazars. This is a first evidence that the radio and mid-IR emission of these sources are a mixture of different components. In sources with steep indices (0.2), i.e. within the range of values observed in blazars, the relativistic jet is likely the dominant component in the radio band (while in the mid-IR different emission could be present, including the dusty torus and/or the host galaxy). In sources with -0.25 (i.e. q221) the SF activity may be contributing significantly to the observed radio emission. This is likely true, for instance, in the sources with red W3-W4 colours (dashed red histogram), that are the majority in this interval of q22 values. The most obvious interpretation for the objects showing intermediate values, instead, is a combination of jet and SF (plus the dusty torus, in the mid-IR).
In support to the hypothesis that the relativistic jet is dominant in sources with steep values we note that 6 out of the 15 RL NLS1 with 0 (i.e. 40%) are detected in gamma-rays by FERMI (filled histogram in Fig. 6), something that is usually considered as an indication for the presence (and the dominance) of a relativistic jet, while only one object (J1102+2239) out 22 with 0 (5%) is a FERMI source. The dominance of the relativistic jet in 4 of the FERMI detected RL NLS1 with q220 (J0324+3410, J0849+5108, J0948+0022 and J1505+0326) has been recently quantified also by Angelakis et al. (2015) by means of a systematic monitoring in the radio and millimetric bands.
This confirms the presence and the importance of the relativistic jet in the sources with a positive value of while it seems to suggest that other mechanisms are at work in addition (or instead of) to the relativistic jet in most of the remaining sources. It is worth noting, however, that a low value of (or a high value of q22) does not necessarily exclude the presence of a jet as demonstrated by the detection in gamma-rays by FERMI of one of the objects with a high value of q22 (=1.34, J1102+2239)666Interestingly, this source was indicated by Foschini et al. (2015) as possible outlier in the gamma-ray/radio correlation.. Another example is the sources J1227+3214 that, in spite of a large q22 value (=1.29), has an inverted radio spectrum (=-1.04, Foschini et al. 2015) something that suggests a non-thermal origin of the radio emission (or at least of a fraction of it). It should be considered that variability can play an important role in determining the properties of a source at different wavelengths, including its position within the histogram of Fig. 6: during high activity periods, a source may appear as jet-dominated in many (if not all) frequencies, showing for instance a flat radio spectrum, a strong gamma-ray emission or a high radio-to-mid-IR flux ratio, while, during low activity periods, the signs for the presence of the jet can be hidden by the RQ AGN emission or even by the host galaxy light. For all these reasons, simultaneous multiwavelengths monitoring campaigns, together with radio follow-ups, in particular at VLBI resolution, are fundamental to disentangle the different components and establish their relative importance at different wavelengths.
6 Estimate of the star-formation rate
In this section we want to quantify the intensity of the star-formation at least in those sources where the mid-IR colours are suggestive of the presence of a starburst host. Specifically, we consider here only the 22 sources with a red W3-W4 colour (W3-W42.5). To limit the contamination due to the AGN nucleus (either the dusty torus or the jet component) we analyse here the longest wavelength WISE band (W4 at 22µm) since, according to the results previously discussed, this is the band where the star-forming nature of the host galaxy seems to emerge more clearly.
We first compute the 22 luminosities (). We derive the 22 flux densities from the W4 magnitudes777 For this conversion we assume an IR spectral slope of 1. The differences in the derived flux densities when assuming significantly different slopes, from -1 to 2, are below 0.7% and applied a K-correction using the spectral slope computed between 12 and 22µm (observed frame) fluxes. The computed 22 luminosities of the sources range between 1010 to 1012 L☉ with a large fraction (76%) of objects with L1011 L☉.
In order to derive an estimate of the SFR in these sources we can use the relation presented in Rieke et al. (2009) between SFR and L24µm (their eq.10 and eq.11). However, since the L22µm luminosity is likely contaminated by the AGN, in particular the dusty torus component, we have to apply a correction. To estimate the importance of the AGN emission at 22µm we proceed as follows.
Jet contribution. We estimate the contribution from the jet starting from the radio flux density measured at 1.4 GHz, assuming the average value of the observed in the blazars (FSRQ) of the BZCAT catalogue (=0.27, see Fig. 6) and subtract it from the observed flux density at 22 (rest-frame). For the 2 objects that have 0.27 the estimate of 22 due to the galaxy is not possible and we exclude them from the analysis. For the sources with radio-to-mid-IR flux ratios similar to those observed in IR galaxies (-0.25), the correction for the jet emission is negligible (1%) and has no impact on the final results. As discussed in the previous section, in these sources even the radio emission could be mainly (or totally) attributed to the star-formation activity.
Torus contribution. We estimate the contribution from the torus using the flux densities at 4.6 (rest frame888For the K-correction we use here, for each source, the observed slope computed between 3.4 and 4.6 µm.) and assuming that this is entirely produced by the AGN (jet and torus). This is a reasonable assumption since, as discussed in the previous sections, in the W1 and W2 filters we are probably preferentially observing the AGN emission (see also the average SEDs of Fig. 5). This is also consistent with what has been recently found by Mateos et al. (2015) studying the mid-IR properties of a sample of X-ray selected AGN. If also the host galaxy is contributing to the 4.6µm emission then the final estimate of the 22µm emission from the host galaxy, and hence of the SFR, would be even higher. As for the 22µm flux density, also the 4.6µm flux density has been corrected for the jet contribution, using the average 1.4 GHz-to-4.6µm spectral index observed in the FSRQ of the BZCAT (=0.43). Using the resulting flux density and the slope between 4.6 and 22µm measured on the QSO1 template from SWIRE (=1.1), we can then estimate the contribution of the torus at 22 and subtract also this component from the observed flux density.
We find that the average contribution from the torus at 22µm is more important (40%) than that from the jet (7%). In order to take into account the uncertainties related to the initial assumption on the of the jet and the IR slope of the torus, we have repeated these computations with different input values: =0.15 and 0.39 (i.e. the 1 interval observed in the FSRQ of the BZCAT) and =1.0-1.1, for the infrared slope of the torus, corresponding to the extreme values measured in the 3 QSO1 template of SWIRE (TQSO1, BQSO1 and QSO1). We take the extreme values obtained in all these combinations as the uncertainty interval of the 22µm luminosity from the host galaxy. The computed 22µm luminosities of the host galaxies range from 1010 to 51011L☉.
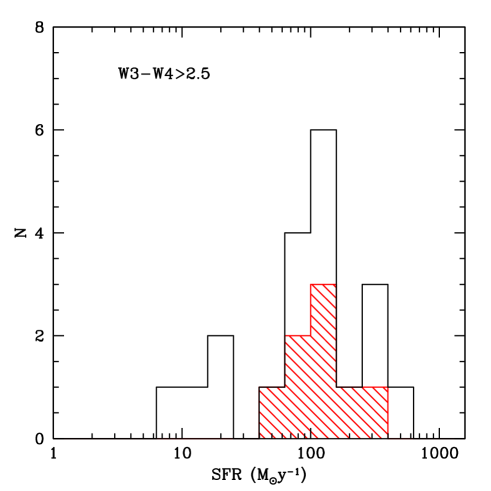
We then use the 22 luminosity corrected for the AGN contribution to estimate the SFR using the relation presented in Rieke et al. (2009), their eq.10 and eq.11, and assuming LL22µm. The results are reported in Tab. 5 and plotted in Fig. 7. The SFR of these 20 objects are above 10 y-1 and, in several cases, larger than 100 y-1, similarly to what is usually observed in Luminous Infrared Galaxies (LIRG) or even in Ultraluminous Infrared Galaxies (ULIRG, Sanders & Mirabel 1996). This result confirms and quantifies what we have inferred from the analysis of the mid-IR colours, i.e. the presence of an intense star-forming activity in at least half of the RL NLS1 in sample.
We finally note that a SFR estimate for the RL NLS1 with W3-W42.5 would not be reliable since the evidence of a significant contribution of a star-forming host galaxy to the emission at 22µm is not clear. Running the analysis described above on the blue objects, we find that, on average, only a small fraction (8%) of the observed 22 luminosities can be due to the host galaxy the remaining fraction being produced by the torus (56%) and by the jet (36%). The estimate of the 22µm luminosity due to the host galaxy (and therefore the SFR quantification) depends too critically on the starting assumptions on the of the jet and on the IR spectral shape of the dusty torus to give reliable results. The only stable quantities that we can derive are the upper limits on the SFR based on the total observed 22µm luminosities. These values do not exclude the presence of an intense SFR ( 10 y-1) also in the objects with W3-W42.5. From these upper limits alone it is not possible to understand whether the host galaxies of these AGN are intrinsically different from those observed in “red” RL NLS1 or, rather, their SF activity is simply hidden by a particularly strong nuclear light. We have, however, other pieces of information that can help to distinguish between these two hypotheses.
In Fig. 5 we have presented the average SEDs of red (W3-W42.5) and blue (W3-W42.3) objects, that clearly show different shapes at 10µm. While the average SED of the red objects requires the presence of an M82-like template to be correctly reproduced, the average SED of the blue objects can be modelled using an Sc or Ell5 template. An M82 template would over-predict the emission at 10µm. We note that the normalization of the host galaxy template is quite well constrained in the spectral region around 1µm (rest-frame). This suggests that the blue objects are hosted, on average, by different types of host galaxy.
In order to assess whether there are differences also in the luminosites of the AGN (either the radio-quiet or the jet component) between red and blue objects we can compare the average luminosities at 4µm, where the torus emission is expected to dominate, and in the radio band. At 4µm the average values are only marginally different, with the blue objects being about 30% more luminous than the red ones. Even in the radio band we do not have evidence that the jets in the blue objects are more luminous than the jets present in the red sources. Rather, the average 1.4 GHz power of blue objects is a factor 1.6 fainter than in red objects. The average 22µm luminosity, instead, is significantly different bewteeen the two groups of sources, where the red objects are almost a factor 2 more luminous that the blue sources.
Overall, these numbers seem to indicate that the lack of a clear detection of the host galaxy in the blue objects is not due to a more luminous radio jet and/or AGN (radio-quiet) but, rather, to a less luminous 22µm emission, i.e. a less important star-forming component at work in these sources. As explained above, the upper limits on the SFR are in any case large so we cannot exclude the presence of an intense SF also in these sources but, on average, their activity, if present, seems to be less intense than the one observed in the host galaxies of the red RL NLS1. This picture needs a confirmation through an accurate follow-up (in particular of the blue RL NLS1) in the mid-IR or in the far-IR spectral region, where the maximum output of the SF activity is expected.
7 Conclusions
We have analysed the mid-IR colours of a sample of 42 RL NLS1 using WISE data with the aim of quantifying, for the first time, the star-forming activity in the galaxies hosting this class of AGNs. The sources cover the redshift interval from 0.06 to 0.92. Thirty-seven objects are detected in all the 4 WISE bands. In order to understand the origin of the mid-IR emission in these sources we have compared their positions on different diagnostic plots with those expected from a combination of AGN and host galaxy templates. The results can be summarized as follows:
-
•
In general, the RL NLS1 of the sample occupy a region in the W1-W2 vs W2-W3 plot (commonly used in the literature) that is typical of emission line AGN, both radio-quiet and radio-loud.
-
•
WISE colours can be reproduced by a combination of AGN and host galaxy emission, the relative importance of the two components depending strongly on the band under consideration. While the emission from 3.4 up to 12 (observed frame) of most (3/4) of the sources can be explained by the AGN alone (either the relativistic jet, the dusty torus or a combination of the two), at 22µm the emission usually requires the (red) contribution from the host galaxy.
-
•
Twenty-two sources show very red W3-W4 colours (2.5) that can be explained only by assuming the presence of a young and “active” host galaxy, i.e. a starburst galaxy similar to M82. In the remaining cases, the intensity of the AGN emission in the mid-IR bands does not allow to unambiguously assess the type of host galaxy.
-
•
The 22 luminosities of the NLS1 detected in W4 are typically above 1011 L☉. We have used these luminosities, corrected for the AGN contribution, to estimate the SFR for 20 out of the 22 sources with W3-W42.5. The computed values of SFR range between 10 and 500 M☉ y-1. These values are similar to those observed in LIRG or even in ULIRG (Sanders & Mirabel 1996). For the sources with W3-W42.5 the presence of a star-forming host galaxy cannot be excluded although the SFR is expected to be, on average, lower than in red sources.
-
•
Although the sample studied here has been designed to include NLS1 with a relativistic jet (possibly pointing towards Earth), by means of a selection of sources with a large radio-loudness parameter (radio-loudness parameter 10) and, preferentially, a flat radio spectrum (0.5, see Foschini et al. 2015 for details), our analysis shows that in the mid-IR the jet is not necessarily the dominant component, even in sources that have been detected in gamma-rays by FERMI. In particular, we have estimated that, on average, at 22µm only 20% of the luminosity of the sources with W3-W42.5 comes from the jet, the remaining part being emitted by the dusty torus and by the host galaxy.
-
•
Even at radio frequencies (1.4 GHz) the emission of a number (10) of sources in the sample, i.e. those with high mid-IR-to-radio luminosity ratios, is not necessarily due to the jet but it is likely produced, in part or entirely, by the SF activity.
In conclusion, our analysis has shown that RL NLS1 are often associated to “active” host galaxies, with SFR in the typical range of LIRG/ULIRG sources. Therefore, from this point of view, RL NLS1 are more similar to RQ NLS1 than to radio-loud AGNs with broader emission lines, usually hosted by “passive” elliptical galaxies. These results support the idea that NLS1, both RQ and RL, are systems in the early phase of their evolution, when the host galaxy is experiencing a high level of star-forming activity and, at the same time, the central super-massive BH is rapidly accreting and building up mass. Studying the properties of these sources and their differences with respect to the other radio-loud AGNs will help us to understand the role of relativistic jets in the AGN/galaxy evolution and to unveil any possible form of feedback (either positive or negative). To this end, simultaneous follow-ups, both in the mid-IR and in the radio, are mandatory in order to accurately disentangle the different components at work in these active nuclei and to study their possible interplay.
Acknowledgments
We thank the referee for useful comments that improved the paper. This publication makes use of data products from the Wide-field Infrared Survey Explorer, which is a joint project of the University of California, Los Angeles, and the Jet Propulsion Laboratory/California Institute of Technology, funded by the National Aeronautics and Space Administration. Part of this work was supported by the COST Action MP0905 “Black Holes in a Violent Universe” and by the European Commission Seventh Framework Programme (FP7/2007-2013) under grant agreement no. 267251 Astronomy Fellowships in Italy (AstroFIt). The authors acknowledge financial support from the Italian Ministry of Education, Universities and Research (PRIN2010-2011, grant n. 2010NHBSBE). Support from the Italian Space Agency is acknowledged by LB (contract ASI INAF NuSTAR I/037/12/0). SM acknowledges funding from the Spanish Ministry of Economy and Competitiveness under grant AYA2012-31447, which is partly funded by the FEDER programme. SM acknowledges financial support from the ARCHES project (7th Framework of the European Union, no. 313146).
References
- Ahn et al. (2012) Ahn C. P. et al., 2012, ApJS, 203, 21
- Angelakis et al. (2015) Angelakis E. et al., 2015, A&A, 575, 55
- Antón, Browne & Marchã (2008) Antón S., Browne I. W. A., Marchã M. J., 2008, A&A, 490, 583
- Ballo et al. (2014) Ballo L., Severgnini P., Della Ceca R., Caccianiga A., Vignali C., Carrera F. J., Corral A., Mateos S., 2014, MNRAS, 444, 2580
- Buat et al. (2002) Buat V., Boselli A., Gavazzi G., Bonfanti C., 2002, A&A, 383, 801
- Caccianiga et al. (2014) Caccianiga A. et al., 2014, MNRAS, 441, 172
- Caccianiga et al. (2008) Caccianiga A. et al., 2008, A&A, 477, 735
- Castignani & De Zotti (2015) Castignani G., De Zotti G., 2015, A&A, 573, 125
- Cutri et al. (2003) Cutri R. M. et al., 2003, ”The IRSA 2MASS All-Sky Point Source Catalog”, NASA/IPAC
- Deo, Crenshaw & Kraemer (2006) Deo R. P., Crenshaw D. M., Kraemer S. B., 2006, AJ, 132, 321
- Doi et al. (2012) Doi A., Nagira H., Kawakatu N., Kino M., Nagai H., Asada K., 2012, ApJ, 760, 41
- Domínguez et al. (2013) Domínguez A. et al., 2013, ApJ, 763, 145
- Foschini (2011) Foschini L., 2011, in: Narrow-Line Seyfert 1 Galaxies and Their Place in the Universe, eds L. Foschini, M. Colpi, L. Gallo, D. Grupe, S. Komossa, K. Leighly, & S. Mathur. Proceedings of Science (Trieste, Italy), vol. NLS1, id. 24
- Foschini et al. (2015) Foschini L. et al., 2015, A&A, 575, A13
- Frey et al. (2012) Frey S., Gurvits L. I., Paragi Z., Gabanyi K., 2012, in: ”Resolving The Sky - Radio Interferometry: Past, Present and Future”. Proceedings of Science (Trieste, Italy), vol. RTS2012, id. 41
- Frey et al. (2011) Frey S., Paragi Z., Gurvits L. I., Gabányi K. E., Cseh D., 2011, A&A, 531, L5
- Gallo et al. (2006) Gallo L. C. et al., 2006, MNRAS, 370, 245
- Gurkan, Hardcastle & Jarvis (2014) Gurkan G., Hardcastle M. J., Jarvis M. J., 2014, MNRAS, 438, 1149
- Heckman & Best (2014) Heckman T. M., Best P. N., 2014, ARA&A, 52, 75
- Jiang et al. (2012) Jiang N. et al., 2012, ApJ, 759, L31
- Komossa et al. (2006) Komossa S., Voges W., Xu D., Mathur S., Adorf H.-M., Lemson G., Duschl W. J., Grupe D., 2006, AJ, 132, 531
- León-Tavares et al. (2014) León-Tavares J. et al., 2014, ApJ, 795, 58
- Malmrose et al. (2011) Malmrose M. P., Marscher A. P., Jorstad S. G., Nikutta R., Elitzur M., 2011, MNRAS, 732, 116
- Massaro et al. (2009) Massaro E., Giommi P., Leto C., Marchegiani P., Maselli A., Perri M., Piranomonte S., Sclavi S., 2009, A&A, 495, 691
- Massaro et al. (2012) Massaro F., D’Abrusco R., Tosti G., Ajello M., Gasparrini D., Grindlay J. E., Smith H. A., 2012, ApJ, 750, 138
- Mateos et al. (2013) Mateos S., Alonso-Herrero A., Carrera F., Blain A., Severgnini P., Caccianiga A., Ruiz A., 2013, MNRAS, 434, 941
- Mateos et al. (2012) Mateos S. et al., 2012, MNRAS, 426, 3271
- Mateos et al. (2015) Mateos S. et al., 2015, MNRAS, 449, 1422
- Mathur (2000) Mathur S., 2000, MNRAS, 314, L17
- Monet et al. (2003) Monet D. G. et al., 2003, AJ, 125, 984
- Moran (2000) Moran E. C., 2000, New Astronomy Reviews, 44, 527
- Orban de Xivry et al. (2011) Orban de Xivry G., Davies R., Schartmann M., Komossa S., Marconi A., Hicks E., Engel H., Tacconi L., 2011, MNRAS, 417, 2721
- Oshlack, Webster & Whiting (2001) Oshlack A. Y. K. N., Webster R. L., Whiting M. T., 2001, ApJ, 558, 578
- Polletta et al. (2007) Polletta M. et al., 2007, ApJ, 663, 81
- Raiteri et al. (2014) Raiteri C. M. et al., 2014, MNRAS, 442, 629
- Richards & Lister (2015) Richards J. L., Lister M. L., 2015, ApJ, 800, L8
- Rieke et al. (2009) Rieke G. H., Alonso-Herrero A., Weiner B. J., Pérez-González P. G., Blaylock M., Donley J. L., Marcillac D., 2009, ApJ, 692, 556
- Sanders & Mirabel (1996) Sanders D. B., Mirabel I. F., 1996, ARA&A, 34, 749
- Sani et al. (2012) Sani E. et al., 2012, MNRAS, 424, 1963
- Sani et al. (2010) Sani E., Lutz D., Risaliti G., Netzer H., Gallo L. C., Trakhtenbrot B., Sturm E., Boller T., 2010, MNRAS, 403, 1246
- Stern et al. (2012) Stern D. et al., 2012, ApJ, 753, 30
- Wright et al. (2010) Wright E. L. et al., 2010, AJ, 140, 1868
- Yuan et al. (2008) Yuan W., Zhou H. Y., Komossa S., Dong X. B., Wang T. G., Lu H. L., Bai J. M., 2008, ApJ, 685, 801
- Zhou et al. (2007) Zhou H. et al., 2007, ApJ, 658, L13