GALAXY EVOLUTION
Isolated compact elliptical galaxies: Stellar systems that ran away
Compact elliptical galaxies form a rare class of stellar system (30 presently known) characterized by high stellar densities and small sizes and often harboring metal-rich stars. They were thought to form through tidal stripping of massive progenitors until two isolated objects were discovered where massive galaxies performing the stripping could not be identified. By mining astronomical survey data, we have now found 195 compact elliptical galaxies in all types of environment. They all share similar dynamical and stellar population properties. Dynamical analysis for non-isolated galaxies demonstrates the feasibility of their ejection from host clusters and groups by three-body encounters, which is in agreement with numerical simulations. Hence, isolated compact elliptical and quiescent dwarf galaxies are tidally stripped systems that ran away from their hosts.
G alaxies are thought to form through the hierarchical merging of smaller building blocks into larger systems (?, ?) and the history of these interactions is imprinted in their observable properties. Some galaxies such as ultra-compact dwarfs (?) and compact ellipticals (cEs) (?, ?, ?, ?), show evidence of strong tidal interactions with massive neighboring galaxies (?) that stripped most of the stars from the compact galaxies’ progenitors. cEs are rare galaxies with high stellar densities that resemble centers of giant ellipticals but have masses that are about two orders of magnitude smaller [ solar mass ()]. They are found mostly in the cores of galaxy clusters next to massive central galaxies, which is in alignment with the above hypothesis for their evolution.
The recent discoveries of isolated cE galaxies (?, ?) that do not belong to any galaxy cluster or group raised another round of debate about cE formation: whether they all formed through the tidal stripping or through a different mechanism of formation such as mergers of dwarf galaxies with specific morphologies and configurations (?). Dwarf–dwarf galaxy mergers do happen in vicinities of massive galaixes (?, ?). However, neither have they been observed in low–density environments, nor any of the remnants resemble properties of cE galaxies. The existence of a substantial number of isolated cEs will hence imply notably higher dwarf–dwarf merger rates than predicted by numerical simulations (?) and challenge the currently accepted hierarchical structure formation paradigm.
We demonstrated that all known cE galaxies are outliers from the universal optical–ultraviolet color–color–magnitude relation of 1Smithsonian Astrophysical Observatory, 60 Garden Street MS09, Cambridge, MA 02138, USA.2Sternberg Astronomical Institute, Moscow State University, 13 Universitetsky prospect, Moscow, 119992, Russia.3L’Institut de Recherche en Astrophysique et Planétologie, 9, Avenue du Colonel Roche BP 44346, 31028, Toulouse Cedex 4, France. ∗Corresponding author. E-mail: igor.chilingarian@cfa.harvard.edu
galaxies (?). We could therefore perform a search for cE galaxies not only in the centers of rich clusters and groups as has been done before (?), but across all environments using data from wide-field imaging surveys, the optical ground based Sloan Digital Sky Survey [SDSS, (?)] and the ultra-violet all-sky survey carried out by the GALaxy Evolution eXplorer [GALEX, (?)] spacecraft, which are all publicly available in the Virtual Observatory.
First, we created an initial list of candidates (supplementary materials) from the sample of galaxies having spectra in the SDSS and, hence, known distances, by selecting outliers above 0.035 mag in the optical color from the universal relation (?). We chose low luminosity galaxies [ solar luminosity or absolute magnitude mag] that had small half-light radii ( kpc) or were spatially unresolved in SDSS images; did not show substantial ellipticity, which was essential for removing edge-on spiral galaxies; had the redshifts in the range of (distances between 30 and 340 Mpc); and either possessed red near-ultraviolet colors [ mag] or remained undetected in the band. We constrained by color and also removed objects that have emission lines in their spectra in order to exclude any objects with recent or ongoing star formation.
We then fitted their SDSS spectra against a grid of stellar population models using the “NBursts” code (?) and obtained mean ages, metallicities, and velocity dispersions of their stars. We rejected candidates with stellar ages younger than 4 billion years and introduced an additional constraint based on stellar velocity dispersions ( km/s). Stellar systems in equilibrium that are dynamically supported by random motions of stars, as most elliptical galaxies are have their dynamical masses (), half-mass radii (), and global velocity dispersions () connected by the simple virial relation: (?, ?). Therefore, for a galaxy with known velocity dispersion and a stellar mass () derived from its luminosity and stellar population parameters, we can estimate the lower limit for the half-light radius (if a galaxy contains dark matter, its real half-light radius will be larger because ). Hence, we can firmly reject physically extended objects such as “normal” dwarf elliptical galaxies that are unresolved in SDSS images because of their large distances by selecting only objects with high velocity dispersions.
In this fashion, we constructed a sample of 195 galaxies (Fig. 1 and supplementary materials). We then cross-matched this list against the SDSS Galaxy Groups catalog (?) and established their group/cluster membership. For seven objects without counterparts in the Galaxy Groups catalog, we identified possible host galaxies (in most cases, group centers) located between 750 kpc and 3.3 Mpc in projection. Because some bright and extended galaxies were missing from the SDSS spectroscopic sample, and therefore also from the Galaxy Groups catalogue, we used NASA/Infrared Processing and Analysis Center (IPAC) Extragalactic Database (NED) for the identification of host galaxies for 45 cEs. Our final sample contains 56 galaxies in clusters, 128 in groups, and 11 isolated or field cE galaxies. Eight galaxies (supplementary materials) exhibit prominent tidal streams similar to the two known cEs (?).
Ages and metallicities (Fig. 2 and supplementary materials), colors and luminosities of 11 isolated cE galaxies do not show a statistically significant difference from those of galaxies being members of clusters and groups. The Kolmogorov-Smirnov (KS) probabilities of these properties for isolated and non-isolated subsamples to be derived from the same underlying distribution range from 30 (for luminosities) to 80% (metallicities). Our cE sample does not show any correlation between the metallicity and the stellar mass conversely to normal elliptical galaxies, which exhibit a rather tight mass–metallicity relation (Fig. 2).
For rich groups and clusters hosting cE galaxies, we built caustic diagrams (?, ?, ?) that present differences of radial velocities of cluster members from the cluster center versus projected distances. A galaxy position on such a diagram reflects its dynamical status: objects sitting deep inside the cluster potential well are located inside the distribution whereas galaxies near the edges are barely gravitationally bound to the host cluster or infalling on to it for the first time.
[]![[Uncaptioned image]](/html/1504.06990/assets/x1.png) \@endfloatbox
\@endfloatbox
We constructed an ensemble cluster by normalizing individual cluster and group data by their velocity dispersions and sizes for 33 structures from our sample each of which included over 20 member galaxies (?, ?). Then we computed its caustic diagram in order to visualize the phase space pattern of the infalling galaxy population and overplotted our cE galaxies on it (Fig. 3). The cE population strongly differs from other cluster members. The KS tests for projected distance and radial velocity distributions reject the hypothesis of cE and cluster member samples being derived from the same parent population at the 97 and 98% levels. Numerical simulations of tidal stripping (?, ?) suggest that a progenitor galaxy, even if it approaches a cluster center on a very extended radial orbit, will lose a major fraction of its orbital energy because of dynamical friction, become gravitationally locked in the inner region of a cluster on a tightly bound orbit, and will finally be accreted by the host galaxy after a few billion years. Many cEs from our sample exhibit this behaviour (Fig. 3 and supplementary materials). However, we see a number of cE galaxies close to the edges of the caustics suggesting that they are barely gravitationally bound to the cluster potential because they do not belong to the infalling population as we demonstrated. This looks completely unrealistic in the case of a one-to-one galaxy encounter resulting in tidal stripping, but in the case of a three- or multiple-body encounter this situation becomes significantly more likely.
An interaction of binary stars with the cen-
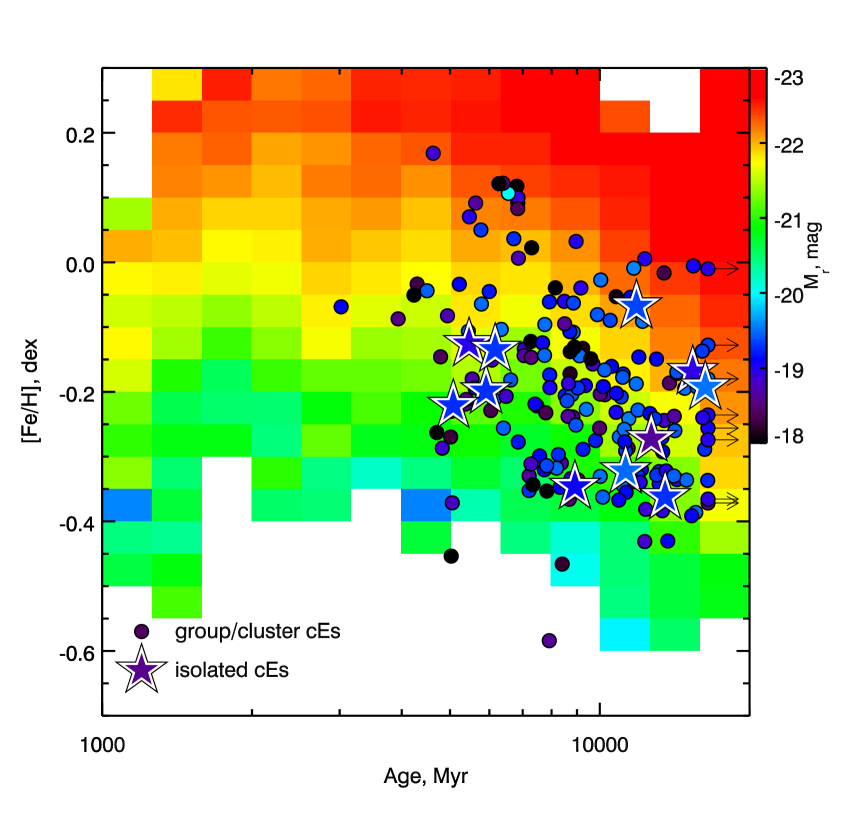 Fig. 2: Comparison of stellar population properties of
isolated and nonisolated compact elliptical galaxies to a reference
sample of elliptical galaxies from the SDSS. Mean
stellar ages and metallicities of cE galaxies hosted
by groups and clusters (round symbols) and isolated cEs (stars) were
determined from the modeling of their SDSS spectra by using the
“NBursts” full spectrum
fitting. The plotting symbols
are color coded
according to the -band absolute magnitudes derived from
the SDSS photometry. We also computed ages and metallicities for a reference
sample of 82500 elliptical galaxies from SDSS DR7 in the same fashion along
with the median -band absolute magnitude for every bin of age–metallicity
parameter space. These magnitudes are shown as a background map, with the
colors on the same scale as cE galaxies. This figure demonstrates
that: (i) stellar populations of isolated and group/cluster cEs do not
differ statistically and (ii) cEs are on average much fainter than are normal
elliptical galaxies of the same stellar age/metallicity.
Fig. 2: Comparison of stellar population properties of
isolated and nonisolated compact elliptical galaxies to a reference
sample of elliptical galaxies from the SDSS. Mean
stellar ages and metallicities of cE galaxies hosted
by groups and clusters (round symbols) and isolated cEs (stars) were
determined from the modeling of their SDSS spectra by using the
“NBursts” full spectrum
fitting. The plotting symbols
are color coded
according to the -band absolute magnitudes derived from
the SDSS photometry. We also computed ages and metallicities for a reference
sample of 82500 elliptical galaxies from SDSS DR7 in the same fashion along
with the median -band absolute magnitude for every bin of age–metallicity
parameter space. These magnitudes are shown as a background map, with the
colors on the same scale as cE galaxies. This figure demonstrates
that: (i) stellar populations of isolated and group/cluster cEs do not
differ statistically and (ii) cEs are on average much fainter than are normal
elliptical galaxies of the same stellar age/metallicity.
tral supermassive black hole is one accepted scenario for the creation of hypervelocity stars (?) in our Galaxy: One of the binary components is ejected, whereas the other one falls on-to the black hole. Numerical simulations
suggest (?) that three-body encounters are responsible for putting Milky Way satellites on extreme orbits going as far as 3 Mpc away. Even though typical galaxy clusters have much wider and deeper potential wells than that of the Local Group, three- and even multiple-body encounters must happen much more frequently in those dense environments. Therefore a certain probability exists that some of them will lead to the gravitational ejection of galaxies participating in the interaction to extreme radial orbits with the apocentric distances of a few megaparsecs (?). A three-body encounter that might eject a cE galaxy from its host cluster or group does not have to happen during the cE formation through tidal stripping, that is two galaxies do not have to fall on-to the cluster/group center at the same time. When a cE progenitor is tidally stripped, it quickly settles on a tightly-bound rapidly decaying orbit (?) and if another galaxy infalls later, but before a newly formed cE has been accreted (hundreds of millions to a couple of billion years), the three-body encounter becomes possible.
We estimate the probability of a close three-body encounter geometrically. Numerical simulations suggest (?) that over a typical cE lifetime of 2 billion years (?), an average brightest cluster galaxy (BCG) must have experienced three of four mergers with massive () galaxies. We assume that: (i) a typical cE resides on a quasicircular orbit within 120 kpc from a host BCG galaxy after correction for projection effects (fig. S4), (ii) galaxies infall on a BCG on radial orbits from random directions, and (iii) a three-body encounter will be sufficiently close if a cE passes within kpc from a massive infalling galaxy. Hence, the probability is as a volume ratio of a cylinder of radius , height and a sphere of radius , , or 6 to 8% for three of four merger events.
In our sample of cluster and group cE galaxies, we indeed see numerous examples in which a cE resides only 20 to 80 kpc in projection from an ongoing major merger scene or several other massive cluster members are visible in the cE vicinity apart from the massive central cluster/group galaxy. Also, there is a known example of a globular cluster in the Virgo cluster (?) that was likely ejected at the speed of 2500 km/s and became gravitationally unbound to the cluster and its central galaxy Messier 87.
We conclude that the tidal stripping process can explain all observational
manifestations of compact elliptical galaxies, including the formation of
isolated cEs whose existence was suggested as a strong counter-argument for
tidal stripping (?). The ejection of cEs from central regions of
galaxy clusters by three-body encounters is a channel for these galaxies to
survive for an extended period of time in the violent cluster environment
where they would otherwise be accreted by massive hosts on a timescale of 2
billion to 3 billion years.
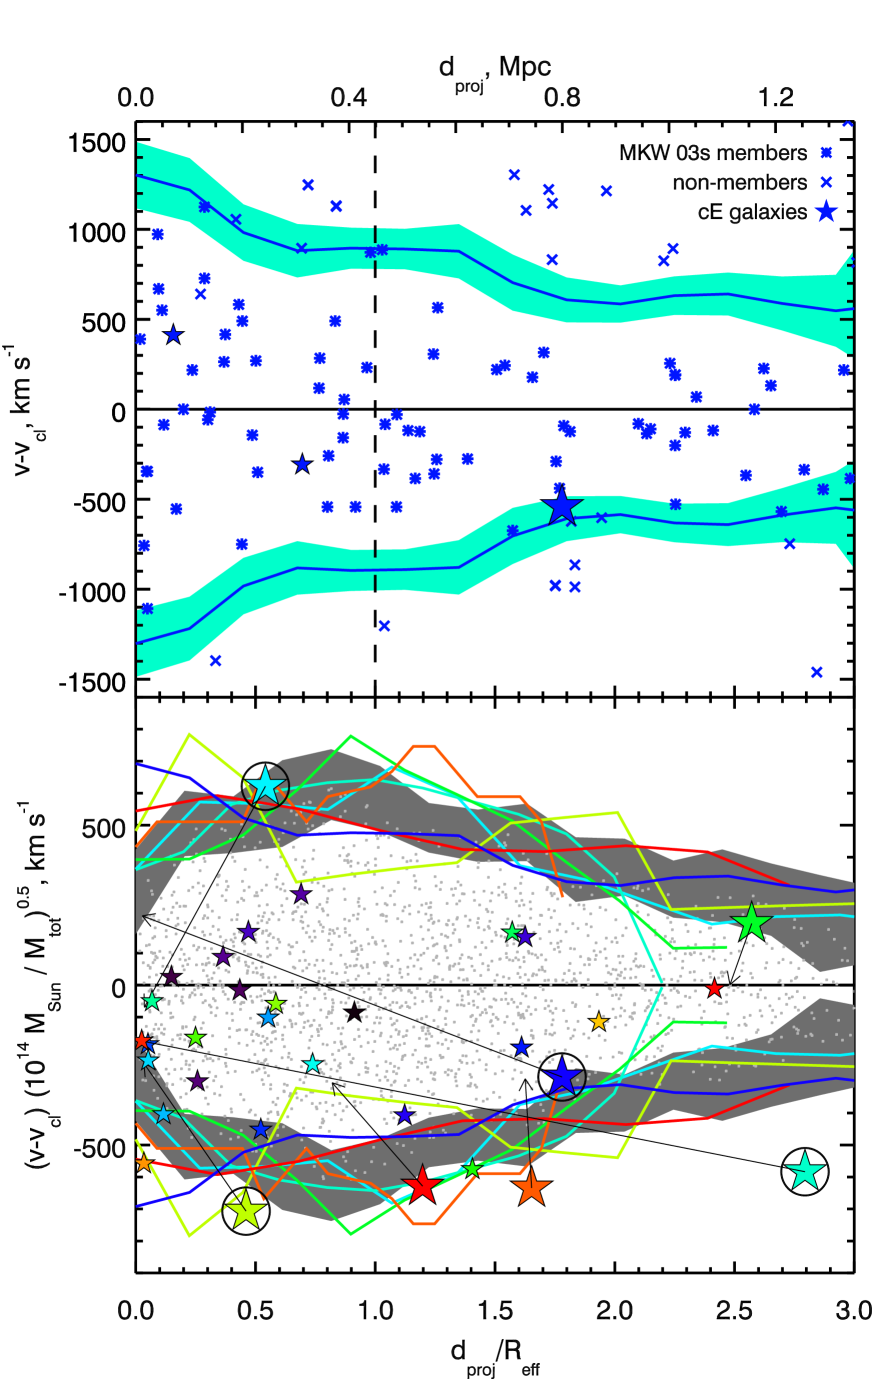 Fig. 3: Positions of cE galaxies identified on caustic diagrams in
galaxy clusters and rich groups with more than 20 members in the SDSS.
(Top) An example of a caustic diagram showing projected distances and
radial velocity differences of the members of the cluster MKW 03s that
includes cE galaxies shown as stars. The derived caustics shown as solid
blue lines roughly correspond to the escape velocity for a galaxy at a given
distance from the cluster center. Shaded areas show statistical
uncertainties of the caustic line computation.
(Bottom) The
caustic lines for an ensemble cluster of 2,592 individual members are shown
as gray shaded areas and light gray dots, respectively. The caustic lines
normalized by
corresponding velocity dispersions and half-mass radii
() are shown for six individual clusters as colored solid
lines. Small stars denote cEs located deeply inside the potential wells of
these six clusters, and large stars (with same colors as caustic lines)
indicate cEs that have projected radial velocities of at least 85% of the caustic
amplitude. Vectors point to the location of identified host galaxies for
corresponding cEs. Three of them are different than the cluster central
galaxies indicating that these cEs belong to subgroups inside clusters and
that the caustic diagnostic is irrelevant for them. However, the four circled
cEs are examples of galaxies barely gravitationally bound to their host
clusters.
Fig. 3: Positions of cE galaxies identified on caustic diagrams in
galaxy clusters and rich groups with more than 20 members in the SDSS.
(Top) An example of a caustic diagram showing projected distances and
radial velocity differences of the members of the cluster MKW 03s that
includes cE galaxies shown as stars. The derived caustics shown as solid
blue lines roughly correspond to the escape velocity for a galaxy at a given
distance from the cluster center. Shaded areas show statistical
uncertainties of the caustic line computation.
(Bottom) The
caustic lines for an ensemble cluster of 2,592 individual members are shown
as gray shaded areas and light gray dots, respectively. The caustic lines
normalized by
corresponding velocity dispersions and half-mass radii
() are shown for six individual clusters as colored solid
lines. Small stars denote cEs located deeply inside the potential wells of
these six clusters, and large stars (with same colors as caustic lines)
indicate cEs that have projected radial velocities of at least 85% of the caustic
amplitude. Vectors point to the location of identified host galaxies for
corresponding cEs. Three of them are different than the cluster central
galaxies indicating that these cEs belong to subgroups inside clusters and
that the caustic diagnostic is irrelevant for them. However, the four circled
cEs are examples of galaxies barely gravitationally bound to their host
clusters.
The 11 isolated cEs probably represent a population of runaway galaxies that received sufficient kick velocities to leave their host clusters or groups forever.
The gravitational ejection mechanism may also explain the very existance of extremely
rare isolated quiescent dwarf galaxies (?), where the star formation quenching is usually explained by environmental effects. These systems are more spatially extended than cEs and do not exhibit substantial tidal stripping footprints. This suggests that they never came very close to cluster/group centers and therefore, the three-body encounter probability for them should be lower than that for cEs although still nonnegligible.
REFERENCES AND NOTES
- 1. S. D. M. White, C. S. Frenk, Astrophys. J. 379, 52 (1991).
- 2. S. Cole, C. G. Lacey, C. M. Baugh, C. S. Frenk, Mon. Not. R. Astron. Soc. 319, 168 (2000).
- 3. M. J. Drinkwater, et al., Nature 423, 519 (2003).
- 4. J. Price, et al., Mon. Not. R. Astron. Soc. 397, 1816 (2009).
- 5. I. Chilingarian, et al., Science 326, 1379 (2009).
- 6. I. V. Chilingarian, G. Bergond, Mon. Not. R. Astron. Soc. 405, L11 (2010).
- 7. M. A. Norris, et al., Mon. Not. R. Astron. Soc. 443, 1151 (2014).
- 8. A. P. Huxor, S. Phillipps, J. Price, R. Harniman, Mon. Not. R. Astron. Soc. 414, 3557 (2011).
- 9. A. P. Huxor, S. Phillipps, J. Price, Mon. Not. R. Astron. Soc. 430, 1956 (2013).
- 10. S. Paudel, T. Lisker, K. S. A. Hansson, A. P. Huxor, Mon. Not. R. Astron. Soc. 443, 446 (2014).
- 11. R. M. Rich, et al., Nature 482, 192 (2012).
- 12. N. C. Amorisco, N. W. Evans, G. van de Ven, Nature 507, 335 (2014).
- 13. O. Fakhouri, C.-P. Ma, M. Boylan-Kolchin, Mon. Not. R. Astron. Soc. 406, 2267 (2010).
- 14. I. V. Chilingarian, I. Y. Zolotukhin, Mon. Not. R. Astron. Soc. 419, 1727 (2012).
- 15. K. N. Abazajian, et al., Astrophys. J. Suppl. Ser. 182, 543 (2009).
- 16. D. C. Martin, et al., Astrophys. J. 619, L1 (2005).
- 17. I. Chilingarian, P. Prugniel, O. Sil’chenko, M. Koleva, Stellar Populations as Building Blocks of Galaxies, A. Vazdekis, R. R. Peletier, eds. (Cambridge University Press, Cambridge, UK, 2007), vol. 241 of IAU Symposium, pp. 175–176, arXiv:0709.3047.
- 18. L. Spitzer, Astrophys. J. 158, L139 (1969).
- 19. L. Hernquist, Astrophys. J. 356, 359 (1990).
- 20. E. Tempel, E. Tago, L. J. Liivamägi, Astron. Astrophys. 540, A106 (2012).
- 21. N. Kaiser, Mon. Not. R. Astron. Soc. 227, 1 (1987).
- 22. A. Diaferio, M. J. Geller, Astrophys. J. 481, 633 (1997).
- 23. A. Diaferio, Mon. Not. R. Astron. Soc. 309, 610 (1999).
- 24. R. G. Carlberg, H. K. C. Yee, E. Ellingson, Astrophys. J. 478, 462 (1997).
- 25. A. Biviano, M. Girardi, Astrophys. J. 585, 205 (2003).
- 26. J. Pfeffer, H. Baumgardt, Mon. Not. R. Astron. Soc. 433, 1997 (2013).
- 27. W. R. Brown, M. J. Geller, S. J. Kenyon, M. J. Kurtz, Astrophys. J. 622, L33 (2005).
- 28. L. V. Sales, J. F. Navarro, M. G. Abadi, M. Steinmetz, Mon. Not. R. Astron. Soc. 379, 1475 (2007).
- 29. A. R. Wetzel, J. L. Tinker, C. Conroy, F. C. v. d. Bosch, Mon. Not. R. Astron. Soc. 439, 2687 (2014).
- 30. G. De Lucia, J. Blaizot, Mon. Not. R. Astron. Soc. 375, 2 (2007).
- 31. N. Caldwell, et al., Astrophys. J. 787, L11 (2014).
- 32. M. Geha, M. R. Blanton, R. Yan, J. L. Tinker, Astrophys. J. 757, 85 (2012).
ACKNOWLEDGMENTS
The authors are greatful to F. Combes (Observatoire de Paris), I. Katkov (Sternberg Astronomical Institute), and M. Kurtz (Smithsonian Astrophysical Observatory) for useful discussions and critical reading of the manuscript. This result emerged from the tutorial run by the authors at the Astronomical Data Analysis Software and Systems conference in 2012. The authors acknowledge support by the Russian Science Foundation project 14-22-00041 “VOLGA – A View On the Life of GAlaxies” . The project used computational resourses funded by the M.V.Lomonosov Moscow State University Program of Development. This research has made use of Aladin developed by the Centre de Données Astronomiques de Strasbourg; TOPCAT and STILTS software packages developed by M.Taylor; “exploresdss” script by G. Mamon; the VizieR catalogue access tool, CDS, Strasbourg, France; and the NASA/IPAC NED which is operated by the Jet Propulsion Laboratory, California Institute of Technology, under contract with the NASA. Funding for the SDSS and SDSS-II has been provided by the Alfred P. Sloan Foundation, the Participating Institutions, the National Science Foundation, the U.S. Department of Energy, NASA, the Japanese Monbukagakusho, the Max Planck Society, and the Higher Education Funding Council for England. The SDSS Web Site is http://www.sdss.org/. GALEX and SDSS databases used in our study are available via the CasJobs web-site http://skyserver.sdss.org/CasJobs.
SUPPLEMENTARY MATERIALS
http://www.sciencemag.org/content/348/6233/418/suppl/DC1
Materials and Methods
Supplementary Text
Figs. S1 to S4
Table S1
19 November 2014; accepted 20 March 2015
10.1126/science.aaa3344
SUPPLEMENTARY MATERIALS
S1 Input galaxy catalogue
As a starting point for the search of cE galaxy candidates, we compile the input galaxy catalogue. In order to do this, we use publicly available datasets, GALEX Data Release 6 (?), SDSS Data Release 7 (?) and UKIDSS Data Release 8 (?). Initially, from the SDSS DR7 spectral sample we select normal non-active galaxies with the redshift in the range . This list is cross-matched with the UKIDSS Large Area Survey catalogue using the best match criterion with the 3 arcsec radius. The SDSS–UKIDSS sample is then uploaded to the GALEX CasJobs service in order to look for best matches within 3 arcsec. As a result of this procedure, we obtain a catalogue of 429 707 galaxies with fully corrected UV-to-optical spectral energy distributions in 11 photometrical bands ( and from GALEX, from SDSS, and from UKIDSS) and spectra. Petrosian magnitudes are -corrected using analytical approximations (?). SDSS spectra are fitted with state-of-the-art stellar population models. This procedure yields ages and metallicities of their stars as well as stellar velocity dispersions which we add to the catalogue.
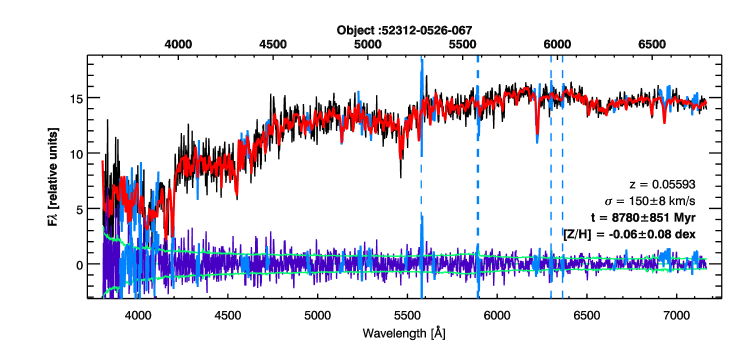
S2 Full spectral fitting
We use the “nbursts” full spectral fitting technique (?) with high-resolution () pegase.hr (?) simple stellar population (SSP) models computed using the Salpeter stellar initial mass function (?) in order to extract kinematics and stellar population properties from our spectra (see Fig. S1).
The fitting procedure comprises the following steps: (1) a grid of SSP spectra with a fixed set of ages (spaced logarithmically from 20 Myr to 18 Gyr) and metallicities (from 2.0 to 0.5 dex) is convolved with the wavelength-dependent instrumental response of SDSS provided along with every spectrum in the 6th fits extension; (2) a non-linear least square fitting against an observed spectrum is done for a template picked from the pre-convolved SSP grid interpolating on age (), and metallicity (), broadened with the line-of-sight velocity distribution (LOSVD) parametrized by and and multiplied pixel-by-pixel by an order Legendre polynomial (multiplicative continuum), resulting in parameters to be determined (we used for SDSS spectra).
The fitting procedure, the error analysis and degeneracies between kinematics and stellar population parameters have been throughly described (?). We analysed the systematics of stellar population parameters with respect to the -element enhancement (?), the sensitivity of different spectral features (?). The choice of the stellar initial mass function in the models is shown not to affect stellar metallicity estimates and only slightly affect stellar ages (?).
In order to precisely estimate velocity dispersion, we convolve the SSP grid with the spectral line spread function (LSF) of the spectrograph varying across the wavelength range. In SDSS DR9 spectra, the LSF shape is available in the 6th FITS extension of every data file. It was demonstrated (?) that for intermediate signal-to-noise spectra the stellar velocity dispersion can be estimated with 10% uncertainties down to 1/2 of the LSF width (expressed as Gaussian ). For SDSS this corresponds to km/s that is substantially below our velocity dispersion selection criterion ( km/s, see below).
S3 Selection of candidate compact elliptical galaxies
By placing known cE galaxies on the 3D optical-UV color–color–magnitude diagram we noticed that they occupy a distinct region in this parameter space (?). We, hence, use several approaches to define this region in order to make it suitable for a formal database query. They result in 5 samples of cE candidates extracted from the catalogue described above. Since the input data were generated by several sometimes imperfect data reduction pipelines, we have to visually inspect every candidate image in order to discard extended galaxies with bright nuclei, edge-on spiral galaxies and artefacts, which also satisfied our initial automated cE selection criteria.
We selected objects that have: (a) red optical colors, at least mag above the universal color–color–magnitude relation (?); (b) low luminosities [ or mag]; (c) small half-light radii [ kpc] or remain spatially unresolved in SDSS images; (d) no significant ellipticity; (e) the redshifts in the range [distances between 30 and 340 Megaparsecs]; (f) either possess red near-ultraviolet colors [ mag] or drop out of the band; (g) no significant emission lines in their spectra; (h) velocity dispersions km/s and stellar population ages Gyr.
In the next subsections we list the criteria that we used to build those samples.
S3.1 Initial sample
The initial sample included 108 galaxies that have mag, the absolute magnitude fainter than -18.7 mag, the 50 per cent Petrosian radius of smaller than 2 arcsec in the angular measure or below 0.7 kpc in the physical scale, a distance from the 3D surface (?) along the color axis greater than 0.035 mag, the stellar age older than 4 Gyr and the velocity dispersion above 60.0 km s-1, the latter two parameters derived from the SSP fitting.
Below we give the formal specification of this filter using subsets expressions from the topcat table processing software (?) with the column names from the catalogue. Note that gr_fit column is a 3D surface value in (, , ) coordinates.
(corrmag_NUV - corrmag_r - kcorr_NUV + kcorr_r) > 4.0 &&
(corrmag_g - kcorr_g - 25 - 5 * log10(luminosityDistance(z, 72.0, 0.3, 0.7))) > -18.7 &&
(petror50_r < 2.0 || petror50_r / 206.265 * luminosityDistance(z, 72.0, 0.3, 0.7) < 0.7) &&
(corrmag_g - corrmag_r - kcorr_g + kcorr_r - gr_fit) > 0.03 &&
age_ssp > 4000.0 && dispvel_ssp > 60.0
After visual inspection, we have rejected 52 contaminated objects and therefore 56 cE galaxies were left in this sample. The latter two criteria on the age and velocity dispersion (age_ssp > 4000.0 && dispvel_ssp > 60.0) are common between all samples except the sample selected by the virial radius criterion.
S3.2 UV-dropout sample
The second sample is constructed with a relaxed requirement of a candidate detection in the band, because only 47 per cent of galaxies from our catalogue have magnitudes. We dropped the constraints on the color and the one derived from the 3D photometric relation (because it also requires a magnitude). Instead, together with our usual requirement of a galaxy having SSP age older than 4 Gyr and the velocity dispersion higher than 60 km s-1, we added a simple geometrical constraint from the canonical color–magnitude diagram: a candidate galaxy is redder than the red sequence plus scatter. This translates into the following expression: . Hence, we obtain the following formal query expression:
(corrmag_g - kcorr_g - 25 - 5 * log10(luminosityDistance(z, 72.0, 0.3, 0.7))) > -18.7 &&
(petror50_r < 2.0 || petror50_r / 206.265 * luminosityDistance(z, 72.0, 0.3, 0.7) < 0.7) &&
age_ssp > 4000.0 && (dispvel_ssp > 60.0 || dispvel_exp > 60.0) &&
(corrmag_NUV < -100 || NULL_corrmag_NUV) &&
(corrmag_g - corrmag_r - kcorr_g + kcorr_r > 0.8 -
(corrmag_r - kcorr_r - 25 - 5 * log10(luminosityDistance(z, 72.0, 0.3, 0.7)) + 20.0) * 0.12 / 3.0)
This query yields 288 objects. After visual inspection we added 32 additional cE candidates to our initial sample.
S3.3 Estimated effective radius sample
We notice that well known cE galaxies Messier 32, NGC 4486B, NGC 5846cE have effective radii smaller than 0.4 kpc. We therefore try to visually inspect galaxies that satisfy our initial selection criteria but instead of filtering the input catalogue by the velocity dispersion estimate, we require galaxies to have the effective radius estimate below 0.5 kpc, similarly to known cEs. In order to do this, we compute mass-to-light ratios for galaxies from the input catalogue using the pegase.hr stellar population models constructed using the Salpeter IMF (?) and then estimate effective radii using the published expression (?) assuming that mass follows light. This filter can be formally expressed as
(corrmag_NUV - corrmag_r - kcorr_NUV + kcorr_r) > 4.0 &&
(corrmag_g - kcorr_g - 25 - 5 * log10(luminosityDistance(z, 72.0, 0.3, 0.7))) > -18.7 &&
(petror50_r < 2.0 || petror50_r / 206.265 * luminosityDistance(z, 72.0, 0.3, 0.7) < 0.7) &&
(corrmag_g - corrmag_r - kcorr_g + kcorr_r - gr_fit) > 0.03 &&
age_ssp > 4000.0 && r_eff < 0.5 && z < 0.08
This query returned 82 objects from which we visually confirmed two.
To relax the requirement on having a NUV magnitude, we change the virual radius query in a way we did for the UV-dropout sample. The corresponding estimated effective radius selection hence becomes:
(corrmag_g - kcorr_g - 25 - 5 * log10(luminosityDistance(z, 72.0, 0.3, 0.7))) -18.7 &&
(petror50_r < 2.0 || petror50_r / 206.265 * luminosityDistance(z, 72.0, 0.3, 0.7) < 0.7) &&
age_ssp > 4000.0 && (corrmag_NUV < -100 || NULL_corrmag_NUV) &&
(corrmag_g - corrmag_r - kcorr_g + kcorr_r > 0.8 -
(corrmag_r - kcorr_r - 25 - 5 * log10(luminosityDistance(z, 72.0, 0.3, 0.7)) + 20.0) * 0.12 / 3.0)  &&
r_eff_virial < 0.5 && z < 0.08
This query returns 102 objects. Five of them are confirmed visually as cE candidates and included in the preliminary list.
We attempted to use the effective radii computed by the two-dimensional fitting of SDSS images with the gim2d software (?). However, in the vast majority of cases our galaxies remain spatially unresolved in SDSS images, and the effective radii estimated from the image analysis (?) do not correspond to their physical radii. This is illustrated by the fact that they are correlated with redshift. Therefore, we decided not to use these data in our further selection and analysis.
S3.4 Additional candidates
We plot the color–magnitude () diagram and visually inspect all the objects with unphysically red colors (also satisfying common age and velocity dispersion criteria), some of which turn out to be galaxies blended with bright stars, artefacts and galaxies with underestimated magnitudes by 0.3 mag or more. Among the latter group we find 120 cE candidates which we include in the preliminary list of cE candidates.
S3.5 Discarding objects with emission lines
After merging 4 lists of cE candidates selected using different approaches described above, we obtain one preliminary table with 215 cE candidates. We then perform the final quality check by identifying galaxies with emission lines in the spectra from this preliminary list of candidates. We compute line fluxes in the spectral fitting residuals and use original flux uncertainties in order to estimate the signal-to-noise ratios. Then, we reject the objects where either [Oii] 3730Å, or [Oiii] 5007Å, or H 6565Å, or [Nii] 6585Å exceed the 4- detection (20 galaxies).
Hence, we end up with 195 objects in our final sample of cE galaxies.
S4 Identification of host galaxies
The reliable formal identification of host galaxies is a challenging procedure and is not always possible. We employ a manual and to some extent subjective scenario and note that our host identification may be imperfect in cases of objects with large projected distances from hosts.
In order to achieve this, we inspect SDSS color images in 2 degree vicinities of every cE candidate using the cds aladin software. In this procedure, we overplot all SDSS objects with known spectroscopic redshifts within 2000 km s-1 of the radial velocity difference from a cE galaxy. Among those we visually identify the most luminous galaxy in a group/cluster where it is possible. In cases where the largest group/cluster member has no SDSS redshift (e.g. due to a fiber collision in the SDSS spectroscopic targets selection procedure), we query NASA NED service to obtain its redshift. In a few cases, we select a close-by bright galaxy sometimes showing signs of interaction with a cE candidate instead of the brightest object in the group/cluster. In our preliminary list of cE galaxies there are 12 isolated or “field” objects for which we cannot identify hosts, whereas in the discarded emission line galaxies there is 1 field galaxy. Hence, in the final sample we have 11 isolated cE galaxies.
S5 Properties of the final cE sample
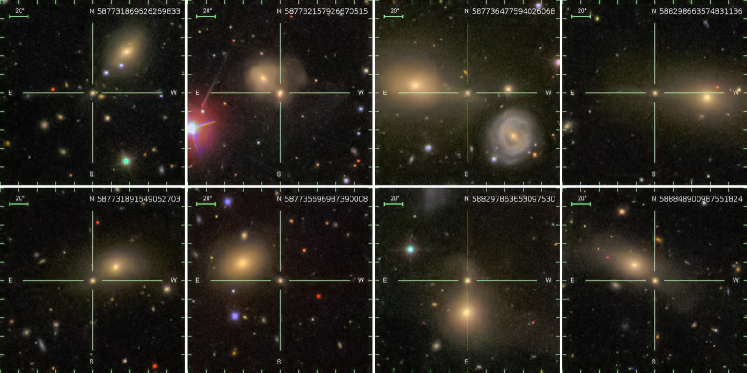
S5.1 Compact elliptical galaxies with tidal streams
Our final sample includes 8 compact elliptical galaxies with the visual signs of ongoing tidal interaction with their host galaxies (see Fig. S2) resembling the two galaxies with tidal streams found earlier (?). The numerical simulations of the tidal stripping (?) demonstrated that such features can be observed only during a relatively short stage of the cE formation, that is during the first 200–400 Myr following the first close passage of a cE progenitor near the host galaxy. Later they quickly fade down to very faint surface brightness values (29 mag arcsec-2) and become a part of the intracluster (intragroup) light.
S5.2 Host galaxies
Our new large cE sample allows us to compute statistical properties of the host galaxies identified for 184 cEs. Most cEs in our sample belong to galaxy groups including 5 to 30 members identified in the SDSS spectroscopic sample. For 23 cEs, host galaxies are early to late-type spirals (in all these cases there is only one cE associated to a given host galaxy) while for the remaining cases the hosts are massive lenticular, elliptical or merging galaxies.
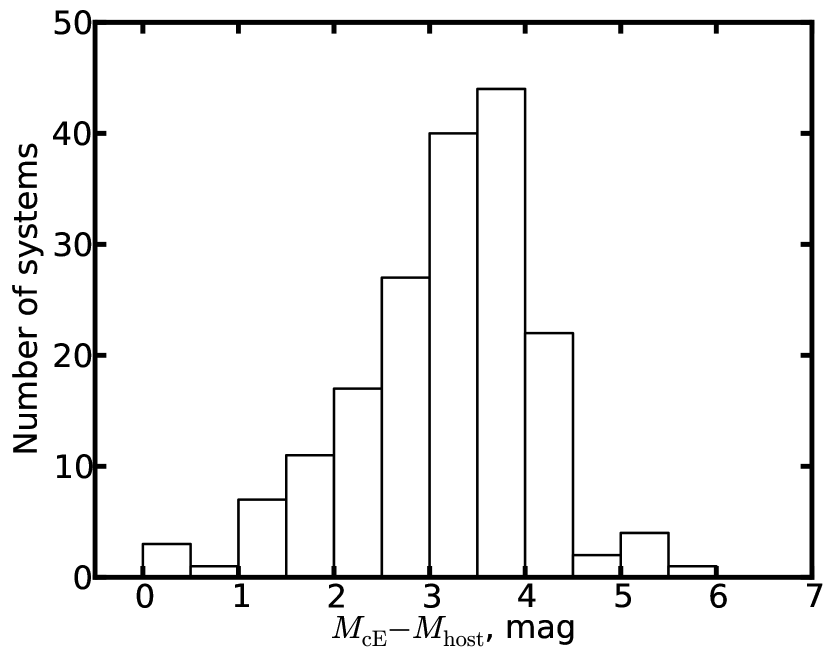
A distribution of the differences between -band luminosities of cE galaxies and their hosts will reflect the distribution of stellar mass ratios because stellar -band ratios of cEs and giant early-type galaxies are similar (assuming the same stellar initial mass function). The obtained distribution is shown in Fig. S3. It is skewed and peaks at 3.25 mag corresponding to the stellar mass ratio of 20. Giant elliptical galaxies contain about 90% of dark matter within their virial radii (?, ?), while for nearby cEs like Messier 32 the measured dark matter content is negligible being consistent with the tidal stripping scenario where the extended dark matter halo is stripped before the stellar component. This yields in the median cE-to-host mass ratio of about 200.
Worth mentioning that prototypical cEs, Messier 32 and NGC 4486B with the cE-to-host stellar mass ratios of 100 and 60 respectively are sitting in the tail of the distribution including a few per cent of objects.
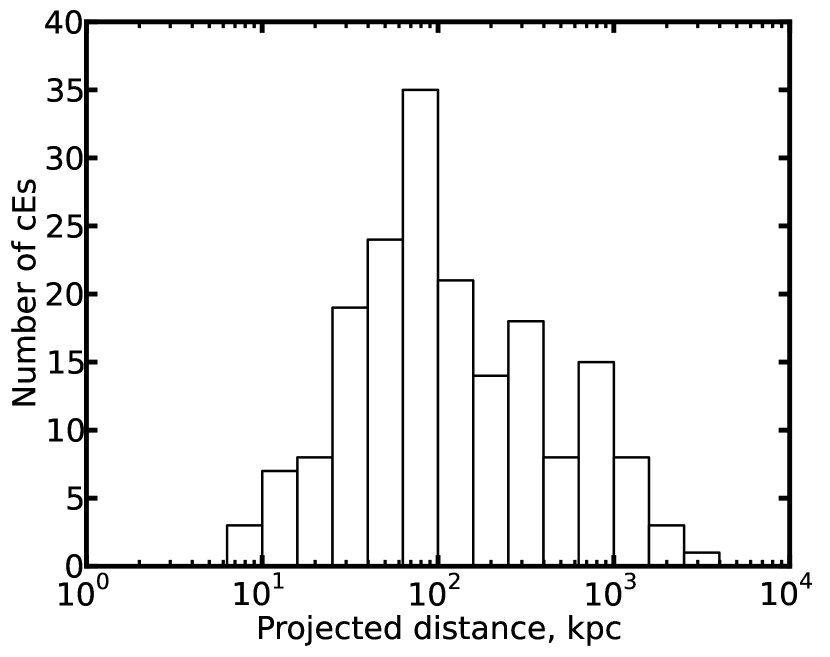
In Fig. S4 we show the distribution of projected distances on the sky between cEs and their identified host galaxies. The distribution looks almost uniform between 20 kpc and 1 Mpc (in ) with a prominent peak at 50–100 kpc. The numerical simulations of tidal stripping (?) demonstrate that if a cE progenitor comes too close to the host galaxy, the quick orbital decay causes its very quick accretion on-to the host on a timescale of a few hundred Myr. On the other hand, under typical conditions in clusters and rich groups, tidal stripping becomes significantly less efficient at distances exceeding 200 kpc, and this explains the decline. The high- tail probably contains mostly cEs which were gravitationally ejected from the cluster/group centers by three-body interactions.
S6 Construction of caustics for cE host clusters and groups
We identify 191 cE galaxies as members of galaxy clusters from the groups and clusters catalogue of (?). 7 of them have the luminosity rank 1 in a group of 2 galaxies and, therefore, were considered isolated or field cEs. In order to study the dynamical connection between cE galaxies and their host environments, we plot phase space diagrams showing redshifts of clusters members versus their projected distances from cluster centers. Such diagrams usually show a characteristic trumpet shape while their boundaries are called caustics. (?) provided a technique to compute them under assumptions of spherical symmetry and hierarchical clustering for the formation of the large-scale structure. This method works as a convenient way to estimate the escape velocity from the gravitational potential well generated by the cluster at each cluster-centric radius. We used the implementation of (?) technique in the Caustic App version 1.2 (?) to find caustics in the data for our galaxy clusters and identify cE positions with respect to the caustics.
We also create an ensemble galaxy cluster to compare the distribution of normal cluster members to the one of our cE candidates in the phase space. We take 33 galaxy clusters that have more than 20 members and include at least one cE candidate. Their masses, velocity dispersions and effective radii were already known after the previous step when their individual caustics were computed and analysed. We project every cluster on a tangential plane with the projection center at the cluster center, and then normalize projected coordinates of galaxies by half-mass radii of the corresponding clusters. The relative velocities with respect to a cluster center are normalized by the cluster velocity dispersions. Then, all the clusters are shifted to the redshift . In this fashion, positions and radial velocities of 2,592 galaxies in 33 galaxy clusters are brought to the same scale ready to be used as ensemble cluster. We computed caustics of generated ensemble cluster using default settings of Caustic App.
| ce_objid | ra | dec | plate | mjd | fiberid | |
|---|---|---|---|---|---|---|
| 587722953304375642 | 237.29089 | 0.21562 | 342 | 51691 | 548 |
SUPPLEMENTARY REFERENCES AND NOTES
- 1. A. Lawrence, et al., Mon. Not. R. Astron. Soc. 379, 1599 (2007).
- 2. I. V. Chilingarian, A.-L. Melchior, I. Y. Zolotukhin, Mon. Not. R. Astron. Soc. 405, 1409 (2010).
- 3. D. Le Borgne, et al., Astron. Astrophys. 425, 881 (2004).
- 4. E. E. Salpeter, Astrophys. J. 121, 161 (1955).
- 5. I. V. Chilingarian, P. Prugniel, O. K. Sil’chenko, V. L. Afanasiev, Mon. Not. R. Astron. Soc. 376, 1033 (2007).
- 6. I. V. Chilingarian, et al., Astron. Astrophys. 486, 85 (2008).
- 7. I. V. Chilingarian, Mon. Not. R. Astron. Soc. 394, 1229 (2009).
- 8. N. Y. Podorvanyuk, I. V. Chilingarian, I. Y. Katkov, Mon. Not. R. Astron. Soc. 432, 2632 (2013).
- 9. I. V. Chilingarian, S. Mieske, M. Hilker, L. Infante, Mon. Not. R. Astron. Soc. 412, 1627 (2011).
- 10. M. B. Taylor, Astronomical Data Analysis Software and Systems XIV, P. Shopbell, M. Britton, & R. Ebert, ed. (2005), vol. 347 of Astronomical Society of the Pacific Conference Series, pp. 29–+.
- 11. L. Simard, J. T. Mendel, D. R. Patton, S. L. Ellison, A. W. McConnachie, Astrophys. J. Suppl. Ser. 196, 11 (2011).
- 12. M. Loewenstein, R. E. White, III, Astrophys. J. 518, 50 (1999).
- 13. G. A. Mamon, E. L. Łokas, Mon. Not. R. Astron. Soc. 363, 705 (2005).
- 14. http://personalpages.to.infn.it/~serra/causticapp.html.