The formation of Milky Way-mass disk galaxies in the first 500 million years of a cold dark matter universe
Abstract
Whether among the myriad tiny proto-galaxies there exists a population with similarities to present day galaxies is an open question. We show, using BlueTides, the first hydrodynamic simulation large enough to resolve the relevant scales, that the first massive galaxies to form are predicted to have extensive rotationally-supported disks. Although their morphology resembles in some ways Milky-way types seen at much lower redshifts, these high-redshift galaxies are smaller, denser, and richer in gas than their low redshift counterparts. From a kinematic analysis of a statistical sample of 216 galaxies at redshift we have found that disk galaxies make up 70% of the population of galaxies with stellar mass or greater. Cold Dark Matter cosmology therefore makes specific predictions for the population of large galaxies 500 million years after the Big Bang. We argue that wide-field satellite telescopes (e.g. WFIRST) will in the near future discover these first massive disk galaxies. The simplicity of their structure and formation history should make possible new tests of cosmology.
1. Introduction
The search for “primeval” galaxies and the understanding that will come from studying them has long been a guiding principle for much of extra-galactic astrophysics and cosmological research. Theories for the formation of the first galaxies span early models of monolithic collapse of massive bodies(Eggen et al., 1962) to merger scenarios for the hierarchical formation of all structures(Press & Schechter, 1974). Disk galaxies are arguably those that have generated the most interest, and were the focus of early theoretical work(Fall & Efstathiou, 1980). In the simplest galaxies, the structure of rotating disks should be directly linked to the angular momentum of the surrounding dark matter halo. Finding galaxies for which this is true, in the earliest environments possible would enable powerful tests of the dynamics, gaseous and radiative processes involved in galaxy formation.
In current cosmological models, galaxies form from the gravitational collapse of small perturbations in the matter distribution(Silk & Mamon, 2012). This process involves both a hierarchy of merging structures and smooth accretion, so that early galaxies are predicted to be morphologically irregular, clumpy, and compact(Shimizu et al., 2014; Cen & Kimm, 2014). This is supported by recent observational data on samples of galaxies at redshift and beyond(Oesch et al., 2010; Ono et al., 2013; Curtis-Lake et al., 2014). The volumes accessible to these studies, both computational and observational are however thousands of times smaller than those that will be probed by upcoming telescopes(Spergel et al., 2015).
The earliest that large rotating disks have been seen observationally is at redshifts (Genzel et al., 2006; Glazebrook, 2013), and this has required deep spectroscopy on 10m-class telescopes. At higher redshifts, galaxies in published samples are very compact, with half light radii kpc at (Oesch et al., 2010; Holwerda et al., 2014). The fraction of morphologically disturbed galaxies is also known to be high in deep fields (Menanteau et al., 2006). The volumes probed at redshifts and particularly the redshifts at the current frontier, are however very small, with a sky areas of 11 sq. arcmin accessible to the Hubble Extreme Deep Field(Illingworth et al., 2013) for example. This has meant that probing the highest luminosity and largest galaxies, has not been possible so far. It is not surprising that observational studies of the structure and morphologies of the highest galaxies have not revealed large disk galaxies, whether they exist or not.
Theoretically, the situation is similar - it is not known what the prevailing Cold Dark Matter model predicts for the most massive galaxies at redshifts . Numerical simulations used to make predictions have so far(Jaacks et al., 2012; Cen & Kimm, 2014) been limited to volumes 40-100 times smaller than our present work, or else zoomed simulations concentrating on individual galaxies(Pawlik et al., 2011) or overdensities(Yajima et al., 2014). Intriguingly, a dominant fraction of the early forming (dwarf-mass) galaxies simulated so far show evidence of disk-like structure(Romano-Díaz et al., 2011; Pawlik et al., 2011). It is of prime importance to reach the regime of large galaxies as the early formation of luminous or massive objects (such as first bright quasars, and most massive galaxy clusters) is one of the most potent tests of models of structure formation in hierarchical cosmology. In order to do so, and simulate a statistically useful sample of galaxies, it is necessary to model a volume of order several hundred megaparsecs on a side. This must be done with high enough mass and force resolution to allow studies of structure and morphology (See e.g., Governato et al. (2007)). We have been able to reach this regime, with the BlueTides run, a cosmological hydrodynamic simulation which we have just completed, and we describe the first results below.
2. The BlueTides simulation
BlueTides was carried out using the Smoothed Particle Hydrodynamics code MP-Gadget (see Springel (2005); Di Matteo et al. (2012) for earlier versions of the code) with (0.69 trillion) particles on 648,000 Cray XE compute cores of the Blue Waters system at the National Center for Supercomputing Applications (NCSA). The simulation evolved a cube of side length 400 comoving Mpc/h to redshift , and is the largest cosmological hydrodynamic simulation yet carried out in terms of memory usage, by an order of magnitude(Di Matteo et al., 2012). The supernova feedback in BlueTides is modeled after Okamoto et al. (2010), with the wind feedback parameter . This model has been shown to reproduce several key properties of low redshift galaxies (Vogelsberger et al., 2014). We also include the effect of super-massive black holes, primordial and metal cooling, H2 molecular cloud and a non-uniform ionization background: we refer to Feng et al. (2015) for the parameters and other aspects of the simulation in more detail. We also show there that the global star formation rate predicted is consistent with current observations at redshifts . The volume simulated is approximately 300 times larger than the largest observational survey at these redshifts(Trenti, 2012).
Galaxies were selected from the raw particle data (47 TB per output time) using a friends-of-friends algorithm at a range of redshifts from . The mass resolution of the simulation is per dark matter particle, so that at redshift , 36 million galaxies were found containing 64 dark matter particles or more, above a mass threshold of . The BlueTides galaxy luminosity functions at the redshifts of interest here are fully consistent with current observations, and this is shown in Feng et al. (2015). In the present case, we are most interested in the most massive galaxies with at least stellar particles, which contain enough particles to study their rotational support. The corresponding stellar mass is or more.
We have made images of all galaxies present in the simulation, by adaptively smoothing the star particle distribution to reveal as much structure as possible given the resolution available. We have also used the star formation rate (SFR) of the gas particles in the simulation to make other images. The SFR can be related to the rest-frame UV () luminosity. The UV luminosity is sensitive to the presence of dust, and there is evidence that the highest luminosity early galaxies are significantly obscured(Wilkins et al., 2013; Cen & Kimm, 2014). We account for this dust attenuation using a screening model(Joung et al., 2009). This simple model assumes that the dust attenuation in a galaxy pixel is proportional to the metal-mass density in that pixel. There is only one free parameter, which we normalize by setting for observed galaxies(Wilkins et al., 2013). We have taken this approach, rather than performing a more detailed radiative transfer simulation because the current major uncertainties lie in the dust content and attenuation curve(Wilkins et al., 2013).
3. Galaxy Morphology
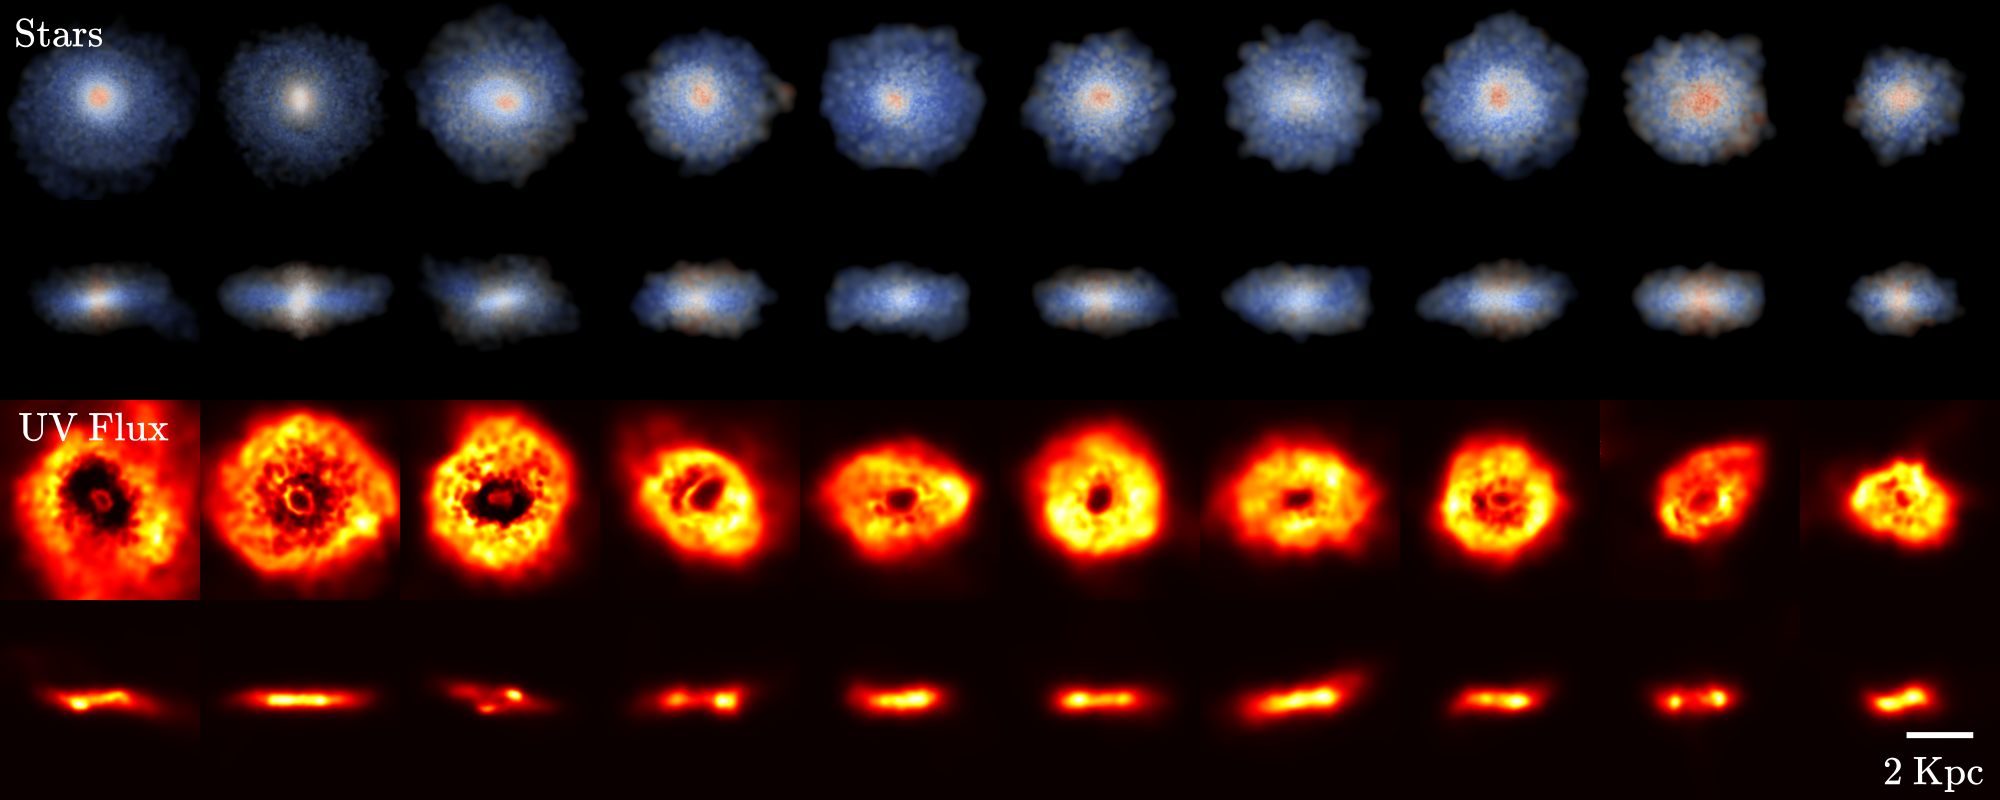
We turn directly to the morphology of the most massive () galaxies. We compute the inertia tensor of the star particles and use these to plot views of each galaxy parallel and perpendicular to the major axis. Studying them reveals that a significant fraction are visually disk-like, and surprisingly regular in shape.
In Figure 1 we show images of 10 disk galaxies in the simulation at , both side-on and face-on for each. These are among those kinematically selected to be disks (see below). We can see that the disk components extend to a diameter of 4 kpc, with a median half-light radii 0.6 kpc for those shown. Although the BlueTides disk galaxies have masses comparable to the Milky Way, their sizes are significantly smaller, by a factor of . The disk galaxies also have mean gas fractions of at . The typical stellar mass/halo mass ratio of these systems is a few percent (, estimated from Friend-of-Friend halos). This is similar to systems at z=0, where the stellar to halo ratio peaks at 4% for halos in the same mass range (Guo et al., 2010). The star formation rates of these galaxies are , orders of magnitude larger than the main sequence galaxies of similar stellar mass at low-z (Whitaker et al., 2012). The stellar populations in the central regions of each galaxy are significantly older than the outer disk, with a proportion of stars that formed as early as , i.e. age Myr at .
These disk galaxies host supermassive blackholes, with blackhole masses ranging from a few times to a few times . Interestingly, the host galaxy of the most massive blackhole () has a much more dominate spheroidal component () than typical galaxies with similar masses (). We plan to investigate the role of central blackholes in the formation of disks in the near future.
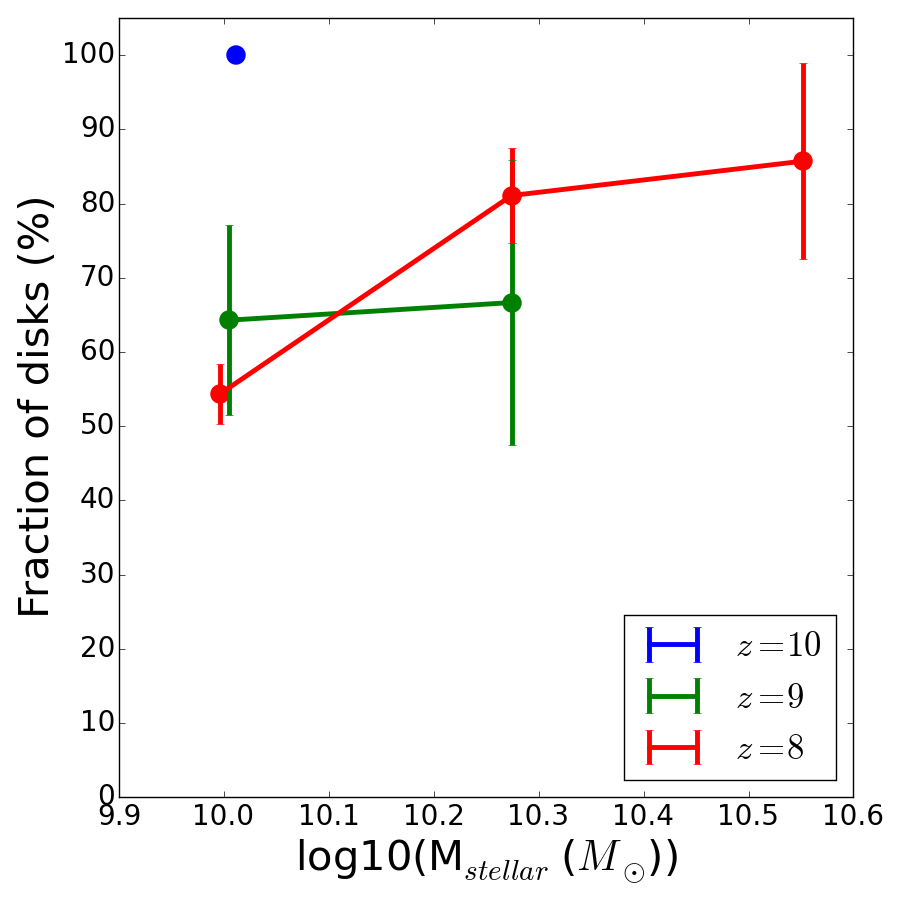
Kinematic decomposition of the galaxies lets us know if the disk-like structures seen in Figure 1 are rapidly rotating. We have used the standard technique(Governato et al., 2007) to determine the fraction of stars in each galaxy which are on planar circular orbits, and which are associated with a bulge. We note that this technique is not sensitive to the clumpiness of disks. At redshift we find that 70% of galaxies above a mass of are kinematically classified as disks (using the standard threshold of disk stars to total stars (D/T) ratio of 0.2(Governato et al., 2007). This percentage of disks changes with redshift as shown in Figure 2. In all cases it is much higher than the fraction of observed galaxies of comparable mass which are seen to be disk-like at , (Buitrago et al., 2013).
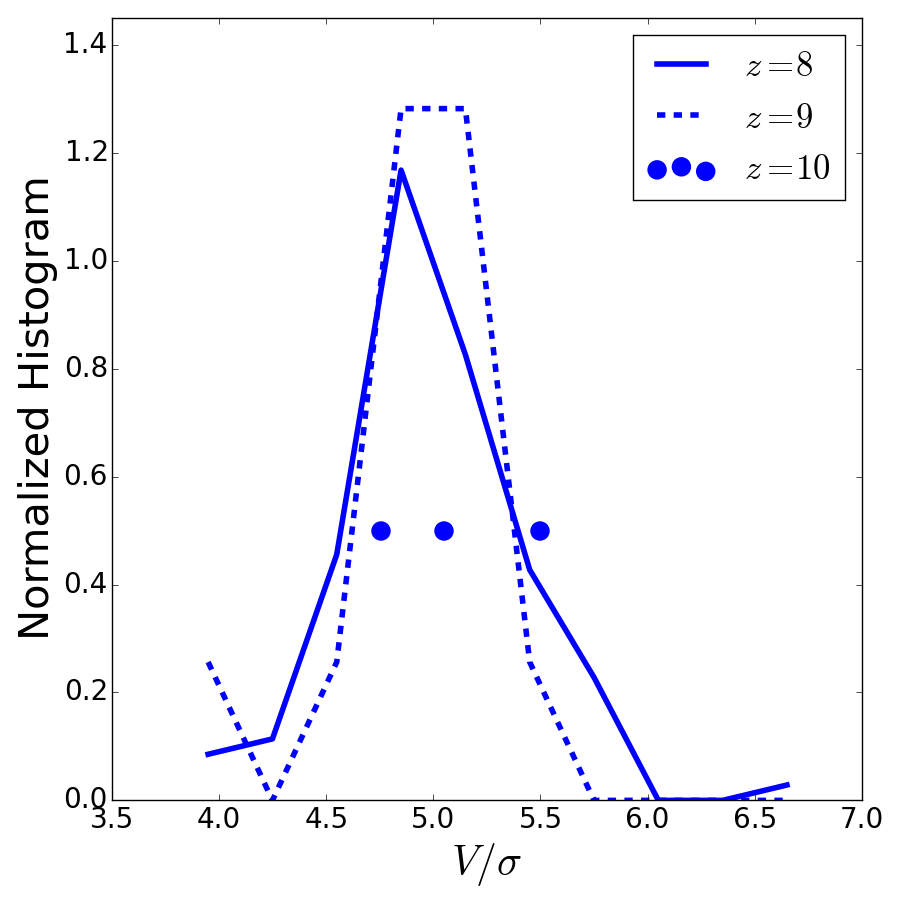
We note that the majority of gas-rich disks seen at high redshifts accessible so far to spectroscopy (z=2-3) are clumpy, turbulent and thick (Förster Schreiber et al., 2009) (Genzel et al. (2006) is an exception), and it is natural to expect this to be the case with the BlueTides massive disks, which have high gas fractions. A relevant statistic we have computed is the ratio of circular velocity, to vertical velocity dispersion of our disk galaxies. We have computed this ratio using information from the disk star particles and plot a histogram of the results in Figure 3. We can see that the values range from to , with a mean value of measured from all redshifts. The galaxies are therefore definitely disks, having well above the expected for non-disk galaxies. This supports our conclusions made using the D/T ratio above. The values are lower than the expected for thin spiral galaxies seen at , and instead consistent with gas rich turbulent disks from earlier times(Förster Schreiber et al., 2009). Although this is reasonable, confirmation of this aspect awaits future higher resolution resimulations which are able to resolve the fine vertical structure of the disks.
4. Half-light radius
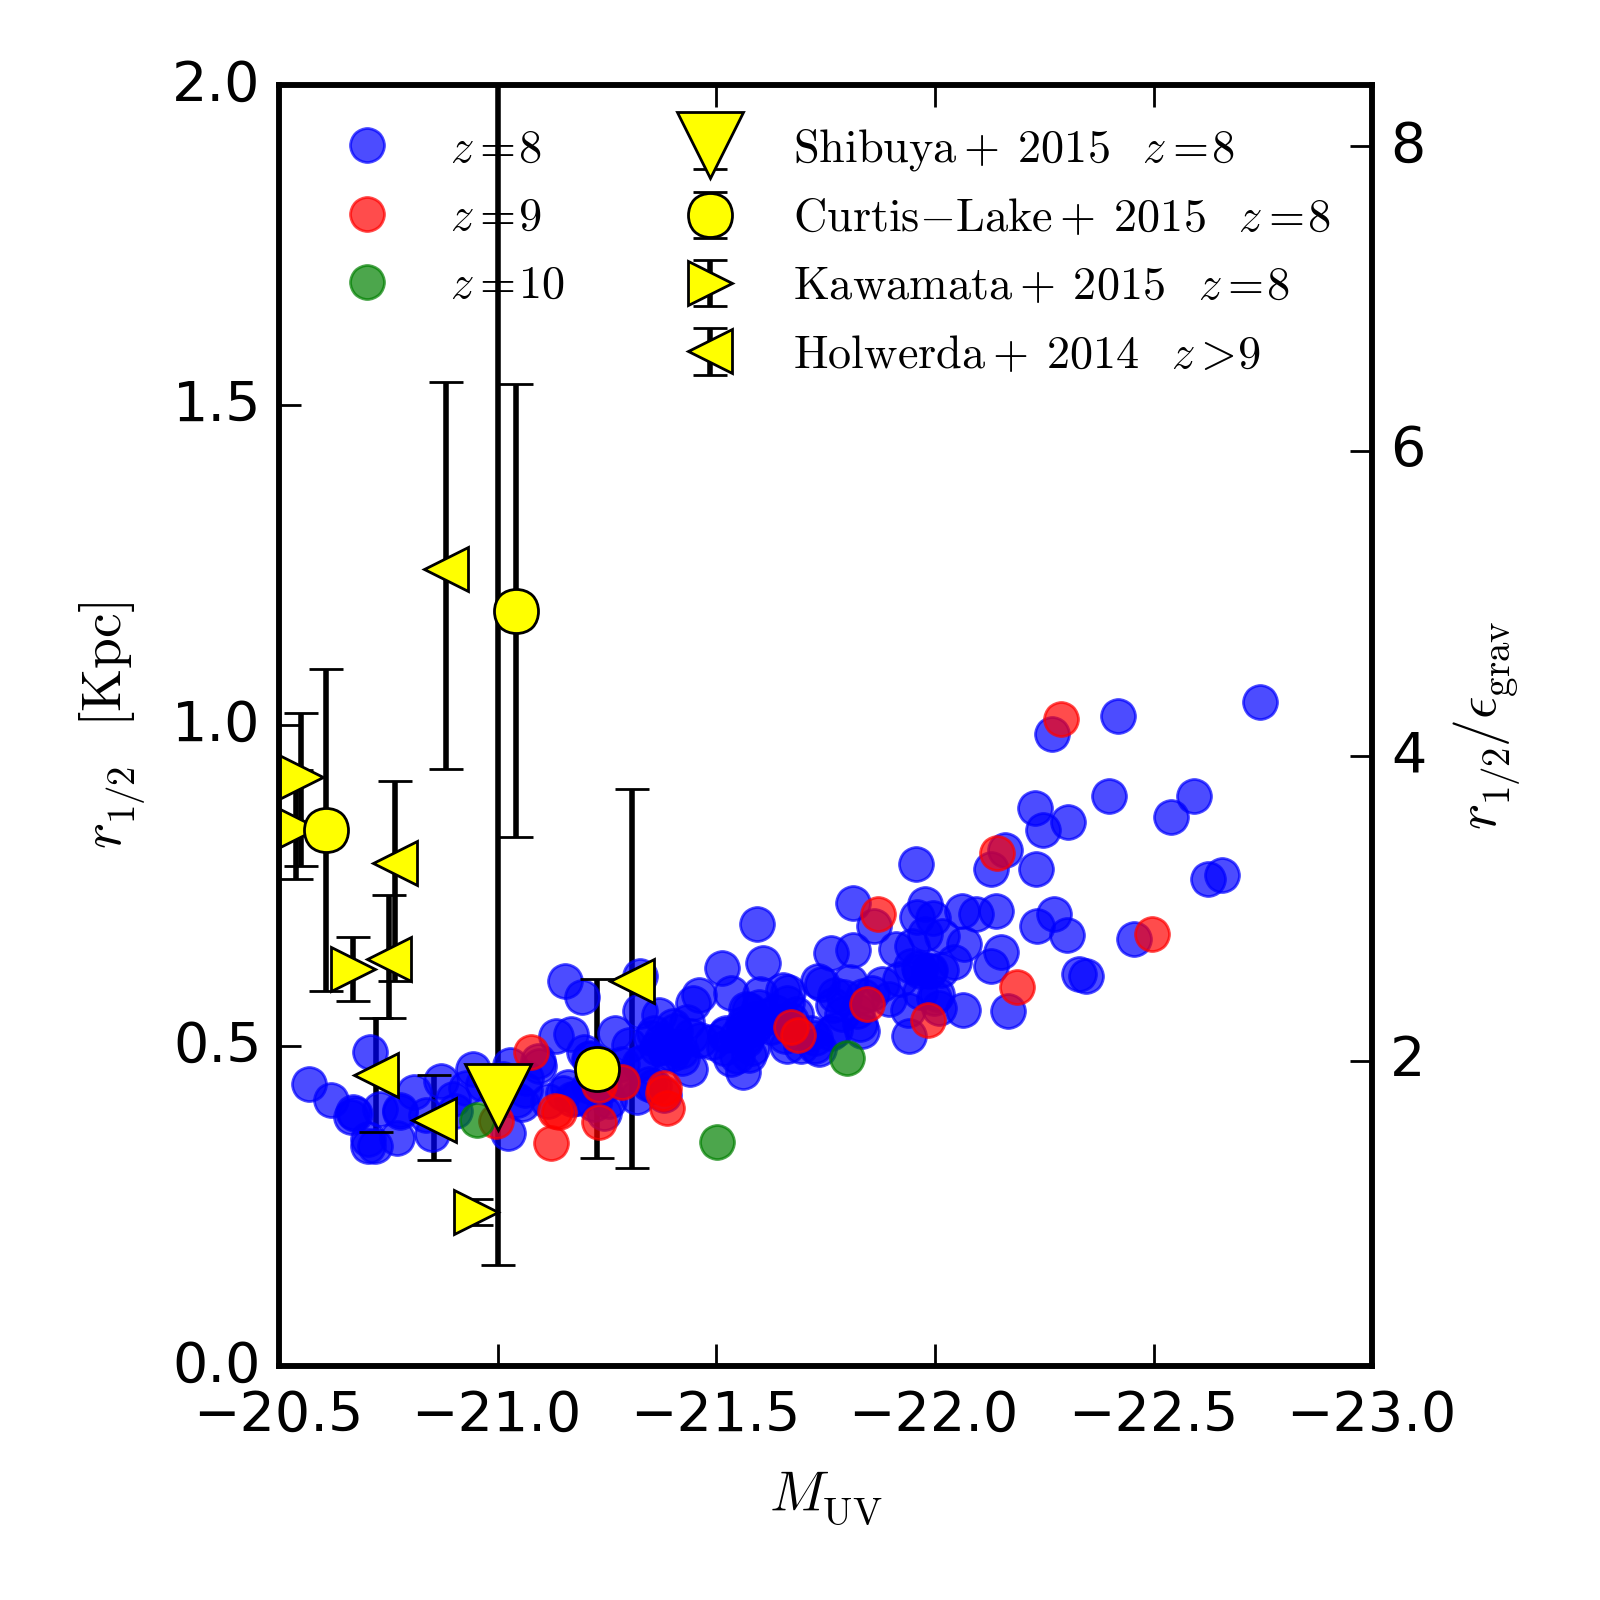
A number of recent studies(Oesch et al., 2010; Ono et al., 2013; Holwerda et al., 2014; Kawamata et al., 2014; Shibuya et al., 2015) have begun to make measurements of galaxy structure and in particular sizes at the highest redshifts. As the observational volumes are small, the magnitude range of observed samples varies from to . We can therefore compare BlueTides galaxies with these measurements, bearing in mind that the brightest galaxies in the simulation are much rarer than can be observed in current surveys. Using the standard observational algorithm SEXtractor111We use a Python rewrite of SEXtractor by Barbary & contributors (2014)., we measure the half-light radius () of each galaxy. This is shown in Figure 4, where we compare our redshift results with observational data from (Kawamata et al., 2014), (Holwerda et al., 2014), (Curtis-Lake et al., 2014) and (Shibuya et al., 2015). We can see that the current observations cover the lower end of the magnitude range, and are in the same realm as (but not a good match to) our simulation results, with a mean for . Galaxies are therefore extremely compact at these high redshifts. The galaxy sizes in the simulation do appear to be on the low end compared to observations, something which has also been seen at z=3(Joung et al., 2009) and could be a sign of interesting physics. It has also been shown however(Curtis-Lake et al., 2014) that selection effects, flux cuts and choice of size measurement algorithms can affect measured galaxy sizes by factors of 2 or more.
The half light radius of the faintest samples () is only a factor of 2 of the gravitational smoothing length (0.24 Kpc at ), which could also affect our results. In future work we will explore these effects in more detail with mock observations. Interestingly, the simulation predicts a positive size-luminosity correlation.
Analytic models can be used to predict how disk sizes scale with redshift. For example, the simplest assumption is that the half-light radii scales with virial radius, which has the following redshift dependence
for constant halo circular velocity (e.g., Mo et al. (1998)). Using this relationship to extrapolate the disk sizes from the GEMS observational sample analyzed in Somerville et al. (2008) (in which the median for galaxies with at is ), this simplest model predicts that disks of this mass should have at and at . This is somewhat lower than disks of similar stellar mass in our simulation which have half-light radii about twice this value (see Figure 4 - these correspond to the least luminous disks plotted). Somerville et al. (2008) have made more sophisticated models which include evolution in the internal structure of dark halos and adiabatic contraction, both of which mean that the trend of size evolution with redshift is expected to be weaker than in the simplest models (also supported by observations, e.g. Shibuya et al. (2015)), and which therefore appear to describe our simulated results better.
5. Conclusions
At redshifts the Universe is about 1000 times denser than the present day. In these very different physical conditions, and in the very short time available, massive disk galaxies are able to form in the cold dark matter model. They share many visual and kinematic characteristics with those that are seen when the Universe was 20 times older. This means that an image one might have of the early Universe containing only small protogalaxies, merging clumps and irregular structures is not appropriate.
An immediate question we can ask is how these disks did in fact form in the simulation. We have tracked particles in the most massive galaxies (including those plotted in Figure 1) back in time to visually assess their formation history. We have found that of the most massive 20 galaxies at redshift , only one was the product of an obvious major merger between similarly sized progenitor galaxies. A popular picture of gas rich major mergers producing some disks (Springel & Hernquist, 2005) therefore does not appear to be relevant here.
Even though the Lagrangian volumes (Oñorbe et al., 2014) and halos (Rossi et al., 2011) at the rare peaks associated with these galaxies are likely more spherical, the distribution of matter around galaxies is known to be highly anisotropic in the CDM model, the infall of gas cannot proceed quasi-spherically as in the classical picture of galaxy formation(Fall & Efstathiou, 1980). Instead, smooth infall and accretion build up the disks, with cold gas arriving along the directions of nearby filaments in the density distribution (Romano-Díaz et al., 2014).
These massive disks will be fascinating objects to study with next generation telescopes. The WFIRST satellite(Spergel et al., 2015) will have a field of view 200 times that of the WFC3 instrument on HST, making a planned deep (J=26.7) sky survey covering 2000 square degrees possible. Using the luminosity function in BlueTides and its evolution we predict that this survey should find disk galaxies of the type we have kinematically identified as massive disks, about 1 per field of view on average. This compares to a probability of 0.3 for finding a single one of these objects in the current largest area HST survey (BoRG, Trenti et al. (2011)). The rotation curves will be exciting targets for Thirty Meter class ground based telescopes. Forming from lightly enriched material, these primeval disk galaxies are special objects. Observing them and comparing them with simulations and analytic theory should enable us to make inferences about dark matter, the role of angular momentum and the fundamental principles of galaxy formation (such as tidal torques, and smooth accretion of unenriched material) which are not possible in the later, more complex Universe.
References
- Barbary & contributors (2014) Barbary, K., & contributors. 2014, SEP: Python and C library for Source Extraction and Photometry
- Buitrago et al. (2013) Buitrago, F., Trujillo, I., Conselice, C. J., & Häußler, B. 2013, MNRAS, 428, 1460
- Cen & Kimm (2014) Cen, R., & Kimm, T. 2014, ApJ, 782, 32
- Curtis-Lake et al. (2014) Curtis-Lake, E., McLure, R. J., Dunlop, J. S., et al. 2014, MNRAS, submitted, arXiv:1409.1832
- Di Matteo et al. (2012) Di Matteo, T., Khandai, N., DeGraf, C., et al. 2012, ApJ, 745, L29
- Eggen et al. (1962) Eggen, O. J., Lynden-Bell, D., & Sandage, A. R. 1962, ApJ, 136, 748
- Fall & Efstathiou (1980) Fall, S. M., & Efstathiou, G. 1980, MNRAS, 193, 189
- Feng et al. (2015) Feng, Y., Di Matteo, T., Croft, R. A. C., et al. 2015, MNRASsubmitted
- Förster Schreiber et al. (2009) Förster Schreiber, N. M., Genzel, R., Bouché, N., et al. 2009, ApJ, 706, 1364
- Genzel et al. (2006) Genzel, R., Tacconi, L. J., Eisenhauer, F., et al. 2006, Nature, 442, 786
- Glazebrook (2013) Glazebrook, K. 2013, PASA, 30, 56
- Governato et al. (2007) Governato, F., Willman, B., Mayer, L., et al. 2007, MNRAS, 374, 1479
- Guo et al. (2010) Guo, Q., White, S., Li, C., & Boylan-Kolchin, M. 2010, MNRAS, 404, 1111
- Holwerda et al. (2014) Holwerda, B. W., Bouwens, R., Oesch, P., et al. 2014, ApJsubmitted, arXiv:1406.1180
- Illingworth et al. (2013) Illingworth, G. D., Magee, D., Oesch, P. A., et al. 2013, ApJS, 209, 6
- Jaacks et al. (2012) Jaacks, J., Choi, J.-H., Nagamine, K., Thompson, R., & Varghese, S. 2012, MNRAS, 420, 1606
- Joung et al. (2009) Joung, M. R., Cen, R., & Bryan, G. L. 2009, ApJ, 692, L1
- Kawamata et al. (2014) Kawamata, R., Ishigaki, M., Shimasaku, K., Oguri, M., & Ouchi, M. 2014, ApJin press, arXiv:1410.1535
- Menanteau et al. (2006) Menanteau, F., Ford, H. C., Motta, V., et al. 2006, AJ, 131, 208
- Mo et al. (1998) Mo, H. J., Mao, S., & White, S. D. M. 1998, MNRAS, 295, 319
- Oñorbe et al. (2014) Oñorbe, J., Garrison-Kimmel, S., Maller, A. H., et al. 2014, MNRAS, 437, 1894
- Oesch et al. (2010) Oesch, P. A., Bouwens, R. J., Carollo, C. M., et al. 2010, ApJ, 709, L21
- Okamoto et al. (2010) Okamoto, T., Frenk, C. S., Jenkins, A., & Theuns, T. 2010, MNRAS, 406, 208
- Ono et al. (2013) Ono, Y., Ouchi, M., Curtis-Lake, E., et al. 2013, ApJ, 777, 155
- Pawlik et al. (2011) Pawlik, A. H., Milosavljević, M., & Bromm, V. 2011, ApJ, 731, 54
- Press & Schechter (1974) Press, W. H., & Schechter, P. 1974, ApJ, 187, 425
- Romano-Díaz et al. (2011) Romano-Díaz, E., Choi, J.-H., Shlosman, I., & Trenti, M. 2011, ApJ, 738, L19
- Romano-Díaz et al. (2014) Romano-Díaz, E., Shlosman, I., Choi, J.-H., & Sadoun, R. 2014, ApJ, 790, L32
- Rossi et al. (2011) Rossi, G., Sheth, R. K., & Tormen, G. 2011, MNRAS, 416, 248
- Shibuya et al. (2015) Shibuya, T., Ouchi, M., & Harikane, Y. 2015, ArXiv e-prints, arXiv:1503.07481
- Shimizu et al. (2014) Shimizu, I., Inoue, A. K., Okamoto, T., & Yoshida, N. 2014, MNRAS, 440, 731
- Silk & Mamon (2012) Silk, J., & Mamon, G. A. 2012, Research in Astronomy and Astrophysics, 12, 917
- Somerville et al. (2008) Somerville, R. S., Hopkins, P. F., Cox, T. J., Robertson, B. E., & Hernquist, L. 2008, MNRAS, 391, 481
- Spergel et al. (2015) Spergel, D., Gehrels, N., Baltay, C., et al. 2015, Wide-Field InfrarRed Survey Telescope-Astrophysics Focused Telescope Assets WFIRST-AFTA 2015 Report, arXiv:1503.03757
- Springel (2005) Springel, V. 2005, MNRAS, 364, 1105
- Springel & Hernquist (2005) Springel, V., & Hernquist, L. 2005, ApJ, 622, L9
- Trenti (2012) Trenti, M. 2012, in American Institute of Physics Conference Series, Vol. 1480, American Institute of Physics Conference Series, ed. M. Umemura & K. Omukai, 238–243
- Trenti et al. (2011) Trenti, M., Bradley, L. D., Stiavelli, M., et al. 2011, ApJ, 727, L39
- Vogelsberger et al. (2014) Vogelsberger, M., Genel, S., Springel, V., et al. 2014, MNRAS, 444, 1518
- Whitaker et al. (2012) Whitaker, K. E., van Dokkum, P. G., Brammer, G., & Franx, M. 2012, ApJ, 754, L29
- Wilkins et al. (2013) Wilkins, S. M., Coulton, W., Caruana, J., et al. 2013, MNRAS, 435, 2885
- Yajima et al. (2014) Yajima, H., Shlosman, I., Romano-Diaz, E., & Nagamine, K. 2014, ApJin press, arXiv:1411.2626