The Deepest Constraints on Radio and X-ray Magnetic Activity in Ultracool Dwarfs from WISE J104915.57-531906.1
Abstract
We report upper limits to the radio and X-ray emission from the newly discovered ultracool dwarf binary WISE J104915.57531906.1 (Luhman 16AB). As the nearest ultracool dwarf binary (2 pc), its proximity offers a hefty advantage to studying plasma processes in ultracool dwarfs which are more similar in gross properties (radius, mass, temperature) to the solar system giant planets than stars. The radio and X-ray emission upper limits from the Australia Telescope Compact Array (ATCA) and Chandra observations, each spanning multiple rotation periods, provide the deepest fractional radio and X-ray luminosities to date on an ultracool dwarf, with (5.5 GHz), (9 GHz), and . While the radio upper limits alone do not allow for a constraint on the magnetic field strength, we limit the size of any coherently emitting region in our line of sight to less than 0.2% of the radius of one of the brown dwarfs. Any source of incoherent emission must span less than about 20% of the brown dwarf radius, assuming magnetic field strengths of a few tens to a few hundred Gauss. The fast rotation and large amplitude photometric variability exhibited by the T dwarf in the Luhman 16AB system are not accompanied by enhanced nonthermal radio emission, nor enhanced heating to coronal temperatures, as observed on some higher mass ultracool dwarfs, confirming the expected decoupling of matter and magnetic field in cool neutral atmospheres.
1 Introduction
Recently, the discovery of a brown dwarf binary only 2 parsecs from the Sun was announced, making it the third closest system after the Alpha-Centauri system and Barnard’s star (Luhman, 2013). With L7.5 and T0.5 spectral types (Burgasser et al., 2013b) the Luhman 16AB system (also known as WISE J104915.57531906.1) has quickly become a benchmark for the study of ultracool atmospheres. A unique feature of the Luhman 16AB system is the large amplitude photometric variability (11% in an filter with a period of 4.870.01 hr; Gillon et al., 2013) of the T0.5 component, with rapid evolution of the global weather patterns on timescales of about a day (Crossfield et al., 2014). The two components of Luhman 16AB are separated by 1.5”, or 3 AU (Luhman, 2013), so not able to influence each other via magnetic interactions.
In principle, photospheric features causing photometric variability could be magnetic- or cloud-related; while there have been sporadic measurements of magnetic activity in mid-L and later spectral type dwarfs, no clear trends have emerged which connect photometrically variable and magnetically active ultracool dwarfs. Since the atmospheres of ultracool dwarfs are increasingly neutral, they are less likely to support cool magnetic spots (Gelino et al., 2002; Mohanty et al., 2002) than their earlier type stellar counterparts, and the observed variability in late L- and T-dwarfs has been attributed to the presence of patchy clouds (Ackerman & Marley, 2001; Burgasser et al., 2002; Marley et al., 2010). Despite this, there is evidence that in at least some cases, photometric variability of ultracool dwarfs is linked to magnetic activity (Clarke et al., 2003; Lane et al., 2007; Harding et al., 2013)
Magnetic activity signatures in ultracool dwarfs are rare: to date, only 5 L dwarfs and one T dwarf have been detected in the radio band, and only 1 L dwarf and no T dwarf has been detected in the X-ray band, with a wide range of behaviors displayed among the small number of detections. Studies have shown that for late-M to early-L dwarfs faster rotation results in an increased radio detection fraction (McLean et al., 2012) while X-ray emission seems to be suppressed leading to a sort of super-saturation (Berger et al., 2010).
Dynamo models explain the generation of magnetic fields in ultracool dwarfs by extrapolating convection-driven geodynamo models with strong density stratification (Christensen et al., 2009): part of the convected energy flux is converted to magnetic energy to balance ohmic diffusion. Such scaling laws predict quite strong magnetic fields, of order 1 kG for a 1 GY old, 0.05 M⊙ brown dwarf with T1500 K and average density of 90,000 kg m-3. These scalings do not, however explain why only a handful of ultracool dwarfs of spectral type L and T have been detected through radio observations (implying field strengths compatible with these extrapolations) while other objects have considerably lower upper limits. Other parameters must govern the generation of radio emission and/or field strength.
Due to the proximity of the Luhman 16AB system, its magnetic activity can be probed with unprecedented sensitivity. An absence of activity signatures would support the prevailing view that large amplitude photometric variability of early T-dwarfs is not connected to magnetism, but rather is a consequence of patchy cloud coverage. We report on two epochs of radio observations of Luhman 16AB with the Australia Telescope Compact Array in March and May 2013 and on a Chandra X-ray pointing carried out in November 2013 111We are also aware of observations of Luhman 16AB with the South African KAT-7 array at a wavelength of 20 cm, which took place over 7 hours on April 8, 2013 (R. Fender, private communication). The rms image noise is 4 mJy and there is no source near the expected position of the brown dwarf binary. Because of the factor of 1000 disparity in upper limit of the decimeter wavelength observations compared with the centimeter wavelength upper limits, we concentrate on the ATCA results in the following discussion.. These observations provide the most sensitive constraints to date on the radio and X-ray emission from ultracool dwarfs.
2 Observations
2.1 Radio Observations
| Frequency | Epoch | tint | beamsize | pos. angle | |
| GHz | YYYY-MM-DD | hrs | Jy | ”” | ∘ E of N |
| 5.5 | 2013-03-09 | 9 | 6.5 | 2.31.2 | 7 |
| ” | 2013-05-02 | 6.5 | 8.5 | 2.71.3 | 28 |
| ” | both epochs | 15.5 | 5 | 2.11.3 | 5 |
| 9 | 2013-03-09 | 9 | 7.5 | 1.40.8 | 7 |
| ” | 2013-05-02 | 6.5 | 15 | 2.00.8 | 19 |
| ” | both epochs | 15.5 | 6.8 | 1.40.8 | 3 |

Luhman 16AB was observed twice with the ATCA: in the 6A configuration (baselines of 0.337–5.94 km) on 09 March 2013 and again with the 6C configuration (baselines of 0.153–6.0 km) on 02 May 2013 (UT). Continuum mode observations were taken on both dates in dual-sideband mode simultaneously at 5.5 GHz and 9.0 GHz. The Compact Array Broadband Backend (CABB Wilson et al., 2011) was used with 2 GHz bandwidth per observing frequency and 2048 channels each 1 MHz wide. The gain calibrator QSO B103652 was used for both epochs, with primary flux calibrator QSO B1934638; Luhman 16AB was tracked in 10-minute intervals for both epochs. The flux calibrator was used also as the bandpass calibrator during the March observations, but RFI at early times during the May observations prevented it from also being used as a bandpass calibrator; instead a single scan of QSO B103652 taken at high elevation was used for bandpass calibration. All data were reduced using the AIPS package (Greisen, 2003) and best practices for wide-band data reduction. Table 1 lists the beam sizes for each epoch and frequency band.
Data at 5.5 and 9 GHz for each epoch were imaged separately and after being combined into a single data set per band; both Stokes I and V were searched for Luhman 16AB. We propagated the position at epoch MJD 55380.018731 by the proper motions given in Luhman (2013) to get the expected position coordinates (J2000 10 49 15.99 53 19 04.9 for March and 10 49 16.01 53 19 04.9 for May). There is only a 0.25” difference in the position between the two radio epochs. The error range for the expected position of Luhman 16AB is comprised of 0.75” from the binary separation, an upper limit of 0.5” from parallactic motions (likely smaller due to the two month separation of the epochs), 0.07” from position uncertainty (taken from Luhman, 2013), and 0.02” from propagating proper motion uncertainties stated in Luhman (2013). No source was found near the expected position for the brown dwarf pair in either epoch. Figure 1 shows the 5.5 GHz radio sky around this expected position, with a box of 1.6” encompassing the maximum of all the errors stated above. The nearest statistically detected source is 12.5” away, with a flux density at 5.5 GHz of 30 Jy. No bursty emission in Stokes I or V is evident in either of the bands in either epoch, in light curves with bin sizes of 60, 300, and 600 seconds (see e.g., Osten & Wolk, 2009). Details of the observations (and sensitivities derived from individual and combined epochs) are listed in Table 1. A 1 upper limit of 5 (6.8) Jy/beam at an observing frequency of 5.5 (9.0) GHz, and at a distance of 2pc, translates into a 3 radio luminosity upper limit of 7.21010 (9.81010) erg s-1 Hz-1 for Luhman 16AB.
2.2 X-ray observations
Chandra observed Luhman 16AB on 10 Nov 2013 for ks (ObsID 15705)
using the ACIS-S3 detector.
The data analysis was performed with the CIAO software
package222CIAO is made available by the CXC and can be downloaded
from
http://cxc.harvard.edu/ciao/download/ version 4.6.
The analysis started with the level 1 events file provided by the
Chandra X-ray Center (CXC).
In order to optimize the spatial resolution, pixel randomization was removed.
The events file was filtered on event grades
(retaining the standard grades , , , , and ),
and the standard good time interval file was used.
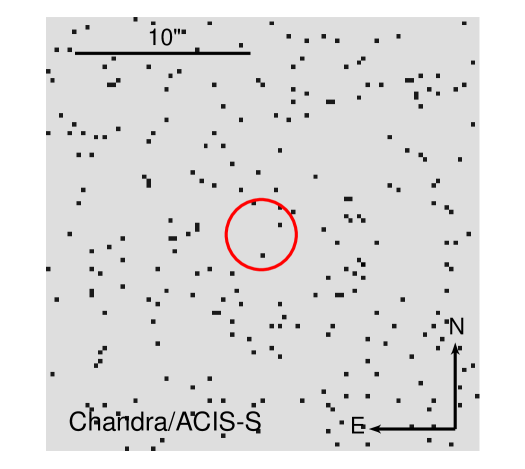
We determined the position of Luhman 16AB at the epoch of the Chandra observations using the proper motion given by Luhman (2013). The predicted coordinates are J2000 10 49 14.65 -53 19 05.2, and there is no evidence a of source at this location (see Figure 2). As discussed in Section 2.1, the uncertainty in the expected position is a maximum of 1.34”. For an on-axis source, 90% of the encircled energy lies within a radius of 2” (Chandra Proposer’s Observatory Guide), and we used this as our guide for establishing the spatial region in which to probe for any X-ray emission. The closest detected X-ray source is separated by from this position, with a total of 17 counts.
Calculation of an upper limit proceeded with estimation of the background rate at the position of Luhman 16AB. 90% of the encircled energy lies within 2′′ of the central pixel at an energy of 1.49 keV (Chandra Proposer’s Observatory Guide). Using an annulus extending from 2 around the position of Luhman 16AB, we calculate a mean background rate within 2′′ of the target, or 0.37 counts (0.2-2 keV) in 48.35 ks. We calculated the quantile distribution for a Poisson distribution with this intensity in the R statistical computing software package R Core Team (2012), and find an upper limit of 2 counts at a significance level of P=0.001; this corresponds to a confidence level of 99.9%, equivalent to a Gaussian sigma level of 3.09 (Gehrels, 1986). For the on-source exposure time of ks, the upper limit count rate is then cts/s. We calculated the count-to-flux conversion factor for a one-temperature thermal plasma (APEC model) with PIMMS333http://cxc.harvard.edu/toolkit/pimms.jsp and we verified that it is insensitive for reasonable assumptions on the plasma temperature considering the negligible absorption expected for the pc distance of Luhman 16AB. We thus constrain the X-ray luminosity in the 0.2-2 keV band to .
3 Discussion
3.1 Magnetic Activity Constraints for Luhman 16AB
The upper limits of Luhman 16AB presented in this work are the strongest constraints obtained so far for the radio and X-ray luminosity of any ultracool dwarf. We compute the radio and X-ray activity indices, and , making use of the bolometric luminosities given by Faherty et al. (2014) for both components of the binary. We evaluate the activity indices separately for the L7.5 and the T0.5 component, assuming that only one of the binary components is possibly magnetically active. However, the bolometric luminosities of Luhman 16A and 16B are almost the same and the error we make by using their average is likely smaller than the sum of all other uncertainties. We find (5.5 GHz), (9 GHz), and . Figure 3 puts these upper limits in the context of detections and upper limits for other ultracool dwarfs.
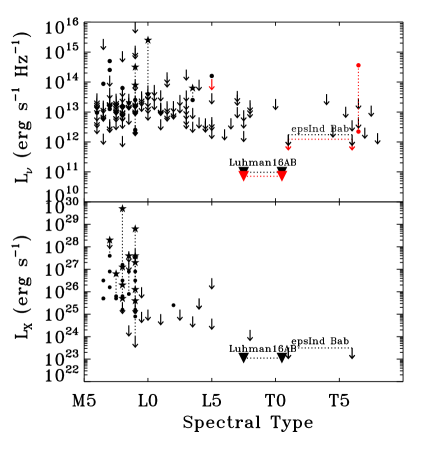
The upper limits at 5.5 and 9 GHz for Luhman 16AB from ATCA are a factor of 15 and 10, respectively, lower than the most sensitive upper limit of any other ultracool dwarf. The X-ray upper limit is about a factor of two deeper than previous sensitive upper limits. Ind Bab (T1+T6) is the next closest brown dwarf with sensitive limits on X-ray and radio emission, from Audard et al. (2005). At a distance of 3.6 pc, it is only a factor of 1.8 further away than Luhman 16AB, conveying about a factor of three difference in luminosity sensitivity, and measurements were made for both systems with the same radio and X-ray facilities: ATCA and the Chandra X-ray Observatory. The disparity in radio upper limits can largely be attributed to the increase in bandwidth available with the CABB on ATCA now (2 GHz) compared with what was available for Audard et al. (2005)’s observation (128 MHz).
3.2 Interpretation
We have presented the most sensitive upper limits on X-ray and radio emission for ultracool dwarfs to date. The T dwarf component has a measured rotation period of h (Gillon et al., 2013). Our X-ray limit for Luhman 16AB confirms for late L and T dwarfs the previous evidence gained from M/L dwarfs for a sharp drop of X-ray activity levels despite fast rotation. This absence of X-ray activity is most likely associated with the high electrical resistivities in such cool atmospheres which prevent the coupling of matter and magnetic field which is necessary to develop magnetic activity (Mohanty et al., 2002). Fleming et al. (1995) detected stellar coronal heating efficiencies (as measured by /Lbol) down to levels approximately a factor of five lower than our upper limit. Our upper limit is also consistent with the activity levels of the Sun at the highest points of its activity cycle, which reaches a maximum of in the 0.2-2.4 keV band (Peres et al., 2000).
As Figure 3 shows, there is a marked drop-off in the number of radio detections for objects later than mid-L, with a range of radio luminosities observed at a fixed spectral type. Detections of radio emission in ultracool dwarfs are often used to argue for the existence of strong magnetic fields. However, the inverse is not true: the lack of radio detection does not allow for a determination of magnetic field strengths in either of these objects, contrary to the statements made in Berger (2006) for upper limits on radio emission to a sample of ultracool dwarfs. Important conclusions regarding the physical extent of any emission can be drawn from the radio flux density upper limits in examination of the conditions under which these mechanisms operate.
The interpretation of the variable radio emission in ultracool dwarfs
has centered around the action of an electron-cyclotron maser operating in a region of high
magnetic field strength (Nichols et al., 2012). In this scenario, the observing frequency is tied
to the electron-cyclotron frequency in the emitting region and is related to
B (MHz) by for harmonic number equal to 1 or 2, implying
kG fields in the radio-emitting region detected at cm wavelengths, and consistent with extrapolations
from convection-driven geodynamo scaling laws (Christensen et al., 2009).
The intensity of radio emission expected from a coherent process
such as this is not predictable based solely
on the number of emitting particles or magnetic field strength.
However, the high brightness temperatures required for coherent emission
(usually taken to be T1012K; Kellermann & Pauliny-Toth, 1969)
coupled with the
radio flux density upper limit and observing frequency sets a stringent upper limit on
the size scale of any radio-emitting region.
Rewriting the standard equation (Dulk, 1985) for parameters applicable to the current
case, and taking the dwarf radius to be approximately 1 Jupiter radius, in line with
measurements (Sorahana et al., 2013),
leads to the following constraints:
| (1) |
where is the size of any radio-emitting region in units of ( is one Jupiter radius (=7.1109 cm)), is the distance to the dwarf in pc, is the observing frequency in GHz, SμJy is the flux density in Jy, and is the brightness temperature in K. Evaluated for the upper limits at the two frequencies (and assuming T1012K) gives 0.002 at 5.5 GHz, and 0.001 at 9 GHz. These are upper limits, as stellar phenomena have demonstrated the existence of brightness temperatures as high as T1018K (Osten & Bastian, 2008).
The upper limit on size holds if the conditions are right to produce coherent emission. Growth rates of the cyclotron maser instability are maximized in relatively rarefied, magnetized plasmas where the dimensionless ratio of the plasma frequency to the electron-cyclotron frequency is less than a few (Lee et al., 2013). The atmosphere calculations of Mohanty et al. (2002) showed that in the lower atmosphere, the total density for a dusty atmosphere model in a cool dwarf with Teff near 1500 K will be about 10-9 g cm-3, with an ionization fraction of about 10-11. This would suggest an electron density of approximately 103 cm-3. The kG field strengths for these objects derived from scaling laws, combined with these parameters, indicate that the conditions for the instability may exist, but the cyclotron maser mechanism could be inoperable for reasons still to be determined. Mutel et al. (2007) found a strong dependence of the growth rates of the cyclotron maser instability on the opening angle of the loss cone distribution of electrons that could power the instability. Beaming effects may also explain the lack of detections, if there is a misalignment between the opening angle of the emission and the line of sight.
Another possibility that has been put forward to explain the quiescent radio emission from ultracool dwarfs is gyrosynchrotron emission, in analogy with the magnetic activity seen in higher mass dwarf stars (Güdel, 2002). For this incoherent process, the strength of the emission depends not only on the magnetic field strength in the radio-emitting source, but also on the index of the distribution of accelerated particles with energy (), and the size of the emitting region. Figure 4 displays the values of , , and size of the emitting source that are compatible with the observed upper limit on flux density at the two radio frequencies, given the limit of applicability of the analytic expressions in Dulk (1985). While the constraints on size are not as stringent as for the case of a coherent emission, they do rule out a global gyrosynchrotron-emitting magnetosphere around one of the dwarfs in the Luhman 16AB system, as this would lead to detectable levels of gyrosynchrotron emission.

Our discussion has concentrated mainly on steady-levels of emission. The observation of radio bursts in a relatively small sample of all radio-observed UCDs combined with the small rotation period of the known radio bursters has given rise to the discussion of selection effects, e.g., the typical length of the radio observations (few hours) may not have covered the – generally unknown – full rotational cycle of many UCDs (Stelzer et al., 2012). This bias can be ruled out here. Multiple rotation periods of the T0.5 dwarf were covered with our radio data, so the observations were sensitive to bursts occurring at particular rotation phases. Yet, the viewing geometry and/or topology of the magnetic field may prevent the detection of such bursts if present on Luhman 16AB. Limits presented here are likely unachievable for other ultracool dwarfs in the near future, only to be exceeded possibly by measurements from the Athena mission (for X-rays) and the Square Kilometer Array or Next Generation Very Large Array future radio telescopes.
References
- Ackerman & Marley (2001) Ackerman, A. S., & Marley, M. S. 2001, ApJ, 556, 872
- Audard et al. (2005) Audard, M., Brown, A., Briggs, K. R., et al. 2005, ApJ, 625, L63
- Berger (2006) Berger, E. 2006, ApJ, 648, 629
- Berger et al. (2010) Berger, E., Basri, G., Fleming, T. A., et al. 2010, ApJ, 709, 332
- Burgasser et al. (2002) Burgasser, A. J., Marley, M. S., Ackerman, A. S., et al. 2002, ApJ, 571, L151
- Burgasser et al. (2013a) Burgasser, A. J., Melis, C., Zauderer, B. A., & Berger, E. 2013a, ApJ, 762, L3
- Burgasser et al. (2013b) Burgasser, A. J., Sheppard, S. S., & Luhman, K. L. 2013b, ApJ, 772, 129
- Christensen et al. (2009) Christensen, U. R., Holzwarth, V., & Reiners, A. 2009, Nature, 457, 167
- Clarke et al. (2003) Clarke, F. J., Tinney, C. G., & Hodgkin, S. T. 2003, MNRAS, 341, 239
- Cook et al. (2014) Cook, B. A., Williams, P. K. G., & Berger, E. 2014, ApJ, 785, 10
- Crossfield et al. (2014) Crossfield, I. J. M., Biller, B., Schlieder, J. E., et al. 2014, Nature, 505, 654
- Dulk (1985) Dulk, G. A. 1985, ARA&A, 23, 169
- Faherty et al. (2014) Faherty, J. K., Beletsky, Y., Burgasser, A. J., et al. 2014, ApJ, 790, 90
- Fleming et al. (1995) Fleming, T. A., Schmitt, J. H. M. M., & Giampapa, M. S. 1995, ApJ, 450, 401
- Gehrels (1986) Gehrels, N. 1986, ApJ, 303, 336
- Gelino et al. (2002) Gelino, C. R., Marley, M. S., Holtzman, J. A., Ackerman, A. S., & Lodders, K. 2002, ApJ, 577, 433
- Gillon et al. (2013) Gillon, M., Triaud, A. H. M. J., Jehin, E., et al. 2013, A&A, 555, L5
- Greisen (2003) Greisen, E. W. 2003, Information Handling in Astronomy - Historical Vistas, 285, 109
- Güdel (2002) Güdel, M. 2002, ARA&A, 40, 217
- Harding et al. (2013) Harding, L. K., Hallinan, G., Konopacky, Q. M., et al. 2013, A&A, 554, A113
- Kellermann & Pauliny-Toth (1969) Kellermann, K. I., & Pauliny-Toth, I. I. K. 1969, ApJ, 155, L71
- Lane et al. (2007) Lane, C., Hallinan, G., Zavala, R. T., et al. 2007, ApJ, 668, L163
- Lee et al. (2013) Lee, S.-Y., Yi, S., Lim, D., et al. 2013, Journal of Geophysical Research (Space Physics), 118, 7036
- Luhman (2013) Luhman, K. L. 2013, ApJ, 767, L1
- Marley et al. (2010) Marley, M. S., Saumon, D., & Goldblatt, C. 2010, ApJ, 723, L117
- McLean et al. (2012) McLean, M., Berger, E., & Reiners, A. 2012, ApJ, 746, 23
- Mohanty et al. (2002) Mohanty, S., Basri, G., Shu, F., Allard, F., & Chabrier, G. 2002, ApJ, 571, 469
- Mutel et al. (2007) Mutel, R. L., Peterson, W. M., Jaeger, T. R., & Scudder, J. D. 2007, Journal of Geophysical Research (Space Physics), 112, 7211
- Nichols et al. (2012) Nichols, J. D., Burleigh, M. R., Casewell, S. L., et al. 2012, ApJ, 760, 59
- Osten & Bastian (2008) Osten, R. A., & Bastian, T. S. 2008, ApJ, 674, 1078
- Osten & Wolk (2009) Osten, R. A., & Wolk, S. J. 2009, ApJ, 691, 1128
- Peres et al. (2000) Peres, G., Orlando, S., Reale, F., Rosner, R., & Hudson, H. 2000, ApJ, 528, 537
- R Core Team (2012) R Core Team, 2012, R: A language and environment for statistical computing. R Foundation for Statistical Computing, Vienna, Austria. ISBN 3-900051-07-0, URL http://www.R-project.org
- Route & Wolszczan (2012) Route, M., & Wolszczan, A. 2012, ApJ, 747, L22
- Sorahana et al. (2013) Sorahana, S., Yamamura, I., & Murakami, H. 2013, ApJ, 767, 77
- Stelzer et al. (2012) Stelzer, B., Alcalá, J., Biazzo, K., et al. 2012, A&A, 537, A94
- Williams et al. (2013) Williams, P. K. G., Berger, E., & Zauderer, B. A. 2013, ApJ, 767, L30
- Williams et al. (2014) Williams, P. K. G., Cook, B. A., & Berger, E. 2014, ApJ, 785, 9
- Wilson et al. (2011) Wilson, W. E., Ferris, R. H., Axtens, P., et al. 2011, MNRAS, 416, 832