G2C2 - IV: A novel approach to study the radial distributions of multiple populations in Galactic globular clusters
Abstract
We use the HB morphology of 48 Galactic GCs to study the radial distributions of the different stellar populations known to exist in globular clusters. Assuming that the (extremely) blue HB stars correspond to stars enriched in Helium and light elements, we compare the radial distributions of stars selected according to colour on the HB to trace the distribution of the secondary stellar populations in globular clusters. Unlike other cases, our data show that the populations are well mixed in 80% of the cases studied. This provides some constraints on the mechanisms proposed to pollute the interstellar medium in young globular clusters.
keywords:
Galactic Globular Clusters1 Introduction
Globular clusters are now known to host multiple stellar populations, differing in their light element abundances, although iron and heavier elements tend to be largely homogeneous (e.g., Gratton et al. 2012 for a review). It is likely that production of light elements is accompanied by enrichment in Helium as well, where Na-rich stars from the second generations are more He-rich than the Na-poor and O-rich first generation (FG) stars (e.g. Carretta et al., 2007). The secondary stellar generations (SG) must have been formed during a later starburst, from material polluted by the ejecta of massive stars in the original stellar population. Candidate polluters include: intermediate mass AGB stars (Izzard et al., 2006; D’Antona & Ventura, 2007), fast rotating massive stars (Decressin et al., 2007; Krause et al., 2012, 2013), ejecta from massive binaries (de Mink et al., 2009) and early disk accretion (Bastian et al., 2013) where the ejecta from massive stars are accreted onto forming low-mass protostars at early times.
It is generally difficult to distinguish between these scenarios purely on the basis of the observed abundance patterns, as they all share common characteristics, such as pollution by the products of hot bottom burning in massive systems. However, it may be possible to constrain these models via their effects on the radial distribution of polluted stars, i.e, the first and later generations. In general, we expect that more enriched stars will tend to reside closer to the cluster centres, as the gas needed to fuel star formation tends to sink to the cluster core (e.g., D’Ercole et al. 2008). In the early disk accretion model, the protostellar disks accrete material as they travel through the cluster and therefore one expects a somewhat broader distribution. On the other hand, the He-enhanced stars may lose more mass during the RGB phase and diffuse outwards because of two-body relaxation, yielding a more extended distribution (Carretta et al., 2009). The radial distribution of stars in clusters may be altered by dynamical evolution. However, simulations by Vesperini et al. (2013) predict that in many Galactic clusters the second generations should still be more centrally concentrated than the first generation. Opposite, Decressin et al. (2008, 2010) argue that any original radial difference is erased after a Hubble time because the relaxation times are much shorter than the ages of globular clusters.
Observationally, Lardo et al. (2011) have used the colour to separate red giants belonging to each population (cf. Milone et al. 2008) and show that the UV-faint, Na-rich second generation stars are more centrally concentrated. Carretta et al. (2009) divide their spectroscopic sample into primordial, intermediate and extreme stars based on the degree of enrichment in Na and O abundances and show that the intermediate stars are more centrally concentrated, followed by the primordial and then the extreme subpopulations, although Lardo et al. (2011) criticise the ad hoc selection of targets. In our previous studies we have shown how selecting red giants in the crowded central regions of globular clusters can be difficult and how their photometry may be doubtful, especially from small telescopes and in mediocre seeing conditions (Renzini, 1998; Vanderbeke et al., 2014a, b). It is perhaps suggestive that the two least crowded systems in Lardo et al. (2011) are those that show no evidence of radial gradients in the distribution of stellar populations. Other studies argue that second generation stars may reside closer to cluster centres than first generation stars (e.g. Sollima et al., 2007; Carretta et al., 2010a; Kravtsov et al., 2011; Johnson & Pilachowski, 2012), still reflecting the initial segregation. However, Dalessandro et al. (2014) combined optical and near-UV photometry to study the sub-giant and red giant branches of NGC 6362. They concluded that the FG and SG stars share the same radial distribution, making it the first system where stars from different populations are found to be completely spatially mixed.
Previous work has used RGB stars as tracers, either from their colours or direct spectroscopy (e.g. Sbordone et al., 2011). Here we propose a different approach, based on the distribution of stars on the horizontal branch (HB). The dominant parameter determining the HB morphology is the metal abundance (e.g., Arp et al., 1952; Sandage, 1953), while other parameters like age, Helium enrichment and mass loss, to name a few, may produce anomalously red or blue HBs (the ”second parameter problem” – e.g., Dotter et al. 2010). Helium abundance variations are linked to the observed light element enhancements for the multiple generations in globular clusters (e.g. Carretta et al., 2006; D’Antona & Ventura, 2007; Salaris et al., 2008; Villanova et al., 2009; Marino et al., 2011; Villanova et al., 2012; Monelli et al., 2013; Salaris et al., 2013; Milone et al., 2014; Gratton et al., 2014; Mucciarelli et al., 2014; Gratton et al., 2015; Milone, 2015) and may be taken to trace abundance variations in CNONa, even if these by themselves may not affect the morphology of the HB.
Carretta et al. (2010b) show that the maximum temperature of the HB correlates with the range of Na/O abundance in red giants. D’Antona et al. (2005) and Iannicola et al. (2009) compare their data on NGC 2808 with synthetic models and demonstrate how the He abundance increases bluewards along the HB in their colour-magnitude diagrams (CMDs). The models of Joo & Lee (2013) also link the HB morphology directly to He enrichment and the presence of multiple stellar generations, although this is a 2nd order effect on the dominant metallicity which is the 1st parameter affecting the HB. Marino et al. (2011) find that in M4 the red HB (RHB) stars are O-rich and Na-poor, while the blue HB (BHB) stars are O-poor and Na-rich; the abundance patterns suggest that the elements were produced during hot bottom burning via the CNO cycle and its high temperature NeNa and MgAl branchings (e.g., Clayton, 1968) and the resulting stars will also be Helium enhanced. Therefore, the distribution of stars on the blue HB within each cluster may be used as a proxy for the distribution of stars belonging to each generation.
We exploit the relation between light element enrichment and HB morphology, mediated by He abundance, to study the spatial distribution of stellar populations selected on the HB. We essentially take temperature ’cuts’ along the HB and argue that these correspond to increasing contributions from He-enriched secondary generations of stars. For example, Iannicola et al. (2009) can separate the HB of NGC 2808 into three groups, each assumed to correspond to the three (or more) main sequences observed by Piotto et al. (2007). Observations in near ultraviolet generally show numerous gaps on HBs (Iannicola et al., 2009), even if these are continuous in the optical, and these may be used to separate the multiple stellar generations. Iannicola et al. (2009) selected about 2000 HB stars based on both ground-based and HST observations of NGC 2808. Relative fractions of cool, hot and extreme HB stars do not change radically along the radial profile of the cluster. Therefore, this is evidence against the presence of radial differences between stellar subpopulations with different He abundances. Kunder et al. (2013) studied the cumulative fraction of extreme HB stars in M 22 (NGC 6656) but could not draw strong conclusions regarding differences in the radial distributions of blue and extremely blue HB (EHB) stars. Gratton et al. (2014) studied M 22’s HB spectroscopically and find some suggestive evidence that SG stars are more concentrated than FG stars. However, their study does not cover the extreme HB stars, due to the restrictions on the temperature range.
Here we use our Galactic Globular Cluster Catalog (G2C2) photometry (Vanderbeke et al. 2014a, b, see Vanderbeke et al. 2015, in preparation, for a discussion of the colour-magnitude diagrams of all clusters in the G2C2 sample) to address this issue. Our large and homogeneous photometry is sufficiently deep that we can trace the HB to the level of the main sequence turnoff in almost all clusters and allow us to study the radial distributions of stars at distances beyond several core radii from the cluster centre in many instances (the CTIO FOV is 13.6′on the side and has a resolution of 0.396″per pixel). The main goal of this study is to use the distribution of stars on the HB as a proxy for the distribution of stellar populations and use these stars to trace the radial density profile of the various stellar generations. We wish to test whether second generation stars are more centrally concentrated than the more primordial objects and if possible consider the effects of dynamical evolution over the past Hubble time. Our homogeneous and wide-field photometry proves ideal for this task.
2 Sample selection and methodology
The basic data for this paper derive from our homogeneous photometry of Galactic globular clusters in Papers I and II (Vanderbeke et al., 2014a, b). The full colour-magnitude diagrams for these clusters will be fully discussed in a subsequent publication.
Because we are interested in identifying objects with extended HBs, and using colour cuts on the HB to select stars in temperature ranges so that each group contains stars from the primordial or secondary generations, we focus on clusters whose HBs have blueward extensions (see e.g. Mackey & van den Bergh, 2005; Lee et al., 2007; Dotter et al., 2010). In Fig. 1 we present histograms of the HB indices of the GCs studied in this paper. We included all GCs where the HB index is larger than 0.7, whenever good quality data (deep CMDs, low contamination) was available.
While blue stragglers may contaminate counts of extreme HB stars, in most cases only the hottest and more massive blue stragglers would be confused with HB stars, and these are generally very few in number. The location of the field stars in the CMD varies from cluster to cluster. However, the coinciding HB region would appear less centrally concentrated by the field star contamination.
Some clusters with rather red HB morphologies were also included, because these GCs either belong to a second parameter pair (e.g. NGC 362, NGC 6171), or there is existing evidence of multiple populations with differing radial distributions (e.g. NGC 104, NGC 6362), or visual inspection revealed some BHB/EHB stars though the HB is strongly dominated by the RHB (e.g. NGC 1261).


After correcting our CMDs for foreground extinction using the Cardelli et al. (1989) reddening law (using values from the 2010 version of Harris 1996), we subdivide the HB in ranges, according to colour, where the first or second generation stars are expected to prevail (cf., Iannicola et al. 2009; Marino et al. 2011). This is unfortunately not straightforward when using optical colours. Joo & Lee (2013) predict different colours for the different generations residing in M 22 (NGC6656) and NGC1851 and show that the generations can have partly overlapping colour and magnitude ranges. Therefore, every possible cut will only be an approximate separation of the populations. In this study we make the assumption that the majority of RHB/BHB stars represent the stars with primordial abundances, while the majority of EHB stars correspond to the enriched population. Either sample is of course contaminated to some extent.
For the sake of homogeneity, we define colour cuts which we will use systematically for all clusters using NGC 1851 to illustrate the different steps in our analysis (see Fig. 2). This cluster is known to host multiple stellar generations and is famous for its unusual bimodal HB morphology, double RGB and SGB, possible [Fe/H] spread, CN bimodality and variations in light and s-process element abundances (Saviane et al., 1998; Walker, 1998; Joo & Lee, 2013). Carretta et al. (2011) demonstrate that the metal-poor stars in their sample are more concentrated than the metal-rich stars.
Now we define colour cuts for the different HB subgroups. Dalessandro et al. (2011) showed the temperature distribution of NGC 2808 HB stars and found an effective temperature of about 7000 K as the limit between RHB and BHB stars, close to the blue edge of the RR Lyrae instability strip (Moni Bidin et al., 2012). This temperature corresponds to a black body colour of and was used as a vertical cut to separate RHB and BHB stars. The gap between BHB and EHB stars is located at about 20000K (Dalessandro et al., 2011; Moni Bidin et al., 2012). However, this corresponds to a black body colour of , which is bluer than any of the HB stars in our CMDs. Dalessandro et al. (2011) demonstrated that the EHB temperatures derived from a combination of optical filters only can be underestimated by 10000K and more (because HB sequences with different initial He mass fraction overlap for ). Therefore, we are forced to introduce an arbitrary colour cut below the ’bend’ of the HB at , corresponding to an effective temperature of 11000K. Because the HB becomes vertical at blue colours, we do not make a pure ”vertical” colour cut for the EHB stars. We fit a second degree polynomial to the HB stars and determine the line perpendicular to this polynomial passing through . In Fig. 3 we zoom in on the HB region of NGC 1851. We illustrate the fitting procedure by the solid line and the different cuts by the dashed lines.

Our CMDs are derived from data observed with small ground-based telescopes (both Sloan Digital Sky Survey (SDSS) and Cerro Tololo Inter-American Observatory (CTIO) 0.9m telescope), as presented in Vanderbeke et al. (2014a). Therefore, these suffer from incompleteness, especially close to the cluster centre. We show the number of stars as a function of distance from the cluster centre in annuli as a function of luminosity in Fig. 4. The HB spans a magnitude range , so we need similar completeness levels for that magnitude range. Therefore, we choose to consider only the HB stars beyond an inner limiting radius of 1.5′. In Fig. 4, the half-light radius is indicated with dashed line, the dotted line represents the radius where part of the annulus is outside the 13.6′ CTIO field of view. Note that the inner radial limit is well beyond the half-light radius. As the outer limiting radius, we choose 8′ (hence including almost the entire CTIO field of view).
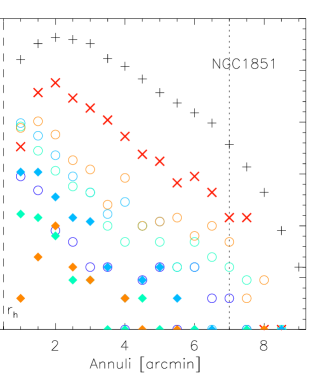
In general, we use all stars to determine the completeness at each radius. However, the total number of stars is dominated by the numerous RGB stars, while the focus of our study is on the HB stars, which are much bluer. Therefore, we still need to check that the total number of stars is representative to make the completeness cuts for the HB, so, that no bias for blue stars was introduced by the characteristics of the CCD. The filled symbols in Fig. 4 represent the HB stars within the given magnitude ranges. HB stars of different magnitude ranges within the previously determined inner and outer limits show similar completeness levels (although they suffer from low number statistics). Similar conclusions were drawn for another dozen clusters spanning a variety of globular cluster properties (including mass, HB morphology, etc.). Therefore, we conclude that we can safely use all the stars, even if dominated by the RGB stars, to determine the completeness as a function of radius.
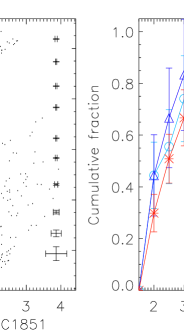
We define and colour-code the different HB regions in the left panel of Fig. 2 and compare the cumulative radial distributions of the stars between the inner and outer completeness radii in the right panel of the same figure. Similar figures for all other GCs can be found in the online appendix.
We perform a two-sided KS test to compare the radial distributions of the HB stars as defined above (RHB, BHB and EHB). The test returns no significant difference between the radial distributions of RHB, BHB and EHB stars. In Table 1 we show an extract of the KS statistics to guide the reader. The complete table can be found in the online appendix. Note that our sample also includes Cen (NGC 5139), an object that it is much more complex than a typical mono-metallic globular cluster (e.g., Villanova et al., 2014). A more detailed analysis of effects of the [Fe/H] spread on the HB selection criteria is beyond the scope of this study.
| ID | HB1 | HB2 | N1 | N2 | DKS | ProbKS | Fig. | |
| NGC104 | red | blue | 245 | 230 | 0.198 | 0.000 | 6 | CTIO |
| NGC288 | BHB | EHB | 17 | 67 | 0.345 | 0.061 | CTIO | |
| NGC362 | BHB | EHB | 10 | 26 | 0.223 | 0.814 | CTIO | |
| NGC362 | RHB | EHB | 67 | 26 | 0.372 | 0.008 | CTIO | |
| NGC362 | RHB | BHB | 67 | 10 | 0.301 | 0.344 | CTIO | |
| NGC1261 | BHB | EHB | 9 | 6 | 0.556 | 0.140 | CTIO | |
| NGC1261 | RHB | EHB | 93 | 6 | 0.226 | 0.897 | CTIO | |
| NGC1261 | RHB | BHB | 93 | 9 | 0.459 | 0.043 | CTIO | |
| NGC1851 | BHB | EHB | 27 | 18 | 0.222 | 0.603 | 2 | CTIO |
| NGC1851 | RHB | EHB | 57 | 18 | 0.202 | 0.583 | 2 | CTIO |
| NGC1851 | RHB | BHB | 57 | 27 | 0.183 | 0.526 | 2 | CTIO |
Saviane et al. (1998) also studied NGC 1851 and found evidence that the radial distribution of the blue HB stars is different from that of the red HB and sub-giant branch stars. Their Fig. 11 shows that blue horizontal branch stars are more centrally concentrated than red horizontal branch stars, while our figure suggests that only the EHB stars are slightly more concentrated than the RHB stars. Our KS statistics also indicate that the difference in cumulative radial distributions is not very significant. Saviane et al. (1998) also presented HST imagery for the inner 25 arc seconds. These data did not suggest any significant radial difference for the blue and red HB stars. Milone et al. (2009) also studied NGC 1851 and did not find any radial stellar population gradients, in agreement with our results.
3 Results
In Fig. 5 we show the distribution of the KS probabilities (from CTIO and SDSS data). The distribution of the KS probabilities relative to the EHB is given by the dashed histogram. The distribution is trimodal: in some clusters there are strong differences in the radial distribution of HB stars within each colour range; others show either mild or no differences.

More than 80% of the clusters do not show evidence for different radial distributions along their horizontal branch. This suggests that the different stellar populations have similar radial distributions once on the HB, at least for the considered radii, in contrast to the study by Lardo et al. (2011) who probed the red giant branch stars. Moreover, we find no significant radial distribution difference for several clusters for which Lardo et al. (2011) found differences in the radial distributions of first and second generation stars: NGC 5024, NGC 5904, NGC 6205, NGC 6341 and NGC 7089 (M 2). If the position of stars on the HB is related to their He abundance (and indirectly to the CNONa anomalies), this result is puzzling. In agreement with Lardo et al. (2011) we find no difference in the radial distributions of stars for NGC 5466, while in NGC 5272 we only find a small difference in radial distributions (Prob for the EHB comparisons), while Lardo et al. (2011) found a significant difference. For NGC 7078 we find a difference in the radial distributions for both the RHB-EHB and RHB-BHB comparisons as do Lardo et al. (2011). For NGC2808 we do not find a radial difference between RHB and EHB, in agreement with Iannicola et al. (2009). For NGC 6362, we found that RHB and BHB stars have the same radial distribution, agreeing with Dalessandro et al. (2014). However, the EHB stars are somehow more concentrated than the RGB stars (with Prob).
NGC 288, NGC 362 and NGC 6218 are particularly interesting objects (all with ), as these are the first known systems for which the second generation appears less concentrated than the first generation, based on our data. Photometric or spectroscopic follow-up studies are needed to confirm or disprove these radial distributions. Disc shocking may be a main contributor to the peculiar radial distributions of the different populations in NGC 288 (Kruijssen & Mieske, 2009).
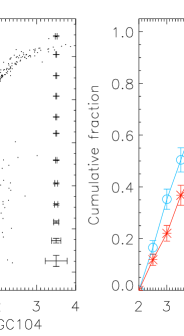
3.1 A pure red HB cluster: NGC 104
Gratton et al. (2013) demonstrated that only the reddest HB stars in NGC 104 (47 Tuc) can be considered as FG stars, the bluest ones are enriched in Na and depleted in O. In Fig. 6 we show the CMD and radial cumulative fractions for NGC 104. Although our ”standard” approach is tailored to clusters with extended HBs, it is possible to make an arbitrary cut in 47 Tuc and study the cumulative radial distributions. We recover the Gratton et al. (2013) result and find that the blue part of the RHB is statistically more centrally concentrated than the red part (with ). It further confirms the results of Nataf et al. (2011), who found evidence for a centrally concentrated, He-rich SG. However it may be an ad hoc result and one should apply this method to metal-rich or red HB clusters with caution, although the success of this experiment suggests that our approach does select ranges where one or the other population is more significant.
4 Summary
Our data show that the distribution of stellar populations is more complex than expected. While most GC formation scenarios predict that the second and further generations will have different radial distribution from the primordial cluster populations, usually in the sense of being more centrally concentrated, we find that there is little evidence that this is generally true, if we use HB stars as tracers of He enriched population, a feature that should accompany the light element enhancement typical of the secondary stellar generations.
Although in some cases we expect that the stellar populations will have been thoroughly mixed by dynamical evolution, including the possible effects of disk shocking, simulations of Vesperini et al. (2013) predict that original population gradients will not have been erased by the present time in many GCs.
In that respect, NGC 288, NGC 362 and NGC 6218 are of specific interest. For these systems, the HB stars linked with the second generation are significantly less concentrated than the RHB stars. Photometric or spectroscopic follow-up studies are needed to confirm or disprove these radial distributions.
One caveat on the present work is that we have to assume that the spread in colour on the HB in each cluster is due to variations in helium abundance and can be related to the various stellar generations known to be present in these objects. While this seems to be a reasonable assumption there are clusters where no helium variation is apparent on the HB, even though chemical anomalies and multiple populations are present.
Taken at face value, our results are not fully consistent with current enrichment scenarios dominated by AGB stars or fast rotating massive stars, as these would generally produce more highly concentrated second generation stars. Nevertheless, this points to the necessity of improving our theoretical understanding and modelling of multiple stellar populations in clusters, as well as defining a consensus tracer population. Hubble Space Telescope photometry (e.g. Piotto et al. 2015) allows to extend our analysis into the cluster centres and could potentially provide additional clues.
Acknowledgements
We thankfully acknowledge the anonymous referee for constructive comments that improved the content of the present study. JV acknowledges the support of ESO through a studentship. JV and MB acknowledge the support of the Fund for Scientific Research Flanders (FWO-Vlaanderen). J.A.-G. acknowledges support from Proyecto Fondecyt Postdoctoral 3130552. The authors are grateful to CTIO for the hospitality and the dedicated assistance during the numerous observing runs.
References
- Arp et al. (1952) Arp H. C., Baum W. A., Sandage A. R., 1952, AJ, 57, 4
- Bastian et al. (2013) Bastian N., Lamers H. J. G. L. M., de Mink S. E., Longmore S. N., Goodwin S. P., Gieles M., 2013, MNRAS, 436, 2398
- Cardelli et al. (1989) Cardelli J. A., Clayton G. C., Mathis J. S., 1989, ApJ, 345, 245
- Carretta et al. (2010a) Carretta E., Bragaglia A., D’Orazi V., Lucatello S., Gratton R. G., 2010a, A&A, 519, A71
- Carretta et al. (2009) Carretta E., Bragaglia A., Gratton R. G., et al., 2009, A&A, 505, 117
- Carretta et al. (2010b) Carretta E., Bragaglia A., Gratton R. G., et al., 2010b, A&A, 516, A55
- Carretta et al. (2006) Carretta E., Bragaglia A., Gratton R. G., Leone F., Recio-Blanco A., Lucatello S., 2006, A&A, 450, 523
- Carretta et al. (2011) Carretta E., Lucatello S., Gratton R. G., Bragaglia A., D’Orazi V., 2011, A&A, 533, A69
- Carretta et al. (2007) Carretta E., Recio-Blanco A., Gratton R. G., Piotto G., Bragaglia A., 2007, ApJ Letters, 671, L125
- Clayton (1968) Clayton D. D., 1968, Principles of stellar evolution and nucleosynthesis
- Dalessandro et al. (2014) Dalessandro E., Massari D., Bellazzini M., et al., 2014, ApJ Letters, 791, L4
- Dalessandro et al. (2011) Dalessandro E., Salaris M., Ferraro F. R., et al., 2011, MNRAS, 410, 694
- D’Antona et al. (2005) D’Antona F., Bellazzini M., Caloi V., Pecci F. F., Galleti S., Rood R. T., 2005, ApJ, 631, 868
- D’Antona & Ventura (2007) D’Antona F., Ventura P., 2007, MNRAS, 379, 1431
- de Mink et al. (2009) de Mink S. E., Pols O. R., Langer N., Izzard R. G., 2009, A&A, 507, L1
- Decressin et al. (2010) Decressin T., Baumgardt H., Charbonnel C., Kroupa P., 2010, A&A, 516, A73
- Decressin et al. (2008) Decressin T., Baumgardt H., Kroupa P., 2008, A&A, 492, 101
- Decressin et al. (2007) Decressin T., Meynet G., Charbonnel C., Prantzos N., Ekström S., 2007, A&A, 464, 1029
- D’Ercole et al. (2008) D’Ercole A., Vesperini E., D’Antona F., McMillan S. L. W., Recchi S., 2008, MNRAS, 391, 825
- Dotter et al. (2010) Dotter A., Sarajedini A., Anderson J., et al., 2010, ApJ, 708, 698
- Gratton et al. (2012) Gratton R. G., Carretta E., Bragaglia A., 2012, A&AR, 20, 50
- Gratton et al. (2013) Gratton R. G., Lucatello S., Sollima A., et al., 2013, A&A, 549, A41
- Gratton et al. (2014) Gratton R. G., Lucatello S., Sollima A., et al., 2014, A&A, 563, A13
- Gratton et al. (2015) Gratton R. G., Lucatello S., Sollima A., et al., 2015, A&A, 573, A92
- Harris (1996) Harris W. E., 1996, AJ, 112, 1487
- Iannicola et al. (2009) Iannicola G., Monelli M., Bono G., et al., 2009, ApJ Letters, 696, L120
- Izzard et al. (2006) Izzard R. G., Dray L. M., Karakas A. I., Lugaro M., Tout C. A., 2006, A&A, 460, 565
- Johnson & Pilachowski (2012) Johnson C. I., Pilachowski C. A., 2012, ApJ Letters, 754, L38
- Joo & Lee (2013) Joo S.-J., Lee Y.-W., 2013, ApJ, 762, 36
- Krause et al. (2013) Krause M., Charbonnel C., Decressin T., Meynet G., Prantzos N., 2013, A&A, 552, A121
- Krause et al. (2012) Krause M., Charbonnel C., Decressin T., Meynet G., Prantzos N., Diehl R., 2012, A&A, 546, L5
- Kravtsov et al. (2011) Kravtsov V., Alcaíno G., Marconi G., Alvarado F., 2011, A&A, 527, L9
- Kruijssen & Mieske (2009) Kruijssen J. M. D., Mieske S., 2009, A&A, 500, 785
- Kunder et al. (2013) Kunder A., Stetson P. B., Cassisi S., et al., 2013, AJ, 146, 119
- Lardo et al. (2011) Lardo C., Bellazzini M., Pancino E., Carretta E., Bragaglia A., Dalessandro E., 2011, A&A, 525, A114
- Lee et al. (2007) Lee Y.-W., Gim H. B., Casetti-Dinescu D. I., 2007, ApJ Letters, 661, L49
- Mackey & van den Bergh (2005) Mackey A. D., van den Bergh S., 2005, MNRAS, 360, 631
- Marino et al. (2011) Marino A. F., Villanova S., Milone A. P., et al., 2011, ApJ Letters, 730, L16
- Milone (2015) Milone A. P., 2015, MNRAS, 446, 1672
- Milone et al. (2008) Milone A. P., Bedin L. R., Piotto G., et al., 2008, ApJ, 673, 241
- Milone et al. (2014) Milone A. P., Marino A. F., Dotter A., et al., 2014, ApJ, 785, 21
- Milone et al. (2009) Milone A. P., Stetson P. B., Piotto G., et al., 2009, A&A, 503, 755
- Monelli et al. (2013) Monelli M., Milone A. P., Stetson P. B., et al., 2013, MNRAS, 431, 2126
- Moni Bidin et al. (2012) Moni Bidin C., Villanova S., Piotto G., Moehler S., Cassisi S., Momany Y., 2012, A&A, 547, A109
- Mucciarelli et al. (2014) Mucciarelli A., Lovisi L., Lanzoni B., Ferraro F. R., 2014, ApJ, 786, 14
- Nataf et al. (2011) Nataf D. M., Gould A., Pinsonneault M. H., Stetson P. B., 2011, ApJ, 736, 94
- Piotto et al. (2007) Piotto G., Bedin L. R., Anderson J., et al., 2007, ApJ Letters, 661, L53
- Piotto et al. (2015) Piotto G., Milone A. P., Bedin L. R., et al., 2015, AJ, 149, 91
- Renzini (1998) Renzini A., 1998, AJ, 115, 2459
- Salaris et al. (2008) Salaris M., Cassisi S., Pietrinferni A., 2008, ApJ Letters, 678, L25
- Salaris et al. (2013) Salaris M., de Boer T., Tolstoy E., Fiorentino G., Cassisi S., 2013, A&A, 559, A57
- Sandage (1953) Sandage A. R., 1953, AJ, 58, 61
- Saviane et al. (1998) Saviane I., Piotto G., Fagotto F., Zaggia S., Capaccioli M., Aparicio A., 1998, A&A, 333, 479
- Sbordone et al. (2011) Sbordone L., Salaris M., Weiss A., Cassisi S., 2011, A&A, 534, A9
- Sollima et al. (2007) Sollima A., Ferraro F. R., Bellazzini M., Origlia L., Straniero O., Pancino E., 2007, ApJ, 654, 915
- Stetson (1987) Stetson P. B., 1987, PASP, 99, 191
- Vanderbeke et al. (2014a) Vanderbeke J., West M. J., De Propris R., et al., 2014a, MNRAS, 437, 1725
- Vanderbeke et al. (2014b) Vanderbeke J., West M. J., De Propris R., et al., 2014b, MNRAS, 437, 1734
- Vesperini et al. (2013) Vesperini E., McMillan S. L. W., D’Antona F., D’Ercole A., 2013, MNRAS, 429, 1913
- Villanova et al. (2014) Villanova S., Geisler D., Gratton R. G., Cassisi S., 2014, ApJ, 791, 107
- Villanova et al. (2012) Villanova S., Geisler D., Piotto G., Gratton R. G., 2012, ApJ, 748, 62
- Villanova et al. (2009) Villanova S., Piotto G., Gratton R. G., 2009, A&A, 499, 755
- Walker (1998) Walker A. R., 1998, AJ, 116, 220