Stochasticity in pandemic spread over the World Airline Network explained by local flight connections
Abstract
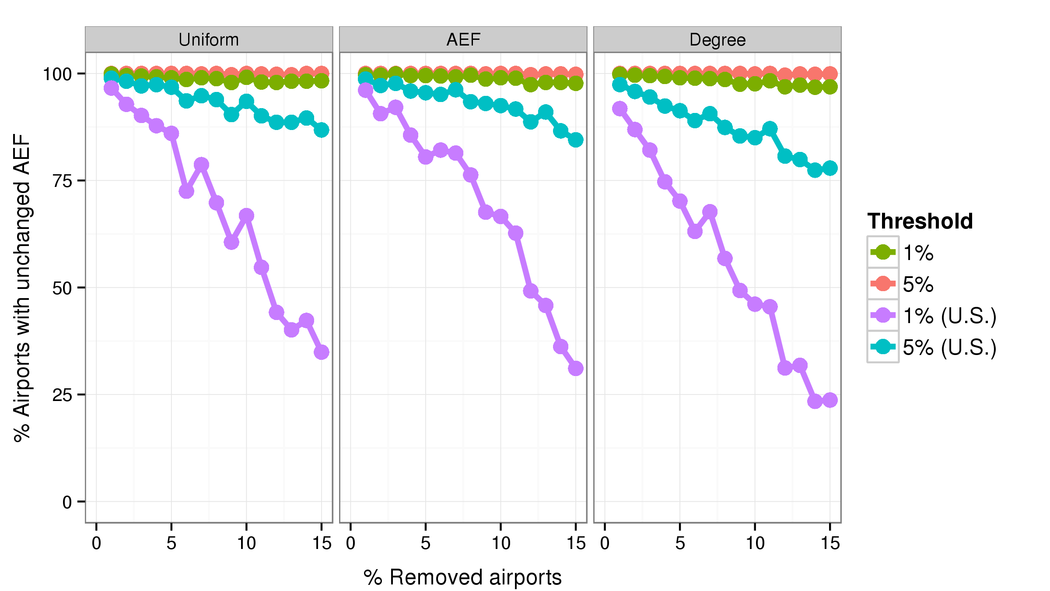
\parttitleBackground Massive growth in human mobility has dramatically increased the risk and rate of pandemic spread. Macro-level descriptors of the topology of the World Airline Network (WAN) explains middle and late stage dynamics of pandemic spread mediated by this network, but necessarily regard early stage variation as stochastic. We propose that much of early stage variation can be explained by appropriately characterizing the local topology surrounding the debut location of an outbreak. \parttitleMethods Based on a model of the WAN derived from public data, we measure for each airport the expected force of infection (AEF) which a pandemic originating at that airport would generate. We observe, for a subset of world airports, the minimum transmission rate at which a disease becomes pandemically competent at each airport. We also observe, for a larger subset, the time until a pandemically competent outbreak achieves pandemic status given its debut location. Observations are generated using a highly sophisticated metapopulation reaction-diffusion simulator under a disease model known to well replicate the 2009 influenza pandemic. The robustness of the AEF measure to model misspecification is examined by degrading the underlying model WAN. \parttitleResults AEF powerfully explains pandemic risk, showing correlation of 0.90 to the transmission level needed to give a disease pandemic competence, and correlation of 0.85 to the delay until an outbreak becomes a pandemic. The AEF is robust to model misspecification. For 97% of airports, removing 15% of airports from the model changes their AEF metric by less than 1%.
\parttitleConclusions Appropriately summarizing the size, shape, and diversity of an airport’s local neighborhood in the WAN accurately explains much of the macro-level stochasticity in pandemic outcomes.
keywords:
Research
Background
The world airline network (WAN) has massively increased the speed and scope of human mobility. This boon for humanity has also created an efficient global transport network for infectious disease [1, 2]. Pandemics can now occur more easily and more quickly than ever before. The accelerating emergence of novel pathogens exacerbates the situation [3]. Better understanding of global dispersal dynamics is a major challenge of our century [4]. Rapid assessment of an emerging outbreak’s dissemination potential is critical to response planning [5]. We do not know where the next pandemic threat might emerge. Mexico was not a prime candidate for an influenza outbreak, nor West Africa for Ebola. Preemptively mapping the pandemic influence of individual airports could contribute substantially to monitoring and response plans.
While exact relationships between the WAN and pandemic spread are difficult to model [2], simulation studies suggests that topological descriptors which describe epidemic outcomes on network models also have explanatory power for relationships between the topology of the WAN and pandemic spread [6, 7]. Observational studies of influenza [4, 8], malaria [9], and dengue fever [10] support this conclusion. Given the topology of a network, the minimal disease transmission rate which allows epidemics is given by the inverse of the spectral radius of a network’s adjacency matrix [11], and the typical outcome [12] and time course [13] of an epidemic follow a closed-form solution governed by the degree distribution of the network. The WAN’s topological structure is well characterized. It is a small-world, scale-free network with strong community structure, imposed partly by spatial constraints [14]. The majority of airports (70%) serve as bridges which connect a densely interconnected core of 73 major transport hubs (2%) to regional population centers and peripheral airports (28%) [15]. Nodes which connect communities can be distinct from high-degree nodes within communities [16]. Since the WAN is designed to optimize passenger flow, the network’s temporal structure has little effect at time scales relevant for pandemic spread [17].
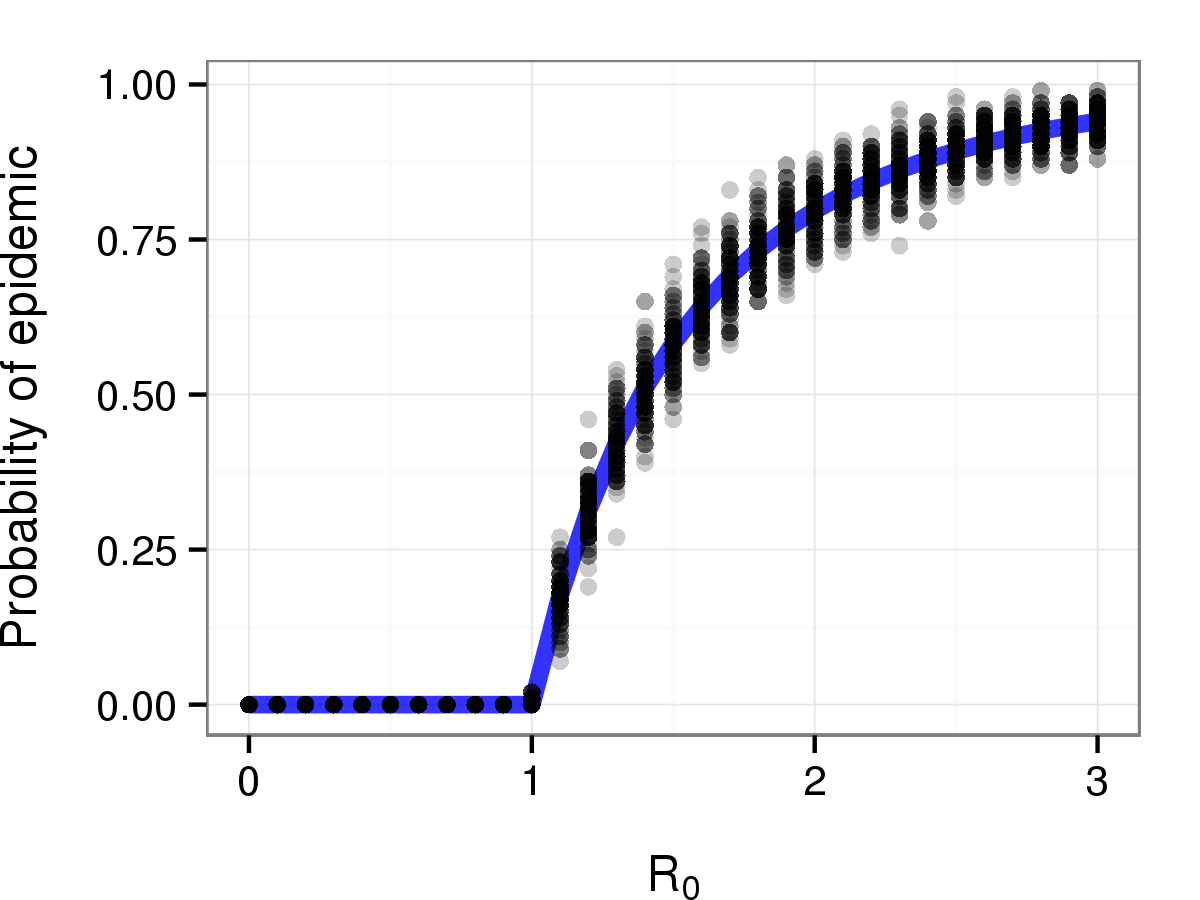
Topological descriptors of epidemic dynamics, however, can only describe typical outcomes. They do not describe the structure of the variation around the typical outcome, which is dismissed as stochastic when mentioned at all. Even within the constraints of a simple branching process model, empirical estimates of the probability of epidemic show substantial variation around the analytically derived solution, see Figure 1. Actual outcomes of emergent infectious diseases are crucially shaped by chance events in the early phases of their emergence [18]. Clear understanding of how seed location influences global outcomes would substantially improve public health planning [5].
The development of sophisticated, parameter-rich epidemic simulators provides powerful tools for exploring relationships between seed location and epidemic outcomes [19]. Common frameworks encompass demographic and mobility characteristics via either metapopulation [8, 20] or agent-based assumptions [21]. Careful tuning of these models has produced results which well match the spread of the 2009 influenza epidemic [19, 22]. Yet the complex interactions between model structure, input parameters, and estimation methods makes interpretation of model-based results challenging [18], especially when attempting to generalized to future outbreaks for which epidemic parameters are fundamentally unknowable. If, however, two radically different modeling approaches result in such high agreement both with each other and with reality [22] then the principal driver of outcomes should be expressible with a small parameter set [4]. Evidence suggests that simple probabilistic models incorporating local incidence, travel rates, and basic transmission parameters are sufficient to predict outcomes of complex metapopulation based simulations [23].
Recent theoretical work suggests that the apparent stochasticity in the early phases of a network-mediated epidemic process can be explained by the expectation of the force of infection of epidemic processes seeded from that node [24]. The aim of this study is to evaluate if this finding generalizes to realistic scenarios of WAN-mediated pandemic disease spread.
Methods
Defining and measuring ExF on the WAN
Our model of the WAN is based on the 2014 release of the Open Flights database [25]. We selected all airports serviced by regularly scheduled commercial flights, resulting in a list of 3,458 airports connected by 68,820 routes served by 171 different aircraft types. We simplify the network by replacing multiple routes between airports by a single edge whose weight is the sum of the available seats on all routes connecting the two airports, under the assumption that the aircraft type reflects the airline’s best judgment of the importance of the route. Aircraft seating capacity was estimated based on aircraft descriptions on worldtrading.net and airliners.net, using airlinecodes.co.uk to translate the IATA aircraft codes into aircraft type.
The expected force of a network node is defined as the expectation of the force of infection generated by an epidemic process seeded from the node into an otherwise fully susceptible network, after two transmission events and no recovery [24]. The force of infection in a network is directly proportionate to the current number of infected-susceptible edges or in a weighted network, the sum of all such edge weights. Its expectation after two transmission is given by the entropy of the distribution of this sum over all possible ways the first two transmission could occur. Applied to the WAN,
where is Airport i’s Expected Force, enumerates all possible ways to observe two transmissions seeded from , is the weighted degree of the transmission pattern multiplied by the probability that this pattern is observed given , and is the normalization of . We here further normalize AEF values to the range .
Epidemic outcomes are generated using the GLEaMvis simulator [8, 20]. GLEaMvis integrates real-world global population and mobility data with an individual based stochastic mathematical model of the infection dynamics to produce realistic simulations of the global spread of infectious diseases. Our basic experimental setup is to simulate the same disease model over a range of seed cities. The structure and parameters of the disease models are based on those which match the 2009 Influenza pandemic as reported in [8] and validated in [19], specifically, a Susceptible-Exposed-Infected-Recoverd (SEIR) model with transmission rate specified below, latency rate and recovery rate . Rates are expressed in units of days. The initial population distribution is 10% of the seed city infected and the remainder of the (world) population susceptible. Seasonality effects are not included, since their influence varies both by time and geographic latitude, masking variability attributable to seed location. GLEaMvis divides the world into sixteen regions. An outbreak is declared a pandemic on the day prevalence in at least three regions is greater than one per 100,000 inhabitants. The pattern the results is invariant to thresholds in the range per 100,000 inhabitants and to replacing the “three regions” criteria with “100 cities.” Results for each airport are reported in terms of the median over 20 runs (the maximum number supported by the public GLEaMvis client). If the threshold is not passed after 365 days (the maximum length supported by the public GLEaMvis client), we declare that no pandemic occurred.
Defining and measuring epidemic stochasticity
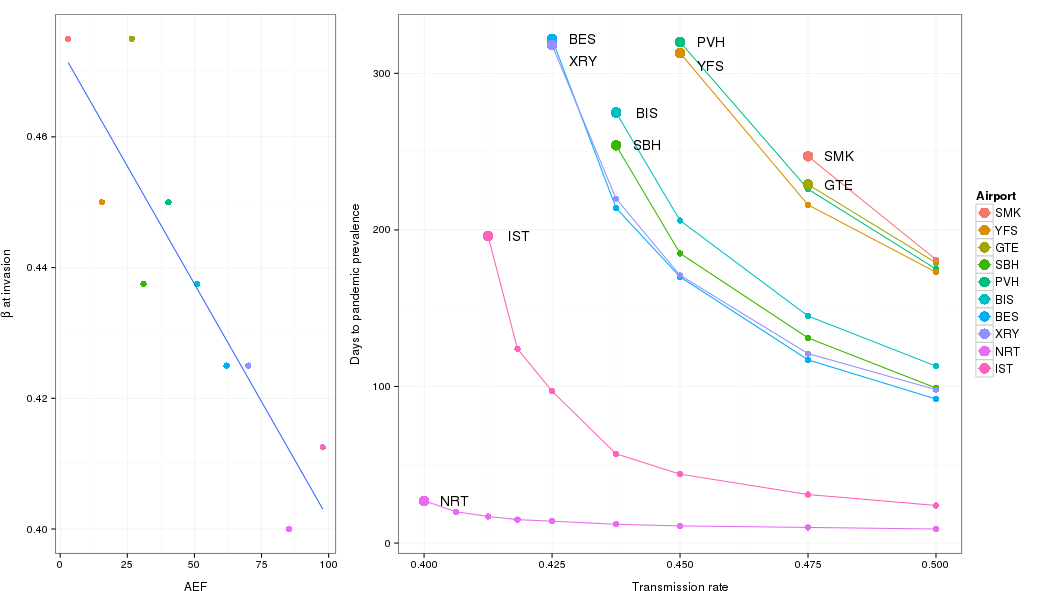
For an outbreak to become a pandemic, its basic reproductive number must surpass the basic epidemic threshold needed to establish a disease in a local population by a sufficient amount to also overcome finite subpopulation size effects and diffusion rates to neighboring populations. A branching process approximation suggests that invasion thresholds in metapopulation models depend on the outbreak’s value, the variance of the network’s degree distribution, and the mobility rate between subpopulations [7]. The GLEaMviz model specifies the last two values, reducing invasion thresholds to a function of . However, as shown in Figure 1, even a pure branching process shows substantial variability around the theoretical probability of achieving a large outbreak. For pandemics mediated by the WAN, the question of interest is how the invasion threshold varies for different airports. We empirically observe invasion thresholds on the WAN as follows. Ten seed airports are selected, one from each decile of the range of AEF values, see Table 1. The basic reproductive number is defined as , the transmission to recovery ratio. Keeping fixed, we vary over the range [0.4, 0.5], and observe which seeds trigger a pandemic at each value under the simulation framework described above. For , no simulations reached pandemic status, and for , all simulations resulted in a pandemic.
Often, diseases of concern are known to be competent of invading the network. Here, the outcome of interest is not if a pandemic occurs, but rather how long until an outbreak reaches pandemic status. We measure relationships between AEF and time to pandemic status as follows. One hundred world airports were chosen such that they evenly cover the range of measured AEF values. The simple SEIR model used previously is extended to the full model used by the GLEaMvis group to replicate the 2009 pandemic [8]. This estimates transmission rate as , well above the invasion threshold of determined empirically above. Further, the infected compartment of the SEIR model is divided into three categories: asymptomatic, symptomatic travelers, symptomatic non-travelers. These categories affect the mobility model, and non-symptomatic individuals have reduced transmissibility. For each seed location, we observe both the number of days until pandemic status is reached and the number of days until peak global incidence. Both outcomes are highly correlated, since once pandemic status is achieved further disease development is determined by network topology. The purpose of measuring peak global incidence is that this measure is unambiguous, while any definition of “first day of pandemic status” is somewhat arbitrary. A Shapiro-Wilks test of the observed times to peak global incidence suggests that this data is approximately normally distributed ( under the null hypothesis that the data is normally distributed), while the distribution of observations of first day of pandemic status is right-skewed ().
Relationships between outcomes and AEF are measured by Pearson correlation. We additionally test correlations to weighted and unweighted versions of each airport’s betweenness, degree, and eigenvalue centralities, and also to Verma et al’s t-core, a variant of the k-core which counts triangles [15].
Robustness of AEF to sampling error
The robustness of AEF values is examined by observing their relative change while progressively degrading the model WAN from which they are derived. The network is degraded by removing from one to 15 percent of U.S. airports from the network along with their associated edges. Community-based analysis of the WAN suggest that US airports form one large community [15, 16]. The AEF of all remaining world airports is computed. Three different random removal schemes were used: uniform over all airports, selection weighted by airport degree, selection weighted by AEF. The resulting AEF values are compared with the original AEF values. We record the number of airports whose degraded AEF departs from its original AEF by more than 1% and by more than 5%. Reported results are the average over ten runs, and show the amount of degradation for both U.S. and non-U.S. airports.
Results
The AEF of the seed location is strongly predictive of an outbreak’s invasive threshold as shown in Figure 2 and Table 1. The correlation between AEF and the minimal observed transmission rate at which it first became pandemically competent was 0.90 (95% confidence interval: 0.98,0.62). Tokyo was a notable outlier, achieving pandemic competence earlier than predicted from its AEF value.
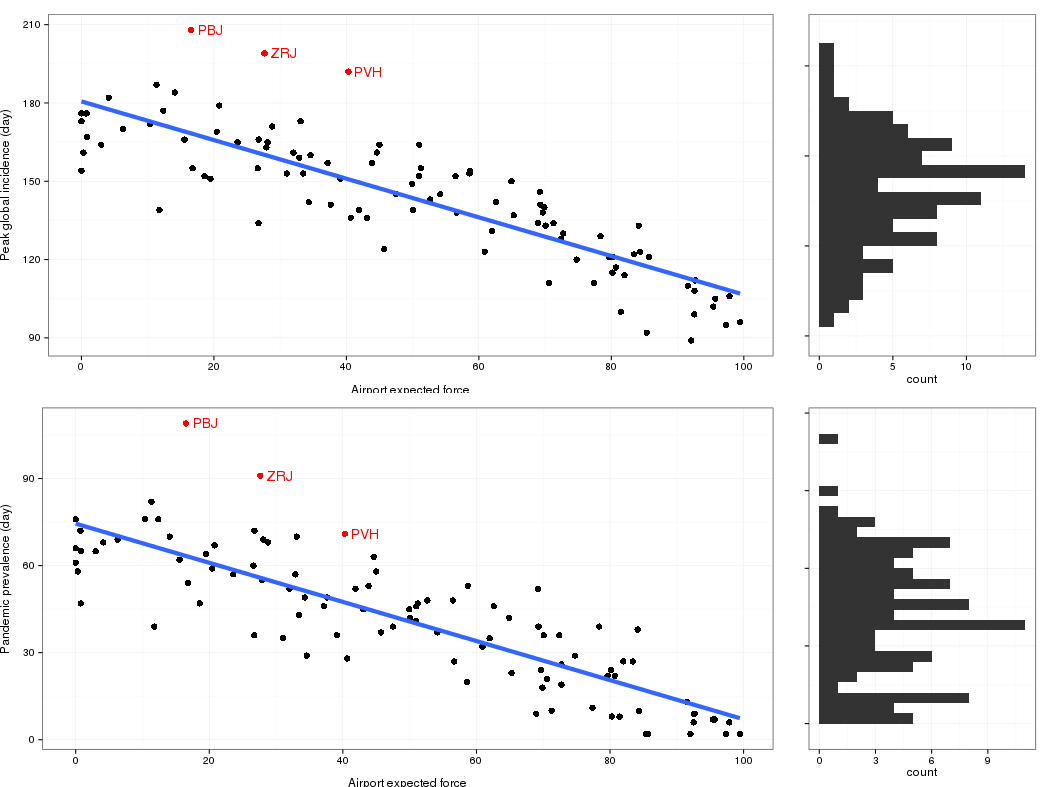
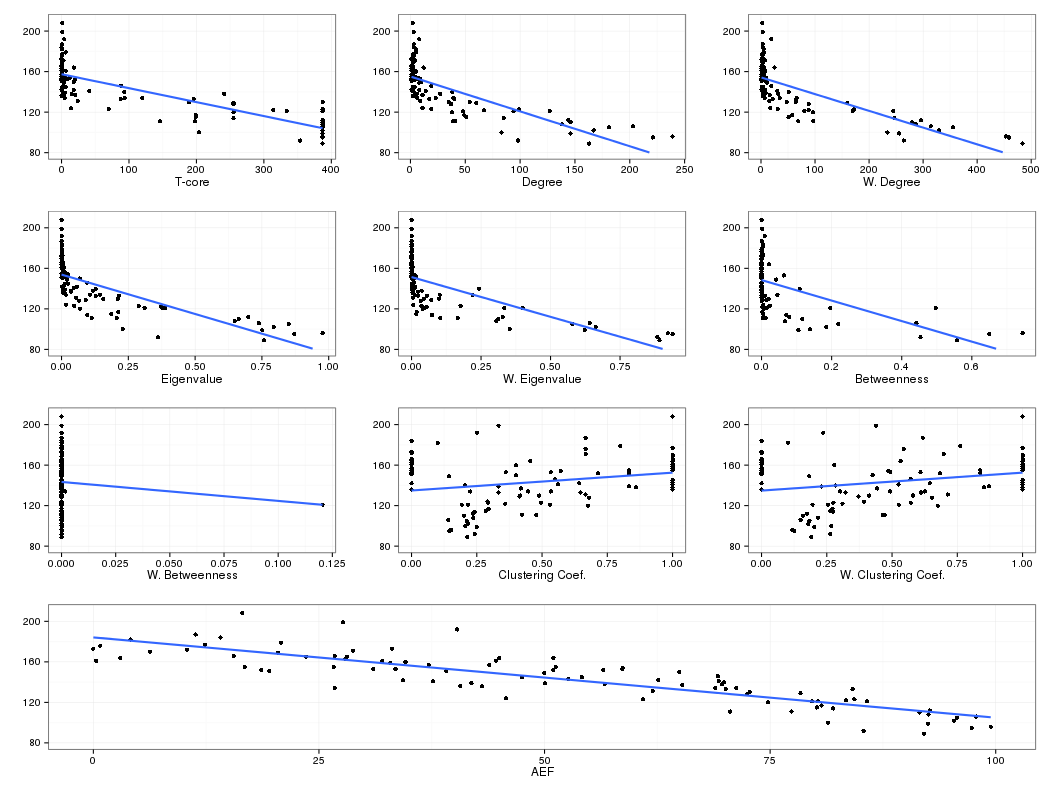
AEF was also strongly correlated with the delay until an outbreak became a pandemic. Correlation was to the day pandemic status was achieved, and to the day of peak global incidence, see Figure 3. AEF is significantly and more strongly correlated to either epidemic outcome than any of the comparison network centrality measures, see Table 2 and Figure 4.
The AEF proved robust to incomplete sampling. Degradation was most severe when airports were preferentially removed based on degree. Still, only three percent of non-U.S. airports showed more than 1% change in their computed ExF values when applying this scheme at the highest noise level. Even within the United States, only 22% of AEF values changed by more than 5%. See Figure 5.
Discussion
In all cases, AEF explains much of the variation in epidemic outcomes, suggesting that the early development of a pandemic is not stochastic, but rather strongly structured by the local connectivity of the seed location. The ability of the AEF to summarize this connectivity contributes substantially to our understanding of the role of individual airports in pandemic diffusion. These results are in harmony with other recent work claiming that relative arrival times of WAN-mediated pandemics are independent of disease-specific parameters [4] and that a simple branching process model describes early developments as well as complex metapopulation simulations [23].
Degradation of the network had, in general, limited effect on airport AEF values. Wrong information regarding a specific node could, however, produce a misleading AEF value for that airport. Epidemics seeded from airport PBJ (Paama Island, Vanuatu) took longer than expected to achieve pandemic status. This airport is probably mischaracterized in the Open Flights database, as flights to this simple grass strip are not shown on the Vanuatu airlines online booking system (http://www.airvanuatu.com/, last visited 23 March 2015). In the opposite direction, Narita Airport (NRT, Tokyo, Japan) showed significantly greater pandemic risk than predicted by its AEF. This could be due to Japan’s intense population density combined with high local mobility, factors captured in the GLEaMvis simulator but not the Open Flights database.
Two outliers highlight a structural blind spot of the AEF metric. Epidemics seeded from airports ZRJ (Round Lake, Canada) and PVH (Porto Velho, Brazil) took longer than expected to achieve pandemic status. ZRJ is part of a small but locally dense community of airports serving first nation communities in Canada. This community has limited connectivity to the rest of the WAN, and ZRJ is three flights distant from any airport outside this community (Winnipeg’s James Armstrong Richardson Airport YWG, Chicago Midway MDW, Toronto Pearson YYZ). Likewise, PVH is two flights from any of Brazil’s international transport hubs. The AEF is here derived from an airport’s two-hop neighborhood, meaning for certain airports it is unaware of these network community boundaries. This limitation could perhaps be overcome by instead computing AEF based on a three-hop neighborhood. Given, however, that the WAN’s effective diameter is four hops, and the general good performance of the AEF, it is not clear that such an extension would substantially improve results globally.
Airport expected force summarizes the size, density, and diversity of each airport’s neighborhood in the WAN. It combines features of degree, neighbor degree, and betweenness centrality in a statistically coherent manner. Airport degree is not a good descriptor of pandemic outcomes, since it does not account for a neighbor’s onward connectivity. Guimera et al noted that high degree does not well correlate to high centrality [16]. Nor does low degree correlate to an airport’s connection to the wider network, as illustrated by comparing Sweden’s Linköping City Airport (LPI) to Alaska’s Huslia Airport (HSL). HSL has four outbound routes which connect to other rural Alaskan airports. LPI has only one outbound route, which connects to Amsterdam Schipol. Verma et al propose instead characterizing airports based on the number of network triangles they take part in, the t-core [15]. Plotting airport t-core against epidemic outcomes shows that its ability to explain epidemic outcomes is a result of its ability to successfully segment the WAN into core and periphery, see Figure 4. Thus t-core and AEF capture complementary aspects of an airport’s role in the WAN.
The applicability of the AEF could be extended by modifying it to allow for varying transmissibility at individual airports. Such an extension would allow it to express differences in i.e. competent vector species populations or health care system readiness at different world locations. Since the AEF is the expectation of the force of infection, such an extension merely requires modifying the calculation of each transmission pattern’s force of infection along with the probability of that specific pattern occurring. Both criteria can be met by adjusting edge weights in the underlying network model, implying that this extension could be implemented using the same framework as outlined in the current work. It would also be interesting to apply the expected force framework to disease spread through the world shipping network, a major transport system for several vector born pathogens along with their vector species [1]. The approach could also be tested on more local transmission network models, such as contacts in a hospital ward [26] or city-wide mobility data acquired from i.e. mobile phones [27, 28].
Conclusion
An outbreak’s debut location is highly influential in its ability to become a pandemic threat. The AEF metric succinctly captures this influence, and can help inform monitoring and response strategies.
These investigations pave the way for the development of simple, robust models capable of informing preparedness planning and policy directives.
Competing interests
The Max Planck Society has filed for a patent on the use of the expected force metric to assess spreading risk on the world airline network.
Author’s contributions
GL concieved and carried out the experiments and wrote the manuscript.
Acknowledgements
We thank the GLEaMvis team for providing public access to their simulator with the only requirement being appropriate citation. Trivik Verma provided measures of airport t-core.
References
- [1] Tatem, A.J., Rogers, D.J., Hay, S.I.: Global transport networks and infectious disease spread. Adv Parasitol 62, 293–343 (2006). doi:10.1016/S0065-308X(05)62009-X
- [2] Tatem, A.J.: Mapping population and pathogen movements. Int Health 6(1), 5–11 (2014). doi:10.1093/inthealth/ihu006
- [3] Jones, K.E., Patel, N.G., Levy, M.A., Storeygard, A., Balk, D., Gittleman, J.L., Daszak, P.: Global trends in emerging infectious diseases. Nature 451(7181), 990–993 (2008). doi:10.1038/nature06536
- [4] Brockmann, D., Helbing, D.: The hidden geometry of complex, network-driven contagion phenomena. Science 342(6164), 1337–1342 (2013). doi:10.1126/science.1245200
- [5] Johansson, M.A., Powers, A.M., Pesik, N., Cohen, N.J., Staples, J.E.: Nowcasting the spread of chikungunya virus in the Americas. PLoS One 9(8), 104915 (2014). doi:10.1371/journal.pone.0104915
- [6] Colizza, V., Barrat, A., Barthélemy, M., Vespignani, A.: The role of the airline transportation network in the prediction and predictability of global epidemics. Proc Natl Acad Sci U S A 103(7), 2015–2020 (2006). doi:10.1073/pnas.0510525103
- [7] Colizza, V., Pastor-Satorras, R., Vespignani, A.: Reaction–diffusion processes and metapopulation models in heterogeneous networks. Nat Phys 3, 276–282 (2007)
- [8] Balcan, D., Hu, H., Goncalves, B., Bajardi, P., Poletto, C., Ramasco, J.J., Paolotti, D., Perra, N., Tizzoni, M., den Broeck, W.V., Colizza, V., Vespignani, A.: Seasonal transmission potential and activity peaks of the new influenza A(H1N1): a Monte Carlo likelihood analysis based on human mobility. BMC Med 7, 45 (2009). doi:10.1186/1741-7015-7-45
- [9] Huang, Z., Tatem, A.J.: Global malaria connectivity through air travel. Malar J 12, 269 (2013). doi:10.1186/1475-2875-12-269
- [10] Semenza, J.C., Sudre, B., Miniota, J., Rossi, M., Hu, W., Kossowsky, D., Suk, J.E., Bortel, W.V., Khan, K.: International dispersal of dengue through air travel: importation risk for Europe. PLoS Negl Trop Dis 8(12), 3278 (2014). doi:10.1371/journal.pntd.0003278
- [11] Heffernan, J.M., Smith, R.J., Wahl, L.M.: Perspectives on the basic reproductive ratio. Journal of The Royal Society Interface 2(4), 281–293 (2005). doi:10.1098/rsif.2005.0042
- [12] Newman, M.E.J.: Spread of epidemic disease on networks. Phys Rev E Stat Nonlin Soft Matter Phys 66(1 Pt 2), 016128 (2002)
- [13] Volz, E.: SIR dynamics in random networks with heterogeneous connectivity. Journal of Mathematical Biology 5(3), 293–310 (2008). doi:10.1007/s00285-007-0116-4
- [14] Barrat, A., Barthélemy, M., Vespignani, A.: The effects of spatial constraints on the evolution of weighted complex networks. Journal of Statistical Mechanics: Theory and Experiment 2005, 05003 (2005)
- [15] Verma, T., Araújo, N.A.M., Herrmann, H.J.: Revealing the structure of the world airline network. Sci Rep 4, 5638 (2014). doi:10.1038/srep05638
- [16] Guimerà, R., Mossa, S., Turtschi, A., Amaral, L.A.N.: The worldwide air transportation network: Anomalous centrality, community structure, and cities’ global roles. Proc Natl Acad Sci U S A 102(22), 7794–7799 (2005). doi:10.1073/pnas.0407994102
- [17] Pan, R.K., Saramäki, J.: Path lengths, correlations, and centrality in temporal networks. Phys. Rev. E 84(016105) (2011)
- [18] Bauch, C.T., Lloyd-Smith, J.O., Coffee, M.P., Galvani, A.P.: Dynamically modeling SARS and other newly emerging respiratory illnesses: past, present, and future. Epidemiology 16(6), 791–801 (2005)
- [19] Tizzoni, M., Bajardi, P., Poletto, C., Ramasco, J.J., Balcan, D., Gonçalves, B., Perra, N., Colizza, V., Vespignani, A.: Real-time numerical forecast of global epidemic spreading: case study of 2009 A/H1N1pdm. BMC Med 10, 165 (2012). doi:10.1186/1741-7015-10-165
- [20] den Broeck, W.V., Gioannini, C., Gonçalves, B., Quaggiotto, M., Colizza, V., Vespignani, A.: The GLEaMviz computational tool, a publicly available software to explore realistic epidemic spreading scenarios at the global scale. BMC Infect Dis 11, 37 (2011). doi:10.1186/1471-2334-11-37
- [21] Ajelli, M., Merler, S., Pugliese, A., Rizzo, C.: Model predictions and evaluation of possible control strategies for the 2009 A/H1N1v influenza pandemic in Italy. Epidemiol Infect 139(1), 68–79 (2011). doi:10.1017/S0950268810001317
- [22] Ajelli, M., Gonçalves, B., Balcan, D., Colizza, V., Hu, H., Ramasco, J.J., Merler, S., Vespignani, A.: Comparing large-scale computational approaches to epidemic modeling: agent-based versus structured metapopulation models. BMC Infect Dis 10, 190 (2010). doi:10.1186/1471-2334-10-190
- [23] Johansson, M.A., Arana-Vizcarrondo, N., Biggerstaff, B.J., Gallagher, N., Marano, N., Staples, J.E.: Assessing the risk of international spread of yellow fever virus: a mathematical analysis of an urban outbreak in Asuncion, 2008. Am J Trop Med Hyg 86(2), 349–358 (2012). doi:10.4269/ajtmh.2012.11-0432
- [24] Lawyer, G.: Understanding the influence of all nodes in a network. Sci Rep 5, 8665 (2015). doi:10.1038/srep08665
- [25] Patokallio, J.: OpenFlights. openflights.org
- [26] Machens, A., Gesualdo, F., Rizzo, C., Tozzi, A.E., Barrat, A., Cattuto, C.: An infectious disease model on empirical networks of human contact: bridging the gap between dynamic network data and contact matrices. BMC Infect Dis 13, 185 (2013). doi:10.1186/1471-2334-13-185
- [27] Tizzoni, M., Bajardi, P., Decuyper, A., King, G.K.K., Schneider, C.M., Blondel, V., Smoreda, Z., González, M.C., Colizza, V.: On the use of human mobility proxies for modeling epidemics. PLoS Comput Biol 10(7), 1003716 (2014). doi:10.1371/journal.pcbi.1003716
- [28] Deville, P., Linard, C., Martin, S., Gilbert, M., Stevens, F.R., Gaughan, A.E., Blondel, V.D., Tatem, A.J.: Dynamic population mapping using mobile phone data. Proc Natl Acad Sci U S A 111(45), 15888–15893 (2014). doi:10.1073/pnas.1408439111
Figures
a
Tables
| IATA | City | Country | Pand. | AEF | t-core | Deg. | w. Deg. | Eigen. | w. Eigen. | ||
|---|---|---|---|---|---|---|---|---|---|---|---|
| 8 | SMK | St. Michael | USA | 286 | 0.45 | 3 | 1 | 2 | 4 | 0.00 | 0.00 |
| 10 | YFS | Fort Simpson | Canada | 287 | 0.45 | 16 | 0 | 1 | 2 | 0.00 | 0.00 |
| 3 | GTE | Groote Eylandt | Australia | 300 | 0.45 | 27 | 3 | 3 | 4 | 0.00 | 0.00 |
| 7 | SBH | Gustavia | France | 346 | 0.42 | 31 | 7 | 6 | 9 | 0.01 | 0.00 |
| 6 | PVH | Porto Velho | Brazil | 295 | 0.45 | 40 | 4 | 8 | 19 | 0.00 | 0.00 |
| 2 | BIS | Bismarck | USA | 360 | 0.42 | 51 | 5 | 4 | 5 | 0.01 | 0.00 |
| 1 | BES | Brest | France | 284 | 0.42 | 62 | 24 | 9 | 15 | 0.05 | 0.00 |
| 9 | XRY | Jerez | Spain | 294 | 0.42 | 70 | 88 | 17 | 22 | 0.13 | 0.02 |
| 5 | NRT | Tokyo | Japan | 22 | 0.40 | 85 | 354 | 98 | 264 | 0.36 | 0.88 |
| 4 | IST | Istanbul | Turkey | 172 | 0.41 | 98 | 387 | 203 | 314 | 0.74 | 0.64 |
| Measure | Pandemic | c.i. | Peak | c.i. |
|---|---|---|---|---|
| AEF | -0.84 | -0.85 | ||
| t-core | -0.77 | -0.79 | ||
| Degree | -0.72 | -0.75 | ||
| W degree | -0.69 | -0.75 | ||
| Eigenvalue | -0.70 | -0.74 | ||
| W eigenvalue | -0.66 | -0.69 | ||
| Betweenness | -0.54 | -0.56 | ||
| W betweenness | -0.17 | -0.09 | ||
| Clustering coef. | 0.28 | 0.24 | ||
| W Clust. coef. | 0.27 | 0.24 |