cosmology: observations — surveys — galaxies: distances and redshifts — galaxies: statistics — large-scale structure of universe
The Subaru FMOS Galaxy Redshift Survey (FastSound). II. The Emission Line Catalog and Properties of Emission Line Galaxies
Abstract
We present basic properties of 3,300 emission line galaxies detected by the FastSound survey, which are mostly H emitters at 1.2–1.5 in the total area of about 20 deg2, with the H flux sensitivity limit of at 4.5 sigma. This paper presents the catalogs of the FastSound emission lines and galaxies, which is open to the public. We also present basic properties of typical FastSound H emitters, which have H luminosities of – erg/s, SFRs of 20–500 /yr, and stellar masses of – . The 3D distribution maps for the four fields of CFHTLS W1–4 are presented, clearly showing large scale clustering of galaxies at the scale of 100–600 comoving Mpc. Based on 1,105 galaxies with detections of multiple emission lines, we estimate that contamination of non-H lines is about 4% in the single-line emission galaxies, which are mostly [OIII]5007. This contamination fraction is also confirmed by the stacked spectrum of all the FastSound spectra, in which H, [NII]6548,6583, [SII]6717,6731, and [OI]6300,6364 are seen.
1 Introduction
The FastSound survey is a galaxy redshift survey using the near-infrared (NIR) Fiber Multi-Object Spectrograph (FMOS) mounted on the Subaru Telescope (Kimura et al., 2010), which detected 4,000 line emitters at 1.43–1.67 m with a line sensitivity limit of (Tonegawa et al. (2015b), hereafter Paper I). The majority of these are expected to be H emitters at , because emitters at this flux level have very high H/[OIII] ratios and therefore very low [OIII] contamination (Colbert et al., 2013). The FastSound observations have already been completed, with the total surveyed area of 20.6 deg2 in the four fields of the CFHTLS Wide Survey (Goranova et al., 2009). The primary scientific objective is to measure the structure growth rate [i.e., ] using the redshift space distortion (RSD), motivated by the modified gravity scenario for the origin of the mysterious acceleration of cosmic expansion (see Hamilton (1998); Clifton et al. (2012) for reviews). RSD measurements have been obtained mainly by redshift surveys at (Hawkins et al., 2003; Guzzo et al., 2008; Blake et al., 2011; Beutler et al., 2012; Bielby et al., 2013; Reid et al., 2012; Samushia et al., 2012; de la Torre et al., 2013). FastSound aims to detect and measure the growth rate in the unexplored redshift range at a significance of . The FastSound data will also be useful for general studies on galaxy formation and evolution, like the past major galaxy redshift surveys at in optical and NIR bands (Wirth et al., 2004; Le Fèvre et al., 2005; Lilly et al., 2009; Coil et al., 2011; Cooper et al., 2011; Brammer et al., 2012; Yabe et al., 2012; Newman et al., 2013; Colbert et al., 2013; Kriek et al., 2015).
This is the second of the FastSound paper series, in which we describe the FastSound catalog111The FastSound catalog is publicly available at the project website, http://www.kusastro.kyoto-u.ac.jp/Fastsound/. and present basic properties of the detected emission lines and their host galaxies. Line identification is an important issue in FastSound, because most ( 70%) of the detected galaxies have only one emission line, due to the narrow wavelength range. We expect that the majority of the FastSound emission lines are H, because of the strength of H and our target selection to maximize the probability of finding H emitters by photometric estimates of redshift and star formation rate (SFR). Indeed, a previous study estimated the non-H contamination rate for FastSound to be 10% (Tonegawa et al., 2014) by using the data of the HiZELS narrow-band survey in NIR (Geach et al., 2008; Sobral et al., 2009). Glazebrook et al. (2005) estimated this rate to be 30% at a similar flux limit from line luminosity functions, which is consistent with the estimate by Tonegawa et al. (2014) that takes into account the FastSound target selection preferring strong H emitters. Nevertheless, a more precise estimate of the contamination rate is important for high precision clustering analyses to derive cosmological information. Therefore we evaluate the non-H contamination rate using the FastSound data, based on the statistics of galaxies with multiple lines and the stacked spectrum of all FastSound galaxies.
This paper is organized as follows. The FastSound catalog is described in § 2, and the properties of emission line galaxies in the catalog are discussed in § 3. We estimate the non-H contamination in the catalog in § 4, followed by conclusions in § 5. Throughout this paper, the standard CDM cosmology with the parameters is assumed, where .
2 The FastSound Catalogs1
The FastSound catalog data set consists of the three tables: (1) the FoV-information list for the record and statistics of each FMOS field-of-view (FoV) observed in the FastSound survey, (2) the galaxy catalog that describes the properties and line-detection statistics for all galaxies selected as the FastSound targets, and (3) the emission line catalog that includes all the emission line candidates detected by the software FIELD as described in Paper I. These three tables are given separately for the four CFHTLS Wide fields observed by the FastSound survey, and detailed descriptions are given below.
2.1 The FoV-Information List
The FoV-information list is provided so that users can get information about each of the 121 FMOS FoVs observed in the FastSound survey. The basic properties of each FoV, such as the observation date, FMOS FoV ID (e.g., W1_011 meaning the 11th FMOS FoV in the W1 field), and central coordinates are given. (See Table 1 for the list of entries in this table.) We also provided statistics for the number of galaxies and emission lines, such as the number of target galaxies sent to the fiber allocation software (), the number of galaxies actually observed by FMOS fibers (), the number of galaxies with at least one detected emission line at (), and the total number of detected emission line candidates (). The statistics of and are given not only for the normal frames but also the inverted frames222A normal frame is produced by subtracting the sky frame from the object frame, while an inverted frame is by the inverted procedure, i.e., sky minus object, with all other reduction processes unchanged. All the lines detected in inverted frames must be spurious, and the number of these is a good indicator of that in normal frames. See Paper I for details.. FMOS has two spectrographs, IRS1 and IRS2, each of which covers about 200 objects. Therefore these numbers are given separately for IRS1 and IRS2.
The information about observing conditions is also given, such as the mean seeing. The mean seeing for each FoV is derived from the 2D optical image of coordinate calibration stars (CCS, typically 17 CCSs in a FoV) by fitting it with a gaussian profile. An important quantity is calculated using the flux calibration stars (FCS, typically eight FCSs in a FoV). For each FCS we calculated , which is the ratio of the uncalibrated flux within the fiber aperture (, see §2.3 below) to the total stellar flux in the literature (see §5 of Paper I). Then the average in a FoV is calculated as . The line fluxes are not corrected for the observing conditions, and hence the factor should be multiplied to get a flux that is calibrated by FCSs and corrected for the fiber aperture effect (assuming a point source). For extended sources, further corrections are necessary. See §2.3 for the method of calculating the emission line fluxes of FastSound galaxies used in this paper.
Emission line detection efficiency for a galaxy observed by FMOS is not uniform over the observed FastSounds fields, because of variable weather and hardware conditions. This can be estimated by the ratio . For a galaxy selected as a FastSound target, the mean probability of being actually observed is 80% (typically, 360 fibers allocated to 440 targets per FoV, see Fig. 5 of Paper I) in the fiber allocation procedure. The line detection efficiency against the target galaxies, including this effect, can be estimated by the ratio . This efficiency would be useful for a clustering analysis of the spatial galaxy distribution.
2.2 The Galaxy Catalog
The galaxy catalog provides various information for individual galaxies, including not only those actually observed by FMOS but also all the galaxies meeting the selection criteria of the FastSound target galaxies, which were sent to the fiber allocation software of FMOS (see Paper I for details). See Table 2 for the list of items in this catalog. As basic information of a galaxy, the following quantities are given: the CFHTLS-W ID in the catalog of Gwyn (2012), RA, Dec, and CFHTLS optical magnitudes. The near-infrared magnitudes of the UKIDSS DXS [DR8, Lawrence et al. (2007)] are also added where available (only in W1 and W4 fields). The Galactic extinction by the extinction map of Schlegel et al. (1998) is also given, and these magnitudes have been corrected for this.
The physical quantities estimated by the photometric SED fittings performed for target selection are also provided: photometric redshift (), SFR, stellar mass (), , and H flux estimate (see Paper I for the fitting method). The median, the likelihood peak value, and 68% confidence level (C.L.) lower and upper bounds derived by the photometric redshift code LePhare (Arnouts & Ilbert, 2011) are given for , SFR, and in the table. When the likelihood function does not have a simple form, the likelihood peak value may be outside the range between the 68% C.L. lower and upper limits. The 68% C.L. upper and lower limits for H flux estimates are based on those for SFR.
The number of FMOS observations for a galaxy, , is zero if no fiber was allocated to it. In each FoV, observation was done with only one fiber allocation pattern, and hence most galaxies observed by FMOS have , though it can be two or larger for some galaxies in FoV overlapping regions. We also provide the number of detected emission lines for each galaxy (, see the next section for details). Since the typical probability of detecting emission lines from a target galaxy is about 10% in the FastSound survey, this catalog includes about 10 times more galaxies than those in the emission line catalog, and about 90% of them have . The reasons for this relatively low detection efficiency are discussed in Tonegawa et al. (2014) and Paper I.
2.3 The Emission Line Catalog
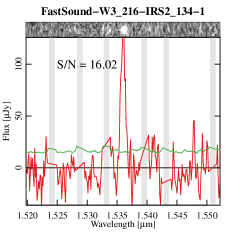
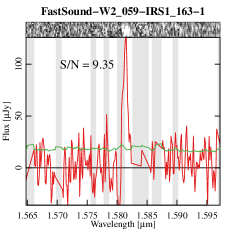
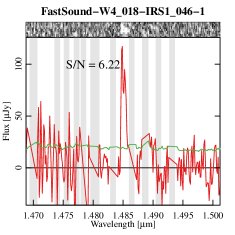
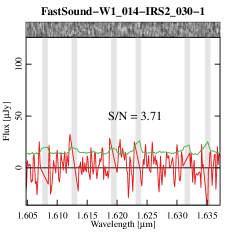
The quantities presented in the emission line catalog are summarized in Table 3. This catalog includes all emission line candidates detected by the line detection software FIELD [Tonegawa et al. (2015a); Paper I], and the same emission line in a galaxy may be included as more than one entry in the catalog, if its host galaxy was observed more than once in the overlapping FastSound FoVs. The line candidates are identified by the FastSound ID, which consists of the FastSound FoV ID, the used spectrograph (IRS1 or 2), the FMOS fiber ID (1–200 for each of IRS1 and 2), and the line ID ( for the -th line in a spectrum in increasing wavelength order). An example of the FastSound ID is FastSound-W1_011-IRS1_009-1. The line values are also given, which were calculated by the fixed-width kernel method used in the line candidate selection (Paper I). We present typical spectra of emission line candidates for various values in Fig. 1. The emission line catalogs are provided both for the normal and inverted frames, and the statistics about spurious noise detection can be examined by using the inverted-frame catalogs.
As for the physical properties of the lines, the central wavelength (), line flux (), and line width (, not corrected for the instrumental resolution) are provided, which were calculated by 1D Gaussian fits. The line flux was integrated over all wavelengths using the best-fit Gaussian, including the OH mask regions which represent sharp gaps in the wavelength coverage. Note that in the catalog is not corrected for the point-source aperture loss due to the fibre (as determined from the flux calibration stars).
Sometimes wavelengths of line candidates are close to the OH mask regions. An OH mask has 7 Å width, and about 300 and 130 masks in 0.8–1.9 m were installed for IRS1 and 2, respectively, before September 2012. The number for IRS1 is larger because it includes masks for fainter OH lines. After September 2012, the IRS1 mask plate has been replaced with a new one that is the same for IRS2, and hence the OH mask patterns became the same for the two spectrographs (see S4.3 of Paper I). To give information about nearby OH masking for each emission line candidate, we provide the OH mask flag parameter (1 if the line center is within an OH mask width, 0 otherwise), and distance from the line center to the nearest OH mask borders () in units of the measured velocity width of the line candidate. The line centers were determined by a profile fitting, and sometimes they fall in the mask regions, making the flag 1. We provide for both the increasing and decreasing wavelength directions. 210 line candidates have line centers overlapped with masked regions (i.e., the flag 1) among the 3,769 line candidates detected at ,
The total (i.e., corrected for the fiber aperture loss) line flux from a galaxy (), which is calibrated by the flux standard stars, is necessary for many studies about galaxy properties. As explained in §2.1, these corrections can easily be done by using for point sources. For extended galaxies, a perfect correction is difficult and it would be generally model dependent, but here we calculate as follows. First is multiplied by the factor of , to convert it into the total flux which would be correct if it was a point source. Then we need a further correction to take into account sizes of extended galaxies. For this correction we first estimate the calibrated line flux of a galaxy within the fiber aperture (1.2 arcsec diameter), by multiplying the fiber covering fraction for a point source, i.e., . The factor should be discriminated from ; the former is just the fraction of flux within the fiber aperture for point sources, while the latter is the combined factor of the fiber aperture loss and flux reduction by observing conditions such as weather. We calculated by assuming a two-dimensional Gaussian profile with the seeing FWHM of each FoV. Then the final step is to correct it by using the fiber covering fraction for extended galaxies. Though should depend on the surface brightness profile of individual galaxies and seeing, we adopt a constant value of , as estimated by Tonegawa et al. (2014) based on the image size of typical FastSound galaxies. Here we ignored the effect of seeing variation in different FastSound FoVs on , but it should be smaller than that for because galaxies are extended sources. Taking into account the Galactic extinction, the final flux is then obtained as , where is the Galactic extinction magnitude at the observed wavelength, calculated from the Galactic in the catalog and the Milky-Way extinction curve of Cardelli et al. (1989). The flux is also given in the emission line catalog.
Sometimes lines are blended with nearby lines by line widths comparable with line separations. In the FastSound line detection process, line peaks are treated as independent lines when their separation is more than 20 pixels ( Å), corresponding to a velocity difference of km/s. Therefore, there is no blending among different line candidates in the catalog if their velocity dispersions are typical for normal galaxies ( 200 km/s). (Note that some line pairs in the catalog may have line separations less than 20 pixels in terms of the line central wavelength , which is estimated by the 1D Gaussian fit and different from the peak location in the line detection process.) When line separations are smaller than 20 pixels, such as the [OII]3727 doublet (separation of about 220 km/s), these lines are treated as a single line in our sample. As information about nearby lines, we provided in the catalog, which is the distance in wavelength to the next independent line in the spectrum, both in increasing and decreasing wavelength directions.
Two numbers are provided for each line candidate in this catalog, to describe the statistics about the number of lines in a galaxy. is the number of detected emission lines in a galaxy, from an individual observation in which the line candidate was detected. If , this means that the galaxy has multiple lines at different wavelengths. is the sum of over all the observations for a galaxy, and hence can be larger than if a galaxy was observed more than once. For convenience to select the strongest line in a galaxy, we provided the rank of the line within a galaxy, and , among the and line candidates, respectively. For example, if one is interested only in the strongest line in a galaxy, choosing only lines having gives a complete line sample without duplications.
| Column name | Description |
|---|---|
| OBSDATE | Date of observation (for 18:00 Hawaiian Standard Time on the night during which the FoV was observed) |
| FastSound FoV ID | e.g., CFHTLSW1_011 for the 11th FoV in the W1 field |
| RAcent | RA [deg] (J2000) of the FMOS FoV center |
| DECcent | DEC [deg] (J2000) of the FMOS FoV center |
| Number of selected target galaxies sent to fiber allocation | |
| Number of galaxies actually observed by FMOS (for IRS1 and IRS2) | |
| Total number of emission line candidates (for IRS1 and IRS2) | |
| Number of galaxies with at least one detected emission line candidate (for IRS1 and IRS2) | |
| mean seeing | Mean seeing (FWHM) during exposure [arcsec] |
| The correction factor for the uncalibrated flux in the emission line catalog, for IRS1 and IRS2 |
| Column name | Unit | Description |
|---|---|---|
| CFHTLSW ID | CFHTLS-Wide Object ID of Gwyn (2012) | |
| RA | [deg] | J2000 |
| DEC | [deg] | J2000 |
| MAG_AUTO | The CFHTLS Wide magnitudes of Gwyn (2012). | |
| When available, the magnitudes from UKIDSS DXS DR8 are also given. | ||
| These have been corrected for the Galactic extinction. | ||
| Galactic extinction (Schlegel et al., 1998) | ||
| Photometric redshift | ||
| [] | Stellar mass estimated by photometric SED fitting | |
| SFR | [yr] | Star formation rate estimated by photometric SED fitting |
| Extinction in a galaxy estimated by photometric SED fitting | ||
| [erg/cm2/s] | H flux estimated from photometric SED fitting | |
| Number of FMOS observations made for a galaxy (can be in overlapping FoV regions) | ||
| Total number of emission line candidates among all the FMOS observations for a galaxy (see Table 3) |
| Column name | Unit | Description |
| FastSound ID | ID including the FastSound FoV ID, spectrograph (IRS1 or 2), fiber ID, and line ID | |
| (e.g., FastSound-W1_011-IRS1_009-1) | ||
| CFHTLSW ID∗*∗*footnotemark: | CFHTLS-Wide Object ID of Gwyn (2012) for the line host galaxy | |
| The line detection signal-to-noise ratio derived by the line detection software FIELD | ||
| [m] | Central wavelength of the line | |
| [erg/cm2/s] | Flux of the emission line detected (uncalibrated, within fiber aperture) | |
| [erg/cm2/s] | Total calibrated line flux from a galaxy, corrected for aperture loss and Galactic extinction | |
| [Å] | The 1 line width of the best-fit Gaussian (instrumental spectral resolution not deconvolved) | |
| OH mask flag | 1 if the line center is on the OH mask regions, 0 otherwise | |
| Distances from the line center to the nearest OH mask borders in increasing/decreasing wavelength directions | ||
| [m] | Distances from the line center to that of the nearest line in increasing/decreasing wavelength directions | |
| Total number of the emission line candidates in the line host galaxy, | ||
| in the FMOS observation in which the line was detected | ||
| The sum of for all the FMOS observations for the line host galaxy | ||
| rank of the emission line among the lines (1 for the highest) | ||
| rank of the emission line among the lines (1 for the highest) |
Other quantities about host galaxies in the galaxy catalog
(e.g., RA, DEC)
are also given in the electronic version of this table,
but they are not shown here.
|
|
3 Basic Properties of Emission Line Galaxies
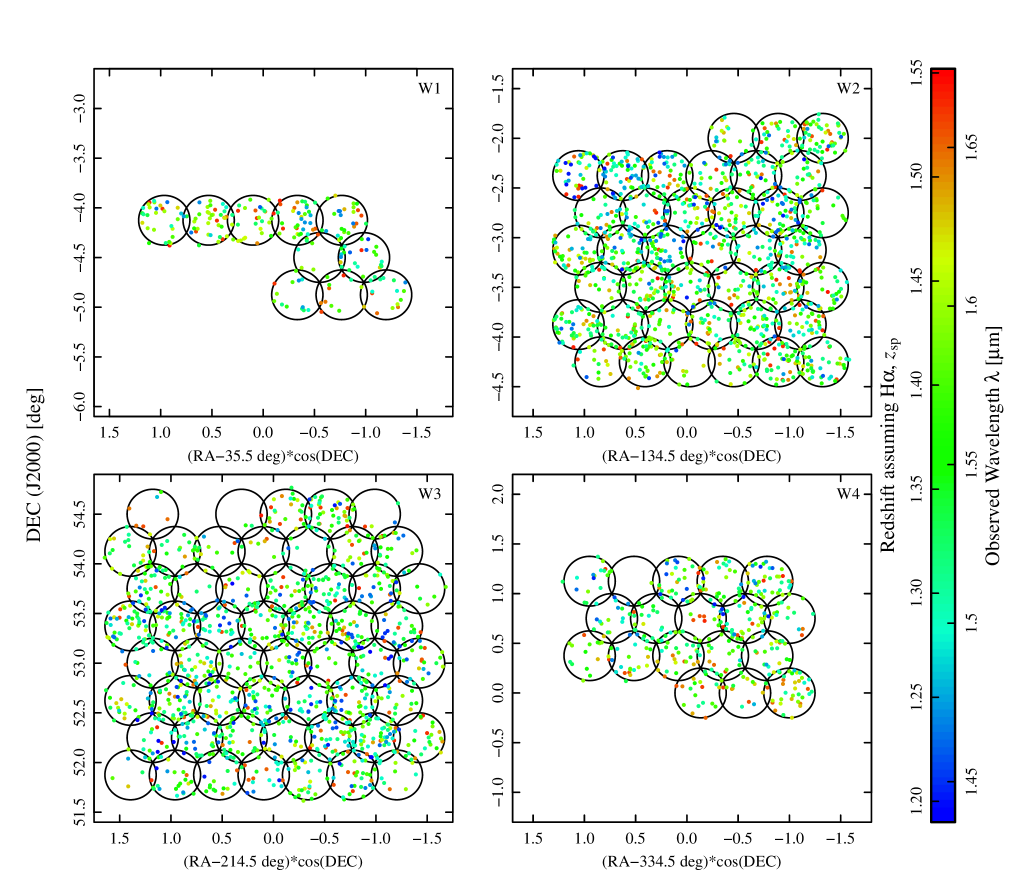
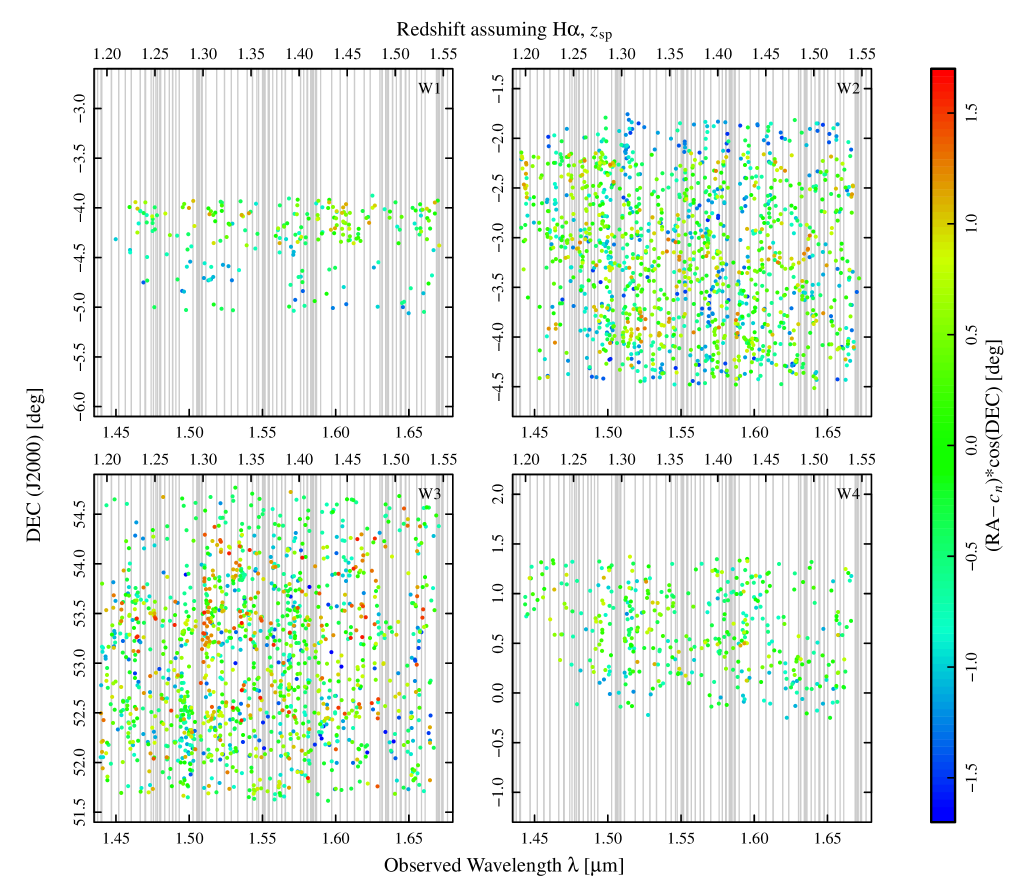
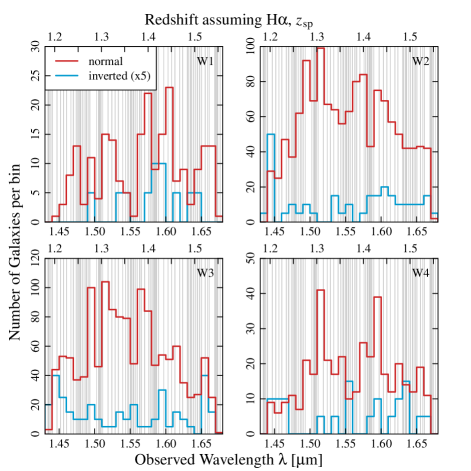
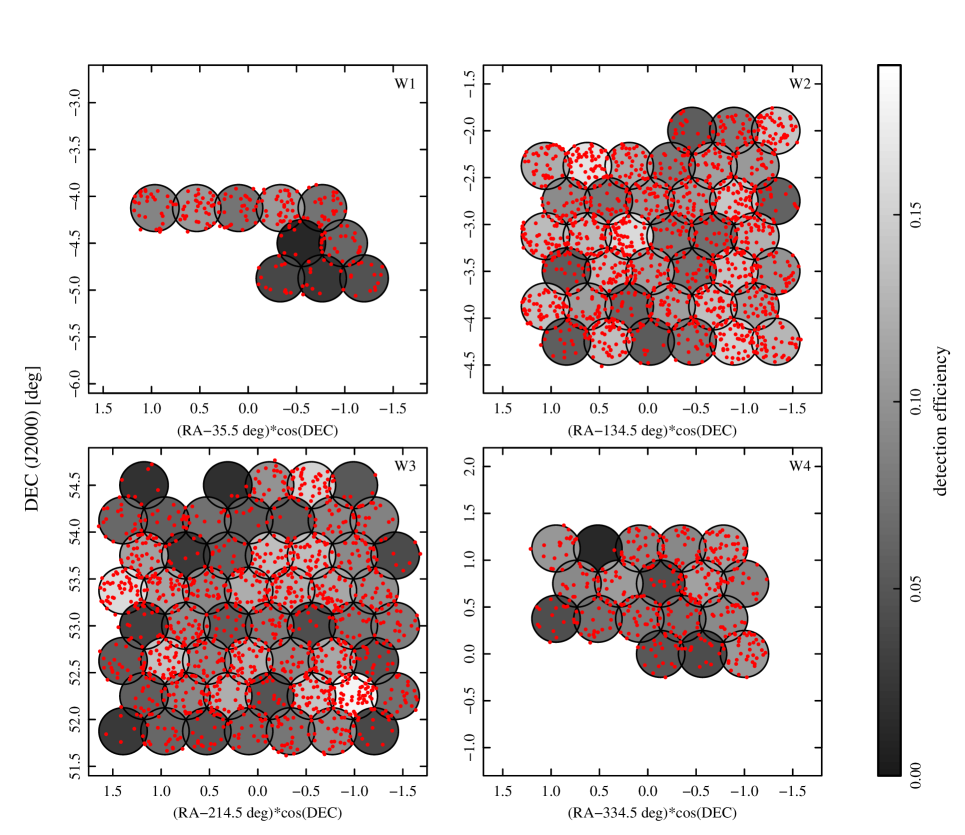
Here we examine the basic properties of emission line galaxies detected by the FastSound survey, using the sample of the highest lines in a galaxy (i.e., ) with the threshold of 4.5. There are 3,299 galaxies, and for simplicity we assume that all of these lines are H, though this sample includes a small fraction of spurious noise detections (5%, Paper I) and non-H lines (4%, §4). This sample includes 11 emission lines with large line widths of , whose host galaxies are likely to be AGNs. [Here the instrumental resolution is not deconvolved, which is typically in the H short+ wavelength range used in the FastSound observations (Paper I), corresponding to km/s.] We excluded these emission lines from our analysis, and our final sample comprises 3,288 galaxies. These galaxies are distributed in the four CFHTLS-W survey fields, with typical radial and tangential comoving lengths of 700 and 100–200 Mpc, respectively. The RA-Dec distributions of these galaxies are shown in Fig. 2, and the Dec-wavelength distribution in Fig. 3, showing large scale clustering features that will be discussed in our Paper IV (Okumura et al., 2015). The wavelength distributions are also shown as histograms in Fig. 4. The 3D large scale clustering can be seen in these figures, though the line detection efficiency is not uniform in different FoVs due to observing conditions. In Fig. 5, we show the RA-Dec map with the background color scale for the line detection efficiency ( in the FoV-information list).
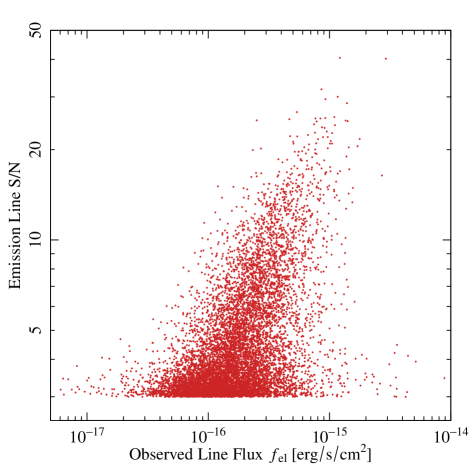
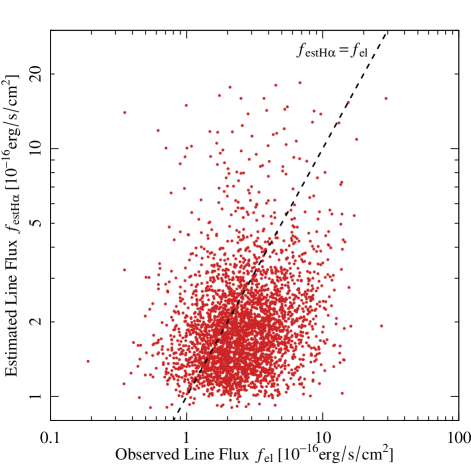
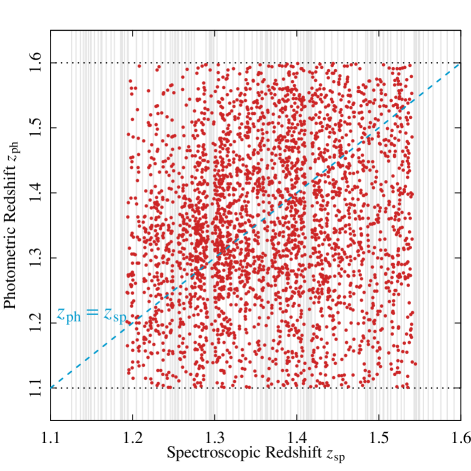
Fig. 6 shows the correlation between line and line flux . This plot indicates that the mean sensitivity of FastSound is at , though scatter around the mean relation is possible by varying observing conditions and the effect of OH masks. (Note that and are integration over all wavelengths but is over regions outside OH masks.) We compare the observed flux with the estimated H flux by photometric SED fittings for target selection, in Fig. 7. Almost no correlation is seen, most likely because of the uncertainty in the photometric SED fitting using only 5 optical bands of CFHTLS-W. Fig. 8 shows the correlation between photometric and spectroscopic redshifts. The photometric redshifts are in the range of by the selection criteria, while spectroscopic redshifts in limited by the observed wavelength range. In this limited ranges, the scatter is large, again because of the limited photo- accuracy (typical error of 0.15) based only on 5 optical bands. The uncertainties in the SED fittings are the main source of rather low line detection efficiency ( 10%), but the adopted method is still much better than no selection at all (see Tonegawa et al. (2014)).
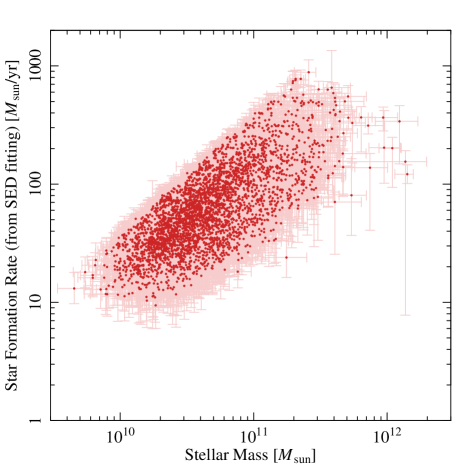
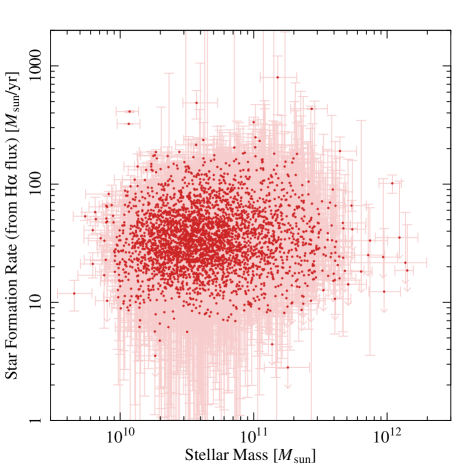
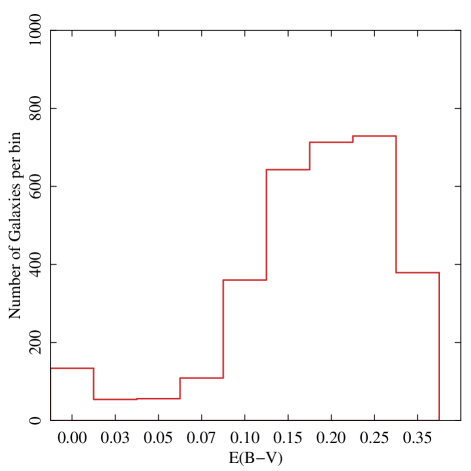
The correlation between SFR and stellar mass is shown in Fig. 9, indicating that the typical ranges of these quantities are 20–500 /yr and –, respectively. Here, two panels are for two different SFR estimates: one is by SED fittings (SFRSED), and the other is by measured H line fluxes and from SED fittings (SFRHα). The former was estimated by the photometric SED fittings in the target selection processes (Paper I), using templates of exponentially decaying SFR evolution and five optical magnitudes in bands. Most galaxies were best-fitted with approximately constant SFR up to the galaxy age , i.e., the exponential time scale much larger than . Since the SED fittings are limited in the range of Gyr, there is a limit to the SFRSED- relation as SFR , which can be seen in this figure. For SFRs from observed H fluxes, we followed the same relation between SFR, H emission line luminosity, and as in Paper I (eq. 5). There is no clear correlation between and SFRHα, but the mean values are broadly consistent with the so-called main sequence of galaxies at similar redshifts (Karim et al., 2011; Speagle et al., 2014). The distribution of estimated by the SED fittings for galaxies with detected lines is shown in Fig. 10. Note that the fitting was limited in the range of .
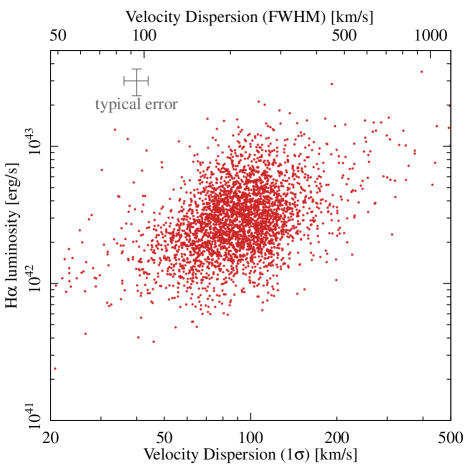
We also plot observed H luminosity versus velocity dispersion for line-detected galaxies in Fig 11. H luminosities of typical FastSound galaxies are in the range of – erg/s, which is the bright-end () of the H luminosity function (LF) at (Colbert et al., 2013). Here, velocity dispersion was calculated from the observed line width , and this is not deconvolved with the instrumental resolution ( km/s). Indeed the majority of galaxies have . A small fraction of galaxies with may be a result of low or spurious noise detection. We expect, on average, larger or more massive systems would have larger velocity dispersions, as expected from the general scaling relations for galaxies. A positive correlation is indeed seen in this figure, though a quantitative analysis and interpretation are beyond the scope of this paper.
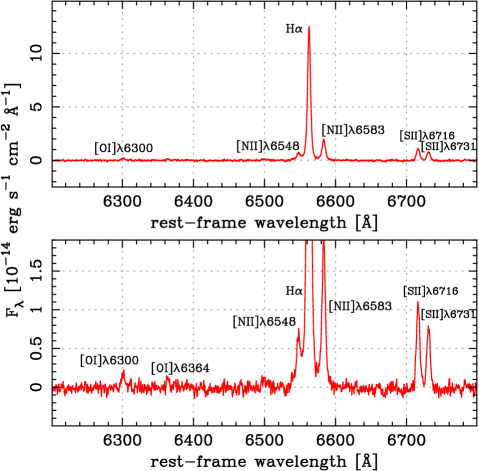
Finally, Fig. 12 shows the stacked and continuum-subtracted spectrum of all the FastSound emission line galaxies (2719 above 5), assuming that the strongest line is H. Along with the trivial H line, the major lines around H, i.e., [NII] and [SII] doublets, are clearly detected. The even weaker [OI] doublet (about 1 % level of H flux) is also seen. Table 4 summarizes the line fluxes relative to H.
| Line | relative flux |
|---|---|
| [OI]6300 | |
| [OI]6364 | |
| [NII]6548 | |
| [NII]6583 | |
| [SII]6717 | |
| [SII]6731 |
4 Contamination from Non-H Emission Lines
Though the majority of the emission lines detected in the FastSound survey are expected to be H, it is crucial to estimate the contamination fraction of other lines for precise scientific analyses. For example the clustering signal in the RSD analysis is diluted by large redshift errors, and because the errors are non-random a systematic aliasing may be introduced. Table 5 shows 11 emission lines that are generally found in star forming galaxies and hence can be confused with H lines, with a typical energy flux ratio against H. Most FastSound galaxies were detected with a single emission line, making it difficult to firmly identify redshifts. However, a fraction of relatively bright FastSound galaxies were detected with multiple lines, and we can estimate the contamination of non-H lines by the statistics of line identification for such galaxies. We report the statistics of multiple line galaxies in FastSound in §4.1, and in §4.2 estimate non-H fraction in all the FastSound galaxies based on the results of §4.1. We will also make an independent estimate of non-H fraction from the stacked spectrum of the FastSound galaxies in §4.3.
4.1 Emission Line Identification for Multiple-Line Objects
Though the wavelength range of FastSound is rather narrow (1.44–1.67 m), Table 5 indicates that most lines can be identified by nearby other lines if the sensitivity is good or galaxies are bright, because most lines can be classified into a group within a narrow wavelength range, i.e., H-[OIII], H-[NII]-[SII], and [SIII] systems. The only exception is [OII] at 2.9–3.5, which may be detected as a single line even if the galaxy is sufficiently bright, and hence the contamination of [OII] cannot be examined by multiple-line galaxies. (Actually [OII] is a close doublet, but its separation, 220 km/s, is small enough to be treated as a single line in the present catalog. See §2.3.) However, the statistics of the HiZELS narrow-band survey at a similar wavelength and sensitivity implies that this contamination is expected to be negligible compared with other contaminants such as [OIII] (Sobral et al., 2012). In fact, using the [OII] LF measured at (Khostovan et al., 2015), the expected number of galaxies whose [OII] fluxes are detectable by the FastSound sensitivity is 0.33% of that of H emitters at 1.2–1.5. [Here, we used the extinction-uncorrected H LF parameters at 0.9–1.5 reported by Colbert et al. (2013) for the number of H emitters, which are in good agreement with those at reported by Sobral et al. (2013).] Therefore, even if the target selection efficiency is the same for H and [OII], the contamination is only 0.3%. Furthermore, the actual contamination should be lower than this, because our target selection based on photometric redshifts should more efficiently remove [OII] emitters at than H emitters.
Another source of contamination not shown in Table 5 is the Paschen series in near infrared bands, among which the most significant for FastSound is expected to be Pa (1.282 m) at 0.12–0.30. Assuming a flux ratio of 0.1 for Pa/H, which is valid for typical extinction of 1 mag for H, we estimate the number of detectable Pa emitters in this redshift range to be 4.3% of H emitters detectable by FastSound. Here, we used the same H LF parameters at 1.2–1.5 as the previous paragraph, while the extinction-uncorrected LF parameters for H emitters at are estimated by interpolating those for 0.08 and 0.4 reported in Sobral et al. (2013). Furthermore, H emitters should be selected more efficiently as FastSound targets than Pa emitters, because of the selection by photo-. According to the photo- results of Tonegawa et al. (2014) for galaxies with spec- using the same five optical bands of CFHTLS, the probability that galaxies at are misidentified as galaxies at is less than 5%. Hence we conclude that the contamination from Pa emitters is negligible.
We constructed the sample of multiple-line objects in FastSound by requiring that a galaxy must have more than two lines detected at , and at least one of them is detected at . There are 1,105 galaxies satisfying this condition, which should be compared with 3,288, the number of all FastSound galaxies with a line detected at . We try to identify these multiple emission lines by the wavelength ratio. The observed wavelength ratios () are compared with all the possible pairs of lines in Table 5, allowing an error of , which is about four times larger than the statistical 1 error expected from the typical wavelength determination error of FastSound. When more than three emission lines are detected for a galaxy, we choose a pair of the two brightest lines, and hence the number of emission line pairs considered is the same as the number of multiple-line galaxies.
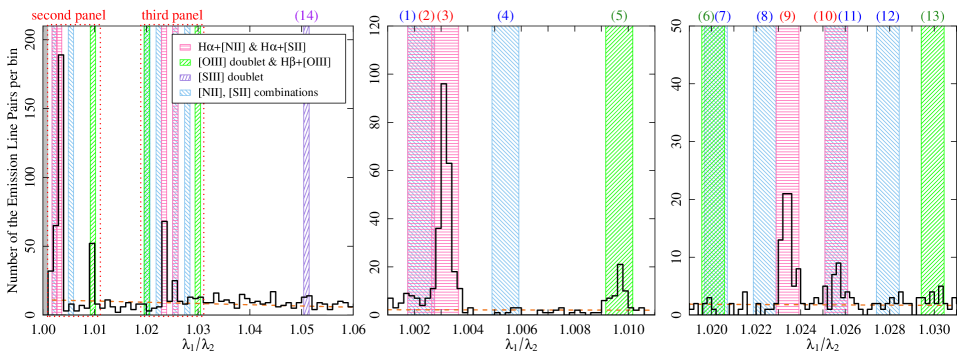
All possible 14 line pairs that can be detected in the FastSound wavelength range (1.44–1.67 m, i.e., ) are listed in Table 6, and the numbers of galaxies whose wavelength ratio is consistent with a line pair are also shown. The histogram of is shown in Fig. 13. A fraction of the detected line pairs may be artefacts because spurious lines are included in the FastSound line catalog, as discussed in Paper I. This fraction can be estimated in this histogram by the number of galaxies where no real emission line pairs are expected. After removing the wavelength ratio regions corresponding to the expected line pairs listed in Table 6, the histogram is fitted by a linear function, and this is used to estimate the number of artefacts. The real numbers of physical emission line pairs are thus estimated by subtracting these numbers, as reported in Table 6.
A problem is that some line pairs have overlapping wavelength ratios with the above allowance interval of . There are three such cases: (A) H/[NII]6548 = 1.00225 and [SII] doublet 6731/6717 = 1.00214, (B) [OIII]4959/H = 1.02007 and [SII]6717/[NII]6583 = 1.02020, and (C) [SII]6717/[NII]6548 = 1.02560 and [SII]6731/H = 1.02572. For the cases (A) and (C), it is expected that the majority of the detected galaxies should be H+[NII] and H+[SII] for (A) and (C), respectively, because H is the strongest line. Furthermore, if the [SII] doublet and [NII]6548+[SII]6717 are significantly detected in the line pair sample considered here, we expect that the [NII] doublet and [NII]6548+[SII]6731 should also be detected because of similar line fluxes. However these pairs are not significantly detected in the line pair sample (see Table 5). Therefore, we regard all the emission line pairs detected in the cases (A) and (C) as H plus [NII] or [SII]. For the case (B), no significant excess was found at this wavelength ratio, and hence we can safely ignore this.
Then the significantly detected line pairs in Table 6 can be classified into the two categories: one is pairs including H (denoted as H-X hereafter) and the other is the [OIII] doublets. Evidence for the H-[OIII]5007 and [SIII] doublet pairs is found, though statistical significance is about 2 level (chance probability of 5%). The number of galaxies whose line pairs are identified as H-X is 312.1 when the expected number of spurious detections is subtracted. Note that this number is slightly different from the simple sum of the corrected number in Table 6 because the numbers in this Table are multiply counted when the wavelength ratio ranges are overlapping. This number should be compared with the detected non-H pairs: 39.7, 6.4, and 5.2 for the [OIII] doublet, H-[OIII]5007, and [SIII] doublet, respectively.
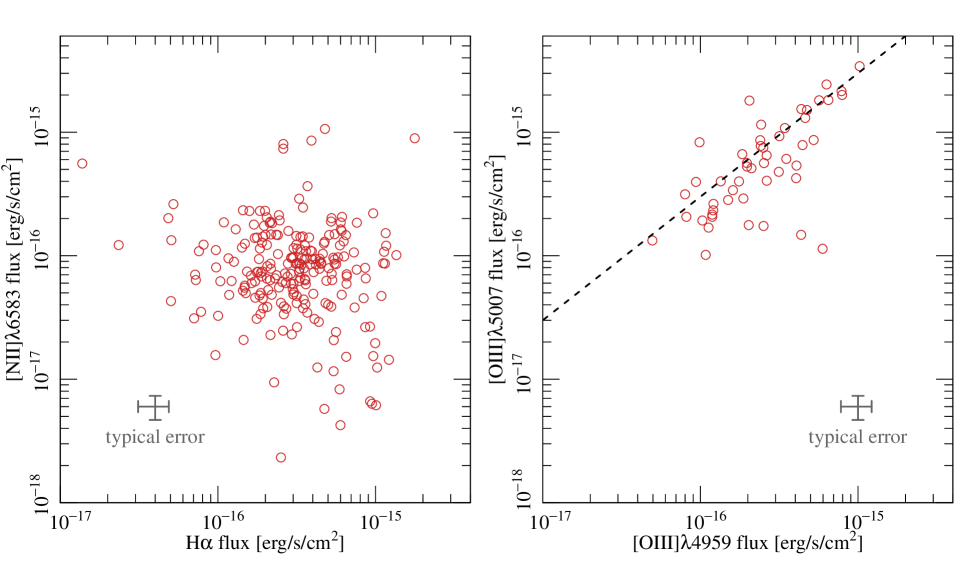
Fig. 14 shows the correlation plots of the line pair fluxes for H-[NII]6583 and the [OIII] doublets. Only weak correlation can be seen for H-[NII]6583, which is not unreasonable because the line flux ratio depends on metallicity and the ionization status of a star forming galaxy. On the other hand, we expect a tighter correlation for the [OIII] doublets around the expected value of 3:1 from atomic physics, and this is indeed observed in this figure.
| Emission line | wavelength [m]∗*∗*footnotemark: | relative flux | |
|---|---|---|---|
| [OII]3727 | – | ††\dagger††\daggerfootnotemark: | |
| H | – | ††\dagger††\daggerfootnotemark: | |
| [OIII]4959 | – | ††\dagger††\daggerfootnotemark: | |
| [OIII]5007 | – | ††\dagger††\daggerfootnotemark: | |
| [NII]6548 | – | ††\dagger††\daggerfootnotemark: | |
| H | – | ||
| [NII]6583 | – | ††\dagger††\daggerfootnotemark: | |
| [SII]6717 | – | ††\dagger††\daggerfootnotemark: | |
| [SII]6731 | – | ††\dagger††\daggerfootnotemark: | |
| [SIII]9069 | – | ‡‡\ddagger‡‡\ddaggerfootnotemark: | |
| [SIII]9531 | – | ‡‡\ddagger‡‡\ddaggerfootnotemark: |
| line (shorter) | line (longer) | wavelength ratio | number | noise∗*∗*footnotemark: | number (corrected)††\dagger††\daggerfootnotemark: | chance probability‡‡\ddagger‡‡\ddaggerfootnotemark: | |
|---|---|---|---|---|---|---|---|
| (1) | [SII]6717 | [SII]6731 | §§\S§§\Sfootnotemark: | ||||
| (2) | [NII]6548 | H | §§\S§§\Sfootnotemark: | ||||
| (3) | H | [NII]6583 | |||||
| (4) | [NII]6548 | [NII]6583 | |||||
| (5) | [OIII]4959 | [OIII]5007 | |||||
| (6) | H | [OIII]4959 | ∥∥\|∥∥\|footnotemark: | ||||
| (7) | [NII]6583 | [SII]6717 | ∥∥\|∥∥\|footnotemark: | ||||
| (8) | [NII]6583 | [SII]6731 | |||||
| (9) | H | [SII]6717 | |||||
| (10) | H | [SII]6731 | ##\###\#footnotemark: | ||||
| (11) | [NII]6548 | [SII]6717 | ##\###\#footnotemark: | ||||
| (12) | [NII]6548 | [SII]6731 | |||||
| (13) | H | [OIII]5007 | |||||
| (14) | [SIII]9069 | [SIII]9531 |
The expected number of spurious pairs originating from noise.
††\dagger††\daggerfootnotemark:
The number corrected for the spurious pair detection rate,
i.e., , with 1 statistical errors.
The upper bound is given at 2, assuming the
observed pairs are all spurious and hence no physical
line pairs were detected.
‡‡\ddagger‡‡\ddaggerfootnotemark:
The probability of finding the observed number or more of
line pairs by noise events under the Poisson statistics.
§§\S,∥∥\|,##\#§§\S,∥∥\|,##\#footnotemark: ,, These pairs are indistinguishable
due to the very close values of wavelength ratio.
4.2 Contamination Rate Estimation for Single Line Objects
Based on the statistics of multiple emission lines reported in the previous section, we estimate the contamination of non-H lines in the whole FastSound emission line catalog, in which most galaxies have only one line. The only line pair that was significantly detected except for those related to the H-[NII]-[SII] system is the [OIII] doublet. First we model the line detection completeness (i.e., the probability for an emission line to be detected as a single line), as a function of the total emission line flux ,
| (1) |
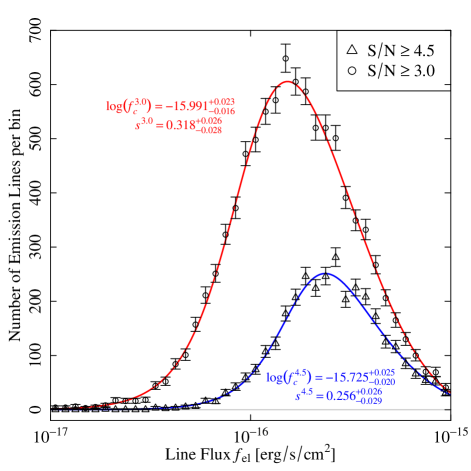
where is the line detection threshold , and and are the fitting parameters. For the line detection thresholds = 3.0 and 4.5, we estimated and by fitting the expected line flux distribution, to the observed distribution of the whole FastSound line catalog. Here, is the true differential flux counts per unit , and we assumed the form of to be the Schechter form, i.e., with and as free parameters. As shown in Fig. 15, we got sufficiently good fits, and obtained = (, ) and (, ) for and , respectively, where is in . Here, and have been marginalized to estimate the errors of and . The best-fit values for these are and , respectively.
Then we can calculate the expected number of [OIII] doublets with the line detection thresholds of and 3.0 for the stronger and weaker lines, as adopted in the analysis of the previous section, by
| (2) |
where is the line flux ratio of the line pair ( for [OIII] doublets), and is the flux counts for the stronger line of the [OIII] doublets. The expected number of all [OIII] lines including those detected as a single line in the whole FastSound sample is
| (3) |
Therefore, if we know the form of , we can calculate , and from the observed number of , we can estimate .
We cannot simply use the observed flux counts of the whole FastSound catalog for , because most of the lines are H. Instead, we calculate assuming the [OIII] LF at 1.9–2.3 to be the Schechter form with and , which are inferred from the observational estimates at 1.5–2.3 by Colbert et al. (2013). Here, a factor of 3/4 is multiplied to of Colbert et al. (2013) to correct the unresolved doublet luminosity into that of the stronger one. Then we found (error coming from those of and ), and hence our estimate of [OIII] lines in the whole FastSound line catalog () is %, where the error includes those of and Poisson statistics about the number of galaxies detected by [OIII] doublets, 39.7 (Table 6). Colbert et al. (2013) also presented another LF parameter fit where is fixed to , motivated by the value inferred from lower redshift data. We found that the [OIII] contamination fraction changes only by a factor of 1.039 when this LF parameter set is assumed. If we adopt and , the fraction becomes and %, respectively.
4.3 Estimation from the Stacked Spectrum
We can use the stacked spectrum in Fig. 12 to estimate the contamination of the [OIII] line. If the stronger line of the [OIII] doublets ([OIII]5007) is confused as a H line, we expect the other line ([OIII]4959) appearing at Å, where wavelengths are those in vacuum (see also Table 5). The stacked spectrum indeed shows an excess at this wavelength. The measured line ratio of the 6502 Å excess to H is . Since [OIII]5007 is stronger than 4959 by an exact factor of 3, we get an estimate of 2.91.2% as the contamination fraction of [OIII] doublets in the total H flux of the stacked spectrum. Neglecting the difference of the flux distribution, a similar fraction is expected for the number of galaxies detected by [OIII] rather than H. This result is in nice agreement with that derived from the multiple-line statistics and luminosity functions in the previous section.
It should be noted that the stacked spectrum also shows a marginal excess at 6375 Å, which may be a result of H when [OIII]5007 is confused to be H. However, this excess is not as large as that at 6502 Å, indicating that the mean H flux is fainter than [OIII]4959.
5 Conclusion
This is the second paper of the series of the FastSound project, a cosmological redshift survey that aims to detect redshift space distortion (RSD) in clustering of galaxies at . The basic concept and survey design were described in Paper I (Tonegawa et al., 2015b).
In §2, we presented in detail the FastSound catalog of emission line candidates and their host galaxies detected by the FastSound survey. The FastSound data set consists of the three tables: the FoV-information list for the observational records and galaxy/line statistics in each FMOS FoV, the galaxy catalog for information of all galaxies selected as FastSound targets, and the emission line catalog for all line candidates detected by the survey. The FastSound catalog contains 3,300 galaxies with at least one emission line detected at , corresponding to the total (fiber-aperture corrected) line flux limit of about . The catalog is already open to the public.
Because of the strength of H lines and our target selection for galaxies expected to have strong H flux based on photometric SED fittings, more than 90% of the detected lines are expected to be H (Tonegawa et al., 2014). We presented basic physical properties of the lines and host galaxies in §3, assuming that the strongest line in a galaxy is always H. The 3D distributions of the FastSound galaxies in the four CFHTLS Wide fields are visualized, clearly showing large scale clustering in the four boxes whose radial and tangential comoving length are typically 700 and 200 Mpc, respectively. Typical FastSound H emitters have H luminosities of – erg/s, SFRs of 20–500 /yr, and stellar masses of – .
Though the majority of FastSound emission lines are expected to be H, a quantitative estimate of non-H contamination is crucial for the primary scientific purpose of FastSound, because non-H contamination would result in damping of the clustering signal. Therefore we examined the galaxies with multiple line candidates, and from the wavelength ratio of line pairs, we identified the lines of 350 FastSound galaxies. It was found that about 88% of these are the H-[NII]-[SII] system, and the majority of the remaining 12% are the [OIII]4959,5007 doublet at 1.9–2.3. Galaxies with H-[OIII]5007 and [SIII]9069,9531 pairs are also detected with smaller statistical significance, but they are negligible compared with those identified by the [OIII] doublet. No other line pairs were clearly detected. From these statistics, and combined with the [OIII] LF at , we estimated the contamination of [OIII] doublets in the full FastSound catalog of galaxies with at least one detected emission line to be %. As an independent estimate, we calculated this contamination rate from the analysis of the stacked spectrum of 2719 FastSound galaxies, which resulted in a consistent value of 2.91.2%. The contamination by [OII]3727 line emitters cannot be examined only by the FastSound data set, but we showed that it is also negligible based on the recent studies of [OII] LF at high redshifts.
The forthcoming papers will discuss the metallicity evolution at (Paper III, Yabe et al. (2015)), the RSD measurement and a new constraint on the structure growth rate (Paper IV, Okumura et al. (2015)), and various other topics.
The FastSound project was supported in part by MEXT/JSPS KAKENHI Grant Numbers 19740099, 19035005, 20040005, 22012005, and 23684007. KG acknowledges support from ARC Linkage International Fellowship LX0989763. AB gratefully acknowledges the hospitality of the Research School of Astronomy & Astrophysics at the Australian National University, Mount Stromlo, Canberra where some of this work was done under the Distinguished Visitor scheme.
References
- Arnouts & Ilbert (2011) Arnouts, S., & Ilbert, O. 2011, Astrophysics Source Code Library, 1108.009
- Beutler et al. (2012) Beutler, F., et al. 2012, MNRAS, 423, 3430
- Bielby et al. (2013) Bielby, R., Hill, M. D., Shanks, T., et al. 2013, MNRAS, 430, 425
- Blake et al. (2011) Blake, C., et al. 2011, MNRAS, 415, 2876
- Brammer et al. (2012) Brammer, G. B., van Dokkum, P. G., Franx, M., et al. 2012, ApJS, 200, 13
- Cardelli et al. (1989) Cardelli, J. A., Clayton, G. C., & Mathis, J. S. 1989, ApJ, 345, 245
- Clifton et al. (2012) Clifton, T., Ferreira, P. G., Padilla, A., & Skordis, C. 2012, Phys. Rep., 513, 1
- Coil et al. (2011) Coil, A. L., Blanton, M. R., Burles, S. M., et al. 2011, ApJ, 741, 8
- Colbert et al. (2013) Colbert, J. W., Teplitz, H., Atek, H., et al. 2013, ApJ, 779, 34
- Cooper et al. (2011) Cooper, M. C., Aird, J. A., Coil, A. L., et al. 2011, ApJS, 193, 14
- Coupon et al. (2009) Coupon, J., Ilbert, O., Kilbinger, M., et al. 2009, A&A, 500, 981
- de la Torre et al. (2013) de la Torre, S., Guzzo, L., Peacock, J. A., et al. 2013, A&A, 557, A54
- Garnett (1989) Garnett, D. R. 1989, ApJ, 345, 282
- Geach et al. (2008) Geach, J. E., Smail, I., Best, P. N., et al. 2008, MNRAS, 388, 1473
- Glazebrook et al. (2003) Glazebrook, K., Baldry, I. K., Blanton, M. R., et al. 2003, ApJ, 587, 55
- Glazebrook et al. (2005) Glazebrook, K., Baldry, I., Moos, W., Kruk, J., & McCandliss, S. 2005, New Astronomy Reviews, 49, 374
- Guzzo et al. (2008) Guzzo, L., et al. 2008, Nature, 451, 541
- Goranova et al. (2009) Goranova, Y., et al. 2009, http://terapix.iap.fr/cplt/T0006-doc.pdf
- Gwyn (2012) Gwyn, S. D. J. 2012, AJ, 143, 38
- Hamilton (1998) Hamilton, A. J. S. 1998, The Evolving Universe, 231, 185
- Hawkins et al. (2003) Hawkins, E., Maddox, S., Cole, S., et al. 2003, MNRAS, 346, 78
- Ilbert et al. (2006) Ilbert, O., Arnouts, S., McCracken, H. J., et al. 2006, A&A, 457, 841
- Karim et al. (2011) Karim, A., Schinnerer, E., Martínez-Sansigre, A., et al. 2011, ApJ, 730, 61
- Khostovan et al. (2015) Khostovan, A. A., Sobral, D., Mobasher, B., et al. 2015, MNRAS, 452, 3948
- Kimura et al. (2010) Kimura, M., Maihara, T., Iwamuro, F., et al. 2010, PASJ, 62, 1135
- Kriek et al. (2015) Kriek, M., Shapley, A. E., Reddy, N. A., et al. 2015, ApJS, 218, 15
- Lawrence et al. (2007) Lawrence, A., Warren, S. J., Almaini, O., et al. 2007, MNRAS, 379, 1599
- Le Fèvre et al. (2005) Le Fèvre, O., Vettolani, G., Garilli, B., et al. 2005, A&A, 439, 845
- Lilly et al. (2009) Lilly, S. J., Le Brun, V., Maier, C., et al. 2009, ApJS, 184, 218
- Newman et al. (2013) Newman, J. A., Cooper, M. C., Davis, M., et al. 2013, ApJS, 208, 5
- Okumura et al. (2015) Okumura, T., Hikage, C., Totani, T., et al. 2015, arxiv:1511.08083 (Paper IV)
- Reid et al. (2012) Reid, B. A., Samushia, L., White, M., et al. 2012, MNRAS, 426, 2719
- Samushia et al. (2012) Samushia, L, Percival, W. J & Raccanelli, A 2013, MNRAS, 420, 2102
- Schlegel et al. (1998) Schlegel, D. J., Finkbeiner, D. P., & Davis, M. 1998, ApJ, 500, 525
- Sobral et al. (2009) Sobral, D., Best, P. N., Geach, J. E., et al. 2009, MNRAS, 398, 75
- Sobral et al. (2012) Sobral, D., Best, P. N., Matsuda, Y., et al. 2012, MNRAS, 420, 1926
- Sobral et al. (2013) Sobral, D., Smail, I., Best, P. N., et al. 2013, MNRAS, 428, 1128
- Speagle et al. (2014) Speagle, J. S., Steinhardt, C. L., Capak, P. L., & Silverman, J. D. 2014, ApJS, 214, 15
- Tonegawa et al. (2014) Tonegawa, M., Totani, T., Akiyama, M., et al. 2014, PASJ, 66, 43
- Tonegawa et al. (2015a) Tonegawa, M., Totani, T., Iwamuro, F., et al. 2015a, PASJ, 67, 31
- Tonegawa et al. (2015b) Tonegawa, M., Totani, T., Okada, H., et al. 2015b, PASJ, 67, 81 (Paper I)
- Weinberg et al. (2013) Weinberg, D. H., Mortonson, M. J., Eisenstein, D. J., et al. 2013, Phys. Rep., 530, 87
- Wirth et al. (2004) Wirth, G. D., Willmer, C. N. A., Amico, P., et al. 2004, AJ, 127, 3121
- Yabe et al. (2012) Yabe, K., Ohta, K., Iwamuro, F., et al. 2012, PASJ, 64, 60
- Yabe et al. (2015) Yabe, K., Ohta, K., Akiyama, M., et al. 2015, arxiv:1508.01512 (Paper III)