Microwave Emission from Hybridized States in a Semiconductor Charge Qubit
Abstract
We explore the microwave radiation emitted from a biased double quantum dot due to the inelastic tunneling of single charges. Radiation is detected over a broad range of detuning configurations between the dot energy levels with pronounced maxima occurring in resonance with a capacitively coupled transmission line resonator. The power emitted for forward and reverse resonant detuning is found to be in good agreement with a rate equation model, which considers the hybridization of the individual dot charge states.
The electronic properties of semiconductor nanostructures have been widely studied using transport measurements Beenakker and van Houten (1991). More recently, the use of radio and microwave frequency measurement techniques has enabled and stimulated a new generation of experiments Wallraff et al. (2004); Schoelkopf and Girvin (2008); Girvin et al. (2009) mostly with superconducting qubits. In similar device geometries the coupling of double quantum dots in carbon nanotubes Delbecq et al. (2011), gate-defined GaAs heterostructures Frey et al. (2012); Toida et al. (2013), InAs nano-wires Petersson et al. (2012), and graphene Deng et al. (2013) to GHz frequency coplanar waveguide resonators has been explored. Earlier experiments have investigated photon emission and lasing effects in superconducting circuits Astafiev et al. (2007); Hofheinz et al. (2011). More recently experiments studied photon emission from biased double quantum dots. Gain and micromaser action have been predicted Jin et al. (2011) and observed by pumping a single microwave resonator mode Liu et al. (2014, 2015).
Here, we experimentally explore inelastic tunneling in a semiconductor double quantum dot capacitively coupled to a transmission line resonator by detecting the microwave radiation emitted in the process. The detection of the weak microwave signals is facilitated by the use of near quantum limited parametric amplifiers Yurke and Buks (2006); Castellanos-Beltran and Lehnert (2007). Previous experiments on quantum dots coupled to microwave resonators Delbecq et al. (2011); Frey et al. (2012); Toida et al. (2013); Petersson et al. (2012); Deng et al. (2013) detected mostly polarizability allowing to extract charge stability diagrams. Here, we demonstrate that the level separation of hybridized states in a double quantum dot, if on resonance with the microwave resonator, can be investigated with high precision by directly detecting inelastic transitions. In particular, the tunneling rates, which are typically difficult to measure in pure dc transport experiments, are directly reflected in the power of the respective emitted microwave radiation. Future options include the possibility to characterize the classical and quantum properties of radiation emission from semiconductor nanostructures at microwave frequencies using correlation function measurements Bozyigit et al. (2011) or state tomography Eichler et al. (2012).
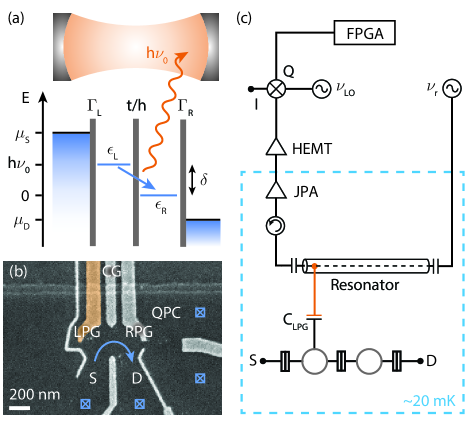
The hybrid device explored in our experiments is realized by capacitively coupling a gate-defined double quantum dot to an on-chip superconducting coplanar waveguide resonator [Fig. 1]. The gate structure depicted in Fig. 1(b) is patterned on top of a GaAs/AlGaAs heterostructure with a two-dimensional electron gas (2DEG) 90 nm below the surface. The quantum dots are formed by negatively biasing the top gates. The left and right plunger gates (LPG, RPG) control the electrochemical potentials () of the electrons in the respective dots and thereby the detuning energy between the dot levels. The center gate is used to adjust the interdot tunnel coupling energy . The tunnel coupling leads to a hybridization of the left and right dot states. The resulting bonding and antibonding states form a two-level system with an energy separation , where is Planck’s constant and denotes the transition frequency of the charge qubit Hayashi et al. (2003).
The 200 nm thick Al coplanar waveguide resonator has a bare resonance frequency of GHz () and a loaded quality factor of 2058. The center conductor of the resonator extends to the left dot forming the plunger gate shaded in orange, which mediates dipole coupling between double quantum dot and resonator [Fig. 1(c)] Frey et al. (2012); Toida et al. (2013). The sample is similar to the devices presented in Refs. Frey et al., 2012; Basset et al., 2013.
We first characterize the properties of the coupled system in microwave transmission measurements as described in Ref. Frey et al., 2012. This yields all parameter values relevant for the analysis of the photon emission data presented subsequently. A microwave tone of constant frequency set to the bare cavity frequency is transmitted through the resonator. The output field is first amplified by a Josephson parametric amplifier Eichler et al. (2014) providing quantum limited amplification Yurke and Buks (2006); Castellanos-Beltran and Lehnert (2007). A high electron mobility transistor amplifier provides a second amplification stage before the signal is mixed with a local oscillator microwave tone. The signal is subsequently digitally down-converted and processed with a field-programmable gate array, giving access to its amplitude and phase [Fig. 1(c)] Wallraff et al. (2004).
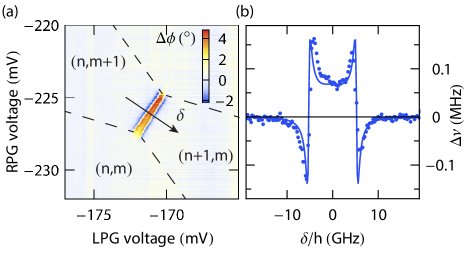
Charge delocalization between the dots leads to a dispersive frequency shift of the cavity seen as a change in phase of the transmitted tone as plotted in Fig. 2(a). The charge stability regions are indicated together with the -axis along which the detuning between the dots is varied van der Wiel et al. (2002). In the presented experiments, the number of electrons in each dot is on the order of 10 as determined by quantum point contact charge detection Field et al. (1993); Buks et al. (1998).
The dispersive frequency shift as a function of is measured by recording full transmission spectra. At detuning energies in the vicinity of the qubit-cavity resonance condition the resonator frequency is strongly shifted [Fig. 2(b)]. We calculate the frequency shift numerically using a Jaynes-Cummings model Childress et al. (2004) to extract the resonator-dot coupling strength , the interdot tunnel coupling energy and the decoherence rate . To analyze the emission experiments performed at different tunnel coupling energies discussed in the following, we have used a constant value of MHz, see supplemental material Sup .
With this device, decoherence rates as low as MHz were observed, which is more than an order of magnitude lower than for previous samples investigated in our group Frey et al. (2012); Basset et al. (2013) and comparable to the lowest rates observed in other experiments Toida et al. (2013); Wallraff et al. (2013); Viennot et al. (2014). We attribute the improvement to a combination of optimized filtering and a very stable 2DEG. It also manifests itself in a reduced electron temperature of mK as extracted from conductance resonances. Note that the improved coherence facilitates the emission experiments presented below.
To study photon emission from the double dot, we apply a bias of V () between source and drain. The bias is chosen to be smaller than both the charging energies and the single-particle level spacing to ensure single-level transport. The charging energy of each dot is roughly 1 meV (), as extracted from the stability diagram, and at V transport measurements show no excited states in the bias window. The tunnel coupling to the leads, adjusted to GHz, controls the current through the device.
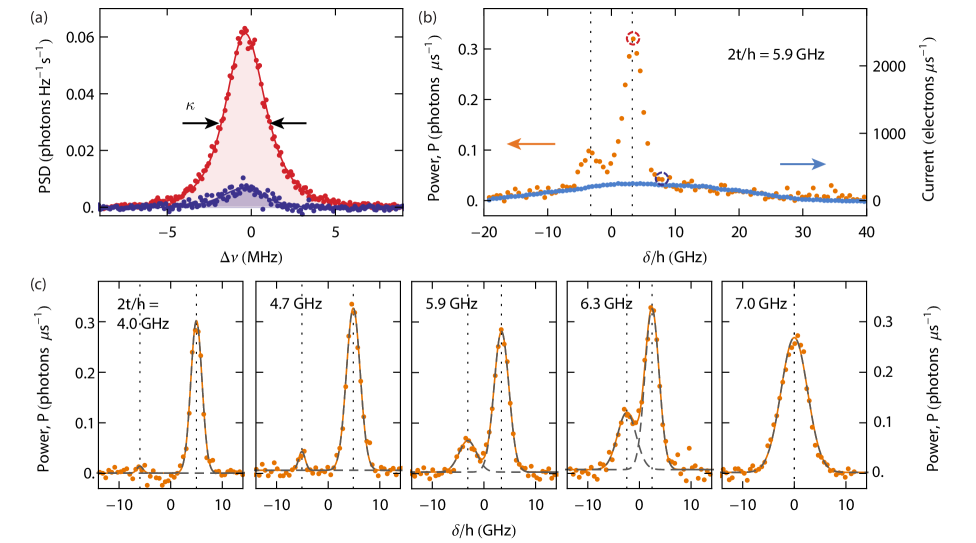
We measure the power spectral density (PSD) of photons emitted from the cavity Lang et al. (2011); Sup with the double quantum dot being the only source of radiation. For detuning values larger than the resonance frequency, we find a low photon signal of less than , see purple curve in Fig. 3(a). Close to resonance, the photon signal is significantly increased to more than (red curve) corresponding to an average number of photons in the resonator extracted from the integrated PSD. Both data sets fit well to a Lorentzian lineshape (solid lines) taking into account the frequency dependence of the parametric amplifier gain. The linewidths extracted from all PSD measurements are identical to the resonator linewidth MHz.
We measure the PSD vs. detuning around the lower triple point shown in Fig. 2(a). Integrating Lorentzian fits to the data yields the number of photons emitted from the cavity per unit of time, . The power is plotted in Fig. 3(b) as a function of detuning (orange) and compared to the simultaneously measured source-drain current (blue). We observe a pronounced resonance in the measured power at positive detuning () as well as a lower peak at negative detuning (). These maxima occur when the energy released in the interdot transition corresponds to the resonator frequency () yielding the resonant detuning energies
| (1) |
The background emission power away from the resonances is proportional to the current. We associate it with combined photon/phonon processes and tunneling processes between the left or right dot and the continuum of states in the leads. The proportionality factor is the same for all measurements and yields a background rate of roughly photons emitted from the cavity per transported electron. This shows that competing relaxation channels for the qubit, such as phonon emission, are relevant in inelastic processes even in the presence of the resonator Fujisawa et al. (1998); Hohenester et al. (2009); Liu et al. (2014); Gullans et al. (2015). Irrespective of the details of the non-radiative relaxation mechanism we expect the rate of photon emission into the resonator to be limited by the ratio of the qubit dephasing rate to the cavity linewidth .
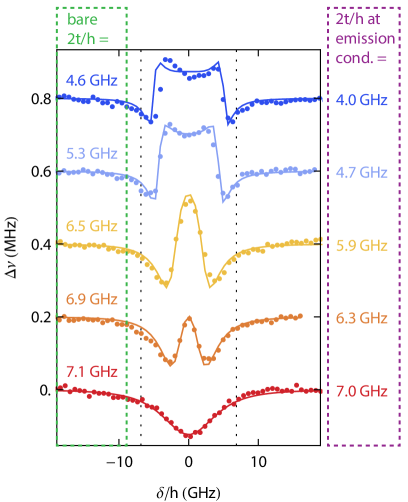
We investigate emission for interdot tunnel coupling rates up to GHz. Representative examples are shown in Fig. 3(c). We find that the emission power at increases with , while the separation between the resonances, indicated by vertical dashed lines, decreases. To analyze the resonances in emission in detail we subtract the background signal proportional to the current. A sum of two Gaussian lineshapes is fitted to the resonances to analyze the maximum power and resonant detuning [Fig. 3(c)]. We define the zero detuning to be centered between the resonances. For details of the PSD measurement and the extraction of the tunnel coupling, refer to the supplemental material Sup .
The extracted resonant detuning approaches zero as approaches [Fig. 4(a)]. For , we find a single resonance [Fig. 3(c)], which decreases in power and eventually vanishes when is further increased. For GHz the emission power at is below the noise level of our detection system for the chosen integration time, so that no points can be acquired in this region. The experimental data are well described by Eq. (1) and deviations lie within the error margins [Fig. 4(a)] where all parameters are directly determined from the experiment.
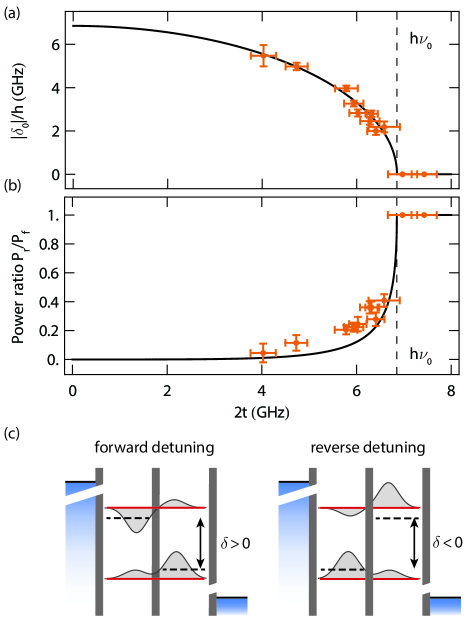
For the negative resonance condition , the detuning of the electronic states is reversed with respect to the source-drain bias [Fig. 4(c)]. In this configuration, transport is expected to be blocked if the hybridization of the occupation states of the left and right dots is not considered. The hybridized states are given by
| (2) | ||||
| (3) |
where is given by . Considering the antibonding wavefunction , we find the electron in the left dot with probability , which is a measure of the hybridization of the qubit states [Fig. 4(c)]. Even for reverse detuning, electrons can therefore tunnel into the excited state leading to photon emission at .
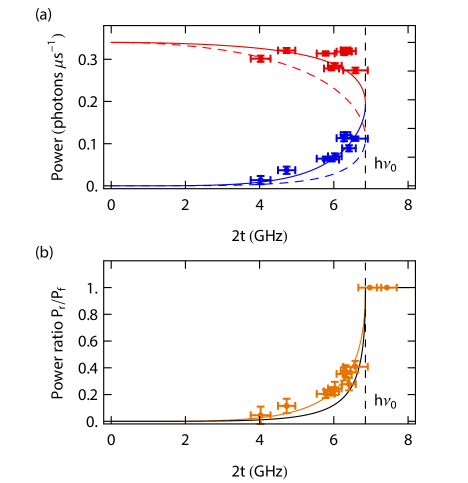
We find that emission power for forward detuning is roughly independent of while photon emission for reverse detuning increases with [Fig. 3(c)]. The power ratio approaches unity as approaches and the peaks merge [Fig. 4(b)].
We model the behavior of the emitted power with increasing using a master equation approach. We describe the system by three possible states: qubit in the excited state (excess electron in antibonding state), qubit in ground state (excess electron in bonding state) and qubit in state , which we define as the state with no excess electrons in the dots. This describes the system around the lower triple point. For the upper triple point, the third qubit state corresponds to two extra electrons in the dots leading to the same result. We arrive at the following rate equation for the occupation probabilities of the three qubit states Ou-Yang et al. (2010):
| (4) |
Here, we neglect the relaxation rate from the excited to the ground state. This is justified because we estimate Fujisawa et al. (2002), which is significantly smaller than the tunneling rates to the leads . The same holds for the resonator-dot coupling MHz. We confirmed that including in the rate equation does not significantly affect the power ratio even for MHz.
Because the resonant emission signal is generated in transitions from the excited state we expect the emission power to be proportional to , which is obtained using the steady-state condition . This yields the emission power ratio
| (5) |
The experimental results are well approximated by this model [black solid line in Fig. 4(b)]. There is, however, a systematic deviation, such that the power ratios in all experimental data are slightly higher than the model predicts. We can account for this deviation by considering energy dependent tunnel rates and , see Ref. Sup, . Note that, as for the resonant detuning [Fig. 4(a)], there is no free fitting parameter.
In conclusion, we investigated photon emission from a biased double quantum dot dipole coupled to a microwave cavity. We clearly distinguish between background emission and resonant photon emission of the qubit generated in inelastic interdot transitions. We found photon emission for both forward and reverse interdot detuning with respect to source-drain bias reflecting the distribution of wavefunctions in the hybridized electronic states. We modeled the results using a master equation approach for the double quantum dot and found good agreement with the experiment. In future experiments, microwave correlation function measurements could be used to investigate photon statistics Bozyigit et al. (2011); da Silva et al. (2010). For the low photon rates we detect from single-electron interdot transitions in our experiments photon antibunching is predicted Xu and Vavilov (2013).
Acknowledgements.
We thank C. Eichler for valuable advice, A. Hambitzer for contributions to device fabrication, and C. Lang and Y. Salathé for their support. We gratefully acknowledge discussions with G. Schön, A. Shnirman and P. Samuelsson. This work was financially supported by the Swiss National Science Foundation through the National Center of Competence in Research ”Quantum Science and Technology” and by ETH Zurich.References
- Beenakker and van Houten (1991) C. W. J. Beenakker and H. van Houten, in Solid State Physics 44, 1 (Academic Press, Inc., 1991).
- Wallraff et al. (2004) A. Wallraff, D. I. Schuster, A. Blais, L. Frunzio, R.-S. Huang, J. Majer, S. Kumar, S. M. Girvin, and R. J. Schoelkopf, Nature 431, 162 (2004).
- Schoelkopf and Girvin (2008) R. J. Schoelkopf and S. M. Girvin, Nature 451, 664 (2008).
- Girvin et al. (2009) S. M. Girvin, M. H. Devoret, and R. J. Schoelkopf, Phys. Scr. T137, 014012 (2009).
- Delbecq et al. (2011) M. R. Delbecq, V. Schmitt, F. D. Parmentier, N. Roch, J. J. Viennot, G. Fève, B. Huard, C. Mora, A. Cottet, and T. Kontos, Phys. Rev. Lett. 107, 256804 (2011).
- Frey et al. (2012) T. Frey, P. J. Leek, M. Beck, A. Blais, T. Ihn, K. Ensslin, and A. Wallraff, Phys. Rev. Lett. 108, 046807 (2012).
- Toida et al. (2013) H. Toida, T. Nakajima, and S. Komiyama, Phys. Rev. Lett. 110, 066802 (2013).
- Petersson et al. (2012) K. D. Petersson, L. W. McFaul, M. D. Schroer, M. Jung, J. M. Taylor, A. A. Houck, and J. R. Petta, Nature 490, 380 (2012).
- Deng et al. (2013) G. Deng, D. Wei, J. R. Johansson, M. Zhang, S. Li, H. Li, G. Cao, M. Xiao, T. Tu, G. Guo, H. Jiang, F. Nori, and G. Guo, arXiv:1310.6118 (2013).
- Astafiev et al. (2007) O. Astafiev, K. Inomata, A. O. Niskanen, T. Yamamoto, Y. A. Pashkin, Y. Nakamura, and J. S. Tsai, Nature 449, 588 (2007).
- Hofheinz et al. (2011) M. Hofheinz, F. Portier, Q. Baudouin, P. Joyez, D. Vion, P. Bertet, P. Roche, and D. Esteve, Phys. Rev. Lett. 106, 217005 (2011).
- Jin et al. (2011) P.-Q. Jin, M. Marthaler, J. H. Cole, A. Shnirman, and G. Schön, Phys. Rev. B 84, 035322 (2011).
- Liu et al. (2014) Y.-Y. Liu, K. D. Petersson, J. Stehlik, J. M. Taylor, and J. R. Petta, Phys. Rev. Lett. 113, 036801 (2014).
- Liu et al. (2015) Y.-Y. Liu, J. Stehlik, C. Eichler, M. J. Gullans, J. M. Taylor, and J. R. Petta, Science 347, 285 (2015).
- Yurke and Buks (2006) B. Yurke and E. Buks, J. Lightwave Technol. 24, 5054 (2006).
- Castellanos-Beltran and Lehnert (2007) M. A. Castellanos-Beltran and K. W. Lehnert, Appl. Phys. Lett. 91, 083509 (2007).
- Bozyigit et al. (2011) D. Bozyigit, C. Lang, L. Steffen, J. M. Fink, C. Eichler, M. Baur, R. Bianchetti, P. J. Leek, S. Filipp, M. P. da Silva, A. Blais, and A. Wallraff, Nat. Phys. 7, 154 (2011).
- Eichler et al. (2012) C. Eichler, D. Bozyigit, and A. Wallraff, Phys. Rev. A 86, 032106 (2012).
- Hayashi et al. (2003) T. Hayashi, T. Fujisawa, H. D. Cheong, Y. H. Jeong, and Y. Hirayama, Phys. Rev. Lett. 91, 226804 (2003).
- Basset et al. (2013) J. Basset, D.-D. Jarausch, A. Stockklauser, T. Frey, C. Reichl, W. Wegscheider, T. M. Ihn, K. Ensslin, and A. Wallraff, Phys. Rev. B 88, 125312 (2013).
- Eichler et al. (2014) C. Eichler, Y. Salathe, J. Mlynek, S. Schmidt, and A. Wallraff, Phys. Rev. Lett. 113, 110502 (2014).
- van der Wiel et al. (2002) W. G. van der Wiel, S. De Franceschi, J. M. Elzerman, T. Fujisawa, S. Tarucha, and L. P. Kouwenhoven, Rev. Mod. Phys. 75, 1 (2002).
- Field et al. (1993) M. Field, C. G. Smith, M. Pepper, D. A. Ritchie, J. E. F. Frost, G. A. C. Jones, and D. G. Hasko, Phys. Rev. Lett. 70, 1311 (1993).
- Buks et al. (1998) E. Buks, R. Schuster, M. Heiblum, D. Mahalu, and V. Umansky, Physica B: Condensed Matter 249 - 251, 295 (1998).
- Childress et al. (2004) L. Childress, A. S. Sørensen, and M. D. Lukin, Phys. Rev. A 69, 042302 (2004).
- Wallraff et al. (2013) A. Wallraff, A. Stockklauser, T. Ihn, J. R. Petta, and A. Blais, Phys. Rev. Lett. 111, 249701 (2013).
- Viennot et al. (2014) J. J. Viennot, M. R. Delbecq, M. C. Dartiailh, A. Cottet, and T. Kontos, Phys. Rev. B 89, 165404 (2014).
- Lang et al. (2011) C. Lang, D. Bozyigit, C. Eichler, L. Steffen, J. M. Fink, A. A. Abdumalikov Jr., M. Baur, S. Filipp, M. P. da Silva, A. Blais, and A. Wallraff, Phys. Rev. Lett. 106, 243601 (2011).
- Fujisawa et al. (1998) T. Fujisawa, T. H. Oosterkamp, W. G. van der Wiel, B. W. Broer, R. Aguado, S. Tarucha, and L. P. Kouwenhoven, Science 282, 932 (1998).
- Hohenester et al. (2009) U. Hohenester, A. Laucht, M. Kaniber, N. Hauke, A. Neumann, A. Mohtashami, M. Seliger, M. Bichler, and J. J. Finley, Phys. Rev. B 80, 201311 (2009).
- Gullans et al. (2015) M. J. Gullans, Y. Y. Liu, J. Stehlik, J. R. Petta, and J. M. Taylor, arXiv:1501.03499 (2015).
- Ou-Yang et al. (2010) S.-H. Ou-Yang, C.-H. Lam, and J.-Q. You, Chinese Physics B 19, 050519 (2010).
- Fujisawa et al. (2002) T. Fujisawa, D. G. Austing, Y. Tokura, Y. Hirayama, and S. Tarucha, Nature 419, 278 (2002).
- da Silva et al. (2010) M. P. da Silva, D. Bozyigit, A. Wallraff, and A. Blais, Phys. Rev. A 82, 043804 (2010).
- Xu and Vavilov (2013) C. Xu and M. G. Vavilov, Phys. Rev. B 88, 195307 (2013).
- (36) See Supplemental Material [url], which includes Refs. Lang (2014); MacLean et al. (2007); Amasha et al. (2008); Roessler et al. (2015) .
- Lang (2014) C. Lang, Ph.D. thesis, Diss. ETH No. 21779, ETH Zurich (2014).
- MacLean et al. (2007) K. MacLean, S. Amasha, I. P. Radu, D. M. Zumbühl, M. A. Kastner, M. P. Hanson, and A. C. Gossard, Phys. Rev. Lett. 98, 036802 (2007).
- Amasha et al. (2008) S. Amasha, K. MacLean, I. P. Radu, D. M. Zumbühl, M. A. Kastner, M. P. Hanson, and A. C. Gossard, Phys. Rev. B 78, 041306 (2008).
- Roessler et al. (2015) C. Roessler, D. Oehri, O. Zilberberg, G. Blatter, M. Karalic, J. Pijnenburg, A. Hofmann, T. Ihn, K. Ensslin, C. Reichl, and W. Wegscheider, arXiv:1503.02928 (2015).
Supplemental material to
“Microwave Emission from Hybridized States in a Semiconductor Charge Qubit”
A. Stockklauser∗, V. F. Maisi, J. Basset†, K. Cujia, C. Reichl, W. Wegscheider, T. Ihn, A. Wallraff, K. Ensslin
Department of Physics, ETH Zürich, CH-8093 Zurich, Switzerland
(Dated: 24 July 2015)
I Measurement details
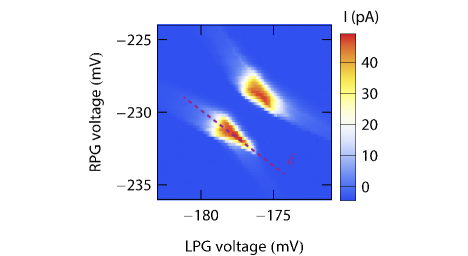
The emission experiment is performed at finite source-drain bias where the triple points of a charge stability diagram expand into finite bias triangles [Fig. S1]. We measure the emitted power at the lower triangle and vary the interdot detuning by tuning the left and right plunger gate voltages along the -axis indicated by the dashed purple line [Fig. 3(b)]. We additionally study emitted power vs. tunnel coupling [Fig. 3(c)] by tuning the center gate [Fig. 1(b)] voltage.
I.1 Extraction of tunnel coupling
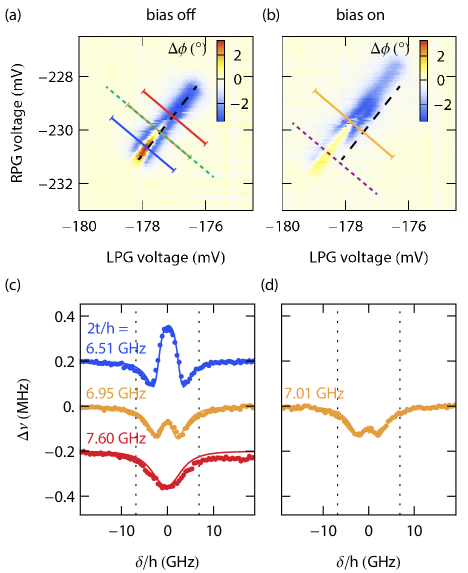
For each center gate voltage, the tunnel coupling energy is extracted individually from microwave transmission measurements Frey et al. (2012). Without source-drain bias, transmission measurements show a phase shift of the output microwave signal in the region of the charge degeneracy line connecting the triple points [Fig. S2(a)]. At finite bias, the phase shift extends further along the base lines of the finite bias triangles. We aim at extracting the interdot tunnel coupling of the biased system at the lower finite bias triangle corresponding to the conditions of the emission measurements [purple line in Fig. S1 and Fig. S2(b)]. However, we observe that the charge transport occuring within the finite bias triangles changes the phase and frequency response of the resonator compared to the unbiased system. We therefore extract the tunnel coupling using the Jaynes-Cummings description from measurements without source-drain bias where there is no transport through the system.
The tunnel coupling between the dots is not constant along the charge degeneracy line but decreases for more negative plunger gate voltages which is observed in the phase shift [Fig. S2(a)]. This is due to the effect of the cross-coupling of the plunger gates on the central tunnel barrier and thereby on . We can quantify the change of tunnel coupling by measuring full transmission spectra vs. detuning for multiple cuts through the charge degeneracy line [Fig. S2(a) and (c)] and find that decreases linearly with plunger gate voltage.
In the unbiased case the cavity frequency shift disappears at the triple points, so that the Jaynes-Cummings Hamiltonian cannot model the frequency shift and has to be extracted between the triple points [dashed green line, Fig. S2(a)]. For the emission measurements presented in Fig. 3(c), the bare interdot tunnel coupling is extracted from the frequency shifts shown in Fig. S3 and the values are given in the dashed green box. We extrapolate the linear relation between and the plunger gate voltages to obtain at the triple point.
Additionally, we need to take the effect of the bias on the tunnel coupling into account. Applying a bias of V shifts the charge degeneracy line slightly in the LPG/RPG plane leading to a change of MHz in for points on the charge degeneracy line [cf. orange curves in Fig. S2(c) and (d)]. With this correction we find the shifted for the parameter settings of the emission experiment, which are listed in the dashed purple box in Fig. S3.
The simulation based on the Jaynes-Cummings model yields up to a systematic uncertainty between 50 and 200 MHz, depending on the tunnel coupling. An additional error is introduced by the linear extrapolation described above. Finally, the correction for the bias shift also entails a small additional uncertainty. The error bars plotted in Fig. 4(a) and (b) include these three error sources.
I.2 Power spectral density
The field quadratures I and Q of the emitted microwave radiation are measured in a heterodyne detection scheme. Fast signal processing with a field programmable gate array (FPGA) gives access to correlations of the emitted photons. We compute the power spectral density by taking the Fourier transform of the first-order auto-correlation function of the complex signal amplitude Lang et al. (2011).
We need to resolve a small photon signal on the order of generated by the biased double quantum dot. To distinguish this signal from the noise, we subtract zero-bias reference data. For this purpose, we alternate between measurements with the bias turned on and off in this case taking 40 repetitions. After averaging the measurement (bias on) and the reference (bias off) data, we obtain the PSDs and . Subtracting the two yields the power spectral density of the signal modes in which we are interested: Details about the measurement technique and signal processing can be found in Ref. Lang, 2014.
The PSD plotted in Fig. 3(a) is scaled to represent the number of photons emitted from the resonator per Hz and per second. To obtain this scaling , the number of noise photons at the input of the parametric amplifier was determined using the AC Stark shift observed in a superconducting qubit measurement with a similar detection chain in the same cryostat.
II Rate equation calculations
In the model presented in the main text we neglect the decay rate and assume energy independent tunnel barriers. This yields the rate equation for the probabilities to find the system in one of its three states, where and
We calculate using the steady-state condition and and find
| (6) |
This expression describes the -dependence of the power emitted at each resonance condition and is indicated with dashed lines in Fig. S4(a). We assume and scale the curves to agree with the measured emission power. Experimentally, we observe that the emitted power at (blue) increases with , while the emission power at (red) hardly depends on , which clearly deviates from the behavior predicted by Eq. (6). A possible -dependence of the decay rate from excited to ground state related to photon emission into the resonator is not taken into account. Note that the peaks are merged for the last two data points, which are therefore omitted in the figure.
This deviation is also apparent when we consider the power ratio
which is plotted in black in Fig. S4(b). No assumptions for the tunnel rates to the leads (, ) and no scaling factor enter this expression.
II.1 Energy dependent tunnel rates to the leads
We can generalize the model by allowing an energy dependence of the tunnel rates and , i.e. the tunnel rates into and out of the excited state , differ from those into and out of the ground state , MacLean et al. (2007). The energy dependence can arise from changes in the tunnel coupling or the density of states in the leads. We find the generalized transition matrix:
The steady state condition now yields a modified excited state occupation probability . A first assumption could be that the left and right barriers are both energy dependent in the same way, i.e. and with some factor c typically . This, however, does not influence the theoretically predicted power ratio.
We can correct for the deviation in Fig. S4(b) if we assume that only the tunnel rate from the left lead increases with energy: . More specifically, we assume and . We fit the data to the modified power ratio yielding . The order of magnitude of this energy dependence seems realistic considering the findings of other transport experiments Amasha et al. (2008); Roessler et al. (2015). We assume that the origin for the energy dependence lies in a modulated density of states due to gate geometry and disorder Roessler et al. (2015). In the measured device the left and right side gate influence the double dot confinement potential very differently, which is not expected from the device geometry. This could be the reason for the left/right asymmetry of the tunnel rates to the leads.
The resulting modified expressions for the emitted power and the power ratio are shown in Fig. S4 and the agreement with the experimental data is considerably improved. Simply assuming does not influence the power ratio, the asymmetric energy dependence is therefore necessary to account for the deviation.
II.2 Resonance linewidth
Further information about the emission process can be gained from analyzing the linewidth of the emission resonances. The Gaussian peaks fitted to the data in Fig. 3.(c) have a full width at half maximum (FWHM) between 1 and 5 GHz increasing with [Fig. S5].
This linewidth can be set in relation to the energy broadening of the electronic dot states. We assume that the resonances of the electronic states are Lorentzian with a FWHM . The emission signal is described by a convolution of the two states involved in the transition, which yields a Lorentzian in with linewidth :
The emission amplitude depends on the detuning between the dot states and is in our model proportional to the excited state occupation probability: . The resonator linewidth MHz is much smaller than , so that the resonator response can be approximated as a -function and neglected in this consideration.
We are interested in the emission resonances at constant as a function of detuning :
| (7) |
This is not Lorentzian in but yields two peaks symmetric in , explaining the two resonances we observe in emission.
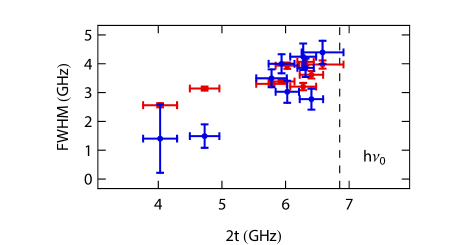
By fitting Eq. (7) to the measured emission resonances, we find GHz. This corresponds to a width GHz of the electronic quantum dot states. We assume that the main contributions to the broadening of the electronic states are the double dot decoherence and the coupling to the leads. In the emission measurements the decoherence lies between 0.5 and 1 GHz while the coupling rate to the leads is GHz. Because both of these contributions are of the same order of magnitude we cannot distinguish their individual effects. Investigating the effect of decoherence on the emission linewidth would, however, be an interesting subject of further study.
References
- Frey et al. (2012) T. Frey, P. J. Leek, M. Beck, A. Blais, T. Ihn, K. Ensslin, and A. Wallraff, Phys. Rev. Lett. 108, 046807 (2012).
- Lang et al. (2011) C. Lang, D. Bozyigit, C. Eichler, L. Steffen, J. M. Fink, A. A. Abdumalikov Jr., M. Baur, S. Filipp, M. P. da Silva, A. Blais, and A. Wallraff, Phys. Rev. Lett. 106, 243601 (2011).
- Lang (2014) C. Lang, Ph.D. thesis, Diss. ETH No. 21779, ETH Zurich (2014).
- MacLean et al. (2007) K. MacLean, S. Amasha, I. P. Radu, D. M. Zumbühl, M. A. Kastner, M. P. Hanson, and A. C. Gossard, Phys. Rev. Lett. 98, 036802 (2007).
- Amasha et al. (2008) S. Amasha, K. MacLean, I. P. Radu, D. M. Zumbühl, M. A. Kastner, M. P. Hanson, and A. C. Gossard, Phys. Rev. B 78, 041306 (2008).
- Roessler et al. (2015) C. Roessler, D. Oehri, O. Zilberberg, G. Blatter, M. Karalic, J. Pijnenburg, A. Hofmann, T. Ihn, K. Ensslin, C. Reichl, and W. Wegscheider, arXiv:1503.02928 (2015).