500 days of Stromgren b, y and narrow-band [OIII], Ha photometric evolution of gamma-ray Nova Del 2013 (= V339 Del)
Abstract
We present and discuss highly accurate photometry obtained through medium Stromgren , bands and narrow [OIII], H bands covering 500 days of the evolution of Nova Del 2013 since its maximum brightness. This is by far the most complete study of any nova observed in such photometric systems. The nova behaviour in these photometric bands is very different from that observed with the more conventional broad bands like or , providing unique information about extent and ionization of the ejecta, the onset of critical phases like the transition between optically thick and thin conditions, and re-ionization by the central super-soft X-ray source. The actual transmission profiles of the , , [OIII] and H photometric filters have been accurately measured at different epochs and different illumination angles, to evaluate in detail their performance under exact operating conditions. The extreme smoothness of both the H and [OIII] lightcurves argues for absence of large and abrupt discontinuities in the ejecta of Nova Del 2013. Should they exist, glitches in the lightcurves would have appeared when the ionization and/or recombination fronts overtook them. During the period of recorded very large variability (up to 100 over a single day) in the super-soft X-ray emission (from day +69 to +86 past maximum), no glitch in excess of 1% was observed in the optical photometry, either in the continuum (Stromgren ) or in the lines ([OIII] and H filters), or in a combination of the two (Stromgren , Johnson and ). Considering that the recombination time scale in the ejecta was one week at that time, this excludes global changes of the white dwarf as the source of the X-ray variability and supports instead clumpy ejecta passing through the line of sight to us as its origin.
keywords:
stars: novae - photometry1 Introduction
The vast majority of the photometric observations carried out on novae at optical wavelengths has been obtained with Johnson UBV and Cousins photometric systems. The introduction of equatorial standards by Landolt (1973, 1983, 1992, 2009), recently expanded to +50∘ declinations (Landolt 2013), together with the almost exclusive use of CCDs as detectors during the last 25 years, has brought more order and uniformity to the photometry of novae. In recent years, the Sloan system (Fukugita et al. 1996, Smith et al. 2002) is being progressively introduced into leading observing facilities, and the amount of photometry of novae collected with this system is slowly increasing.
Common to both the Johnson-Cousins and Sloan systems is the large width of their photometric bands, that trades diagnostic capability with the appeal to reach fainter magnitudes. Novae have very complex spectra, dominated by continuum emission around maximum brightness and by a few very strong nebular lines during advanced decline. As a consequence, the astrophysical meaning of photometry collected in the Johnson-Cousins and Sloan systems steadily declines in pace with the decline of a nova from optical maximum, as the percentage of the recorded flux shifts more and more away from continuum and toward a few emission lines. These emission lines may lie close to the edges of the photometric bands (expecially true for [OIII] 4959, 5007 Å and the and bands), where small differences from one set of filters to another may spoil completely the possibility to meaningfully combine data on the same nova collected with different instruments.
Optical photometry of novae in photometric systems other than is exceedingly rare. This is not due to the paucity of photometric systems - more than 200 of them are documented in the Asiago Database of Photometric Systems (Moro and Munari 2000, Fiorucci and Munari 2003) - but to the unpredictability of nova eruptions. Thus, when a nova erupts, an observer rushes to the telescope (or places an urgent request for service observing) and uses whatever photometric device is already mounted and available, usually equipped with the general purpose or filters. This is even more the case at later times, when observations of the fading nova requires longer integrations and are more diluted in time.
Nonetheless, some timid attempts to observe novae in photometric systems other than have been carried out in the past. The second most used photometric system for general astronomical application has been the uvby Stromgren (1956) system (cf the General Catalog of Photometric Data111http://obswww.unige.ch/gcpd/gcpd.html by Mermilliod, Mermilliod and Hauck 1997). At the time of single channel photo-electric photometry, a few novae have been observed in this system, notably Nova Cyg 1975 (Lockwood and Millis 1976) and Nova Cyg 1978 (Gallagher et al. 1980, Kaler 1986). These pionering attempts soon recognized the value of the Stromgren band in tracing the emission in the continuum without contamination by emission lines. However, these early efforts did not continue into the CCD era, presumably because of the difficulties of manufacturing Stromgren interference filters in larger formats and using them in converging beams instead of the parallel beams of earlier photo-electric photometers.
In recent years, classical interference filters has been replaced by far more efficient multi-layer dielectric filters, removing the obstacles in using them with large CCD detectors and fast converging light beams. Consequently, it seems now appropriate to reconsider the Stromgren uvby filters in the context of diagnostic photometry of nova outbursts. In this paper we present our extensive Stromgren b,y photometry of Nova Del 2013, densely and accurately covering the first 500 days of its outburst, in what appears to be - to the best of our knowledge - the best ever recorded Stromgren lightcurve for a nova.
The photometry of novae through a narrow filter isolating a single emission line has been even less popular in the past, one such attempt being the photometry of Nova Del 1967 through an H filter by Mannery (1970). In parallel with Stromgren b,y filters, we have also followed the evolution of Nova Del 2013 through narrow filters transmitting H and [OIII] 5007 Å lines. This paper represents the first actual implementation of the Stromgren/Narrow-band photometry we initially explored on Nova Mon 2012 (Munari et al. 2013) by integrating the filter transmission profiles on accurately fluxed spectra. A comprehensive discussion of the performances on novae of Stromgren and narrow band filters is postponed to when at least a few additional other novae have been observed through these filters.
2 Overview of Nova Del 2013
Nova Del 2013 was discovered at =6.8 on Aug 14.584 UT by K. Itagaki (Nakano et al. 2013), and was designated PNV J20233073+2056041 when it was posted to the TOCP webpage. Spectroscopic classification as a FeII-class nova was provided by Darnley et al. (2013) from Aug 14.909 UT spectra and by Shore et al. (2013a) from Aug 14.87 UT spectra.
The nova progenitor is the faint =17.2 star USNO B-1 1107-0509795. Denisenko et al. (2013) reported the nova still in quiescence at 17.1 mag fourteen hours before the discovery by Itakagi, which indicates a very fast rise to maximum. This well agrees with the modeling of CHARA Array infrared interferometric observations by Schaefer et al. (2014) that fix around Aug 14.3 the start of the observed fireball expansion of Nova Del 2013. Deacon et al. (2014) searched the PanSTARRS-1 image archive and identified twenty-four observations in the 1.2 years before outburst, during which the progenitor did not brighten significantly in comparison with the archival plate photometry reported by Munari and Henden (2013). The latter found the mean brightness of the progenitor, as recorded on Asiago plates exposed between 1979-1982, to be =17.27 and =17.60, for a mean color index =0.33, and measured a mean =17.33 from APASS observations in 2012. The recorded total amplitude of variation in B band is 0.9 mag, with color and amplitude in agreement with a progenitor dominated by the emission from an accretion disc. Such values are in excellent agreement with USNO-B1 values from Palomar surveys 1 and 2 (from plates exposed in 1951 and 1990), arguing for a long term stability of the progenitor before the 2013 eruption.
Various preliminary reports were made on early optical photometric evolution of Nova Del 2013 (CBET 3628, CBET 3634, IAUC 9258, Tomov et al. 2013, Munari et al. 2013b, Chochol et al. 2014). Munari et al. (2013d) presented and discussed an accurate and densely mapped ,,, lightcurve of Nova Del 2013 covering the time interval from pre-maximum until after the transition from otically thick to optically thin ejecta, two months into the decline. Maximum brightness in and bands occurred around August 16.4 UT (JD 2456520.9, the from which time is counted in this paper) at 4.46 and 4.70, thus setting the outburst amplitude to =12.5 mag. The characteristic decline times were =12, =30 and =10.5, =23.5 days, which place Nova Del 2013 in a borderline position between fast and very fast novae according to the Warner (1995) classification scheme. The lightcurve of Munari et al. (2013d) shows a smooth decline for Nova Del 2013, a brief plateau appearing soon after maximum brightness and lasting ∼2 days, a longer plateau extending from about day +20 to +37 that started when the nova had declined by =2.8 mag from maximum brightness, the transition around day +62 from optically thick to optically thin conditions of the ejecta occurring 6.0 mag down from maximum brightness, and blue intrinsic colors =+0.14 at maximum and =+0.04 at , that become =0.04 and =0.14 once corrected for the low =0.18 insterstellar reddening affecting the nova (cf. Tomov et al. 2013, Munari et al. 2013a).
A rich ensamble of preliminary reports described the early evolution of the optical and UV spectrum of Nova Del 2013 (Shore et al. 2013a,b,c,d,e,f, Shore et al. 2014, Munari et al. 2013a,b,c, Darnley et al. 2013, Darnley and Bode 2013, Tomov et al. 2013, Tarasova 2013, Tarasova and Shakhovskoi 2013, Woodward et al. 2013, Skopal et al. 2014a), with a more structured report presented by Skopal et al. (2014b). The wealth of optical spectroscopic information so far circulated is so large that is practically impossible to even quickly summarize it, not to mention the fact that huge spectroscopic databases on Nova Del 2013 (including ours, to be studied elsewhere) have not yet been studied. Here it would suffice to say that the spectral evolution of Nova Del 2013 has followed the path of typical FeII-class novae, with expansion velocities ranging from 610 and 2500 km/s (depending on the spectral feature and epoch, which in turn depend of the optical depth, 3D structure and ionization of the ejecta that evolve with time). Pre-maximum spectra showed extremely strong P-Cyg profiles on Balmer and FeII lines, and pure HeI aborptions. At the time of optical maximum, most of the emission had gone and the deep absorptions reinforced; only CaII H&K and H remained in prominent emission, of similar intensity and flanked by very deep P-Cyg absorptions. The first days into decline saw the progressive reduction of absorption lines, and re-emergence of emission by Balmer and FeII lines. Five days past optical maximum the P-Cyg absorptions disappeared from all lines (except for CaII H&K), at the time when FeII lines peaked in their intensity compared to Balmer lines. With passing time the excitation and ionization of the ejecta increased, with HeI appearing in emission in September and HeII in October 2013. The transition from optically thick to thin conditions, marked conventionally by [OIII] surpassing in strength H, occurred in mid October 2013, and [OIII] became stronger than the blend H+[NII] in early January 2014 marking the transition toward advanced nebular conditions. The profile of emission lines have shown remarkable changes along the evolution, before settling on a distinct double peaked shape, with a separation of 1100 km/sec for HeII and 900 for [OIII].
Schaefer et al. (2014) performed interferometric observations of Nova Del 2013 with the CHARA Array during the first 43 days of the outburst. They detected an ellipticity in the light distribution, suggesting a prolate or bipolar structure that develops as early as the second day. Combining the angular expansion rate with radial velocity measurements, they derived a a geometric distance to the nova of 4.50.6 kiloparsecs from the Sun. The maximum-magnitude-to-rate-of-decline (MMRD) relation (Downes and Duerbeck 2000) gives a distance ranging from 3.3 kpc to 4.1 kpc, depending on the adoption of the linear or nonlinear MMRD formulations.
Nova Del 2013 has been subject of intensive monitoring by the X-ray Swift satellite and sparser visits by Chandra and XMM (Kuulkers et al. 2013, Nelson et al. 2013, Osborne et al. 2013b, Page et al. 2013, Page et al 2014). First detection of very weak X-ray emission occurred on day +33, and was consistent with shocked gas in an expanding nova shell with no evidence for super-soft emission. The latter began to emerge, albeit at very low flux levels, on day +58. It was only on day +69 that the soft X-rays flux started to increase, reaching 1 count/sec over the 0.31.0 keV energy range. The super-soft X-ray emission reached a peak value of 100 counts/sec on day +86. At the same time a quasi-periodic oscillation (QPO) of 54 sec was present in the data. This periodicity was confirmed by Newton-XMM X-ray observations for day +97. This QPO is similar to the one seen at 35 sec in both nova RS Oph and nova KT Eri. The origin of this short-period QPO is uncertain, possibly being related to either the spin of the white dwarf or an oscillation in the nuclear burning envelope around the white dwarf. The super-soft phase was still well underway (at 40 counts/sec) at the time of the last Swift visit on day +143 before the satellite observations were interrupted because of Sun-angle contraints. When they resumed on day +200, the soft count rate had dropped to 0.8 count/sec and further reduced to 0.4 counts/sec by day +205, meaning the end of the super-soft phase and therefore of the sutained nuclear burning at the surface of the white dwarf.
One of the most surprising discoveries of recent years about novae has been their detection in -rays following the launch of the sensitive Fermi satellite. After the initial serendipitous detections at energies 100 MeV of novae V407 Cyg in 2010 and V959 Mon in 2102, three more bright novae have been pointed at and detected by Fermi in the -rays: Nova Sco 2012, Nova Cen 2013, and Nova Del 2013, making the latter a full member of a still very exclusive club (Abdo et al. 2010, Cheung et al. 2010, 2012, 2013, Cheung, Glanzman and Hill 2012, Hays et al 2013, Laird et al. 2013). The origin of the -rays recorded from these novae is still debated, but a consensus is growing around the idea that the strong shocks needed to accelerate particles at relativistic energies develop within a mixed and delayed torus-bipolar expansion pattern for the ejecta (Ackermann et al. 2014, Chomiuk et al. 2014, Metzger et al. 2015). A search for TeV emission from Nova Del 2013 has provided negative results (Sitarek et al. 2015).
Radio observation of Nova Del 2013 have been carried out on a number of dates (Anderson et al. 2013, Chomiuk et al. 2013a,b, Roy et al. 2013). Initial non detections were used to infer a distance to the nova in excess of 2 kpc. The first positive detection occurred on day +22.6 at 0.31, 0.82 and 1.06 cm while the nova remained undetected at 4.05 cm and longer wavelengths, consistent with an optically thick thermal emission. The nova was then detected at 2.0 cm on day +40.
A great deal of IR data have been collected on Nova Del 2013 (Banerjee et al. 2013a,b, Burlak et al. 2013, Cass et al. 2013a,b,c,d,e, Gehrz et al. 2013, Rudy et al. 2013, Shenavrin et al. 2013, Schaefer et al. 2014, Taranova et al. 2014). Starting around day +30 a limited amount of dust formed in the ejecta of Nova Del 2013. The dust remained optically thin, absorbing and re-emitting about 10% of the total luminosity radiated by the nova, and cooling from 1500 K on day +36, to 1100 K on day +56, to 700 K on day +100. Near-IR spectra were dominated by strong emission lines, in particoular C I lines which are hallmarks of the FeII-class of novae (Banerjee and Ashok 2012), and followed the expected behaviour for a normal nova of this type. Hints of a triple peaked structure were seen in the HI line profiles, suggesting a bipolarity in the flow.
![[Uncaptioned image]](/html/1504.05483/assets/x1.png)
![[Uncaptioned image]](/html/1504.05483/assets/x3.png)

3 Characterization of filters
The Stromgren , filters were purchased from Astrodon and the [OIII] and H filters from Baader at the beginning of 2012. At that time we measured their transmission and repeated the operation with the same instrumentation two and half years later in September 2014, to evaluate the impact of aging and continued use at the telescope.
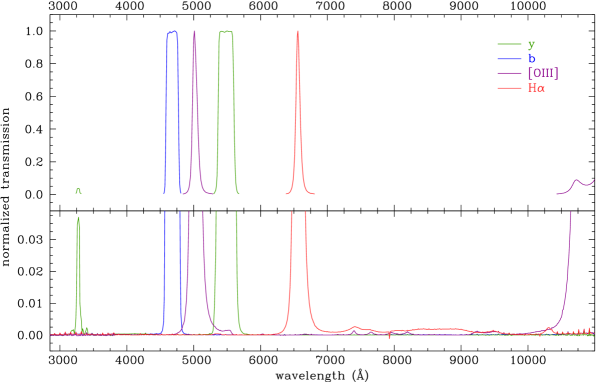
To measure the transmission profiles, we used a Perkin Elmer UV-Vis spectrometer Lambda Bio 40 operated by the ARPA laboratory of Forli (Italy). Each filter was measured at the room temperature over the whole range from 2000 Å to 1.10 m, with readings every 10 Å. The light beam had a diameter of 7 mm and was aimed perpendicularly at the geometrical center of the filter. The filter transmissions are given in Table 1 (the full table is available electronic only), normalized to 1.0 at maximum. They are plotted in Figure 1. We found the difference between the profiles for 2012 and 2014 being negligible, comparable to the small errors of measurements, indicating a good stability and no (quick) aging of the filters even if in continuous use at the telescope. Table 2 present a handy summary of the basic parameters of the four filters.
3.1 Stromgren b,y filters
The Astrodon and filters show excellent suppression of residual trasmittance away from the main profile, with the exception for the filter of a UV-leak centered at 3275 Å with FWHM=40 Å and 4% peak transmission. Given the low atmospheric transmittance, low CCD sensitivity, and absence of prominent emission lines at these wavelengths, such a leak has no practical consequences on photometry of novae. The Astrodon and filters have effective wavelengths and widths at half maximum (cf. Table 2) closely similar to the original Stromgren (1956) interference filters. The shape of the transmittance profile is however quite different: truly flat-topped for Astrodon filters with no significant wings, Gaussian-like with extended wings for the original Stromgren interference filters. Such long wings mean that during the advanced nebular phases, the amount of [OIII] emission leaking into the band profile could easily change the measurement by tenths of a magnitude. The boxy profile of Astrodon filters greatly helps in having clean definition of what is transmitted and what is rejected by the filter. In addition, a nice advantage of Astrodon filters is that their dielectric multi-layer type allows peak transmission efficiencies close to perfect 100%, while classical interference filters usually transmit much less than that, requiring proportionally longer exposure times.

3.2 Narrow [OIII],H filters
The Baader [OIII] and H filters have high peak-transmission and Gaussian-like transmission profiles with extended wings. The [OIII] filter shows a width at half maximum of 70 Å and it is centered 13 Å to the red of the rest wavelength of [OIII] 5007. While this enables the main line of the doublet to be centered close to the filter peak transmission, the other line of the multiplet at 4959 Å (whose intensity is about 1/3 of the 5007 Å one) lies outside the the main transmission profile and on the wing where the transmission is only 16% of its peak value, causing a rejection of about 21% of the total [OIII] doublet flux. The H filter is well centered on the rest wavelength of the emission line and nicely transmits the whole of it.
Both Baader [OIII] and H filters display some leaks away from the main transmission profile, as shown in Figure 1. The [OIII] filter has a near-IR leak at 10,500 Å, which has no consequence on Nova Del 2013 photometry given its blue energy distribution. On heavily reddened novae or novae harboring red giants or novae with particularly strong emission in HeI 10 830 Å line, the flux recorded through this leak could however become relevant with respect to that going through the main transmission profile, even considering the minimal sensitivity of optical CCDs at such red wavelengths (1%). This have been clearly shown in Munari & Moretti (2012, their Figures 1 and 8) for the 2010 outburst of nova V407 Cyg, that harbors a very cool Mira. While the nova was declining, the flux of the Mira become dominant at the longest wavelengths, and when the energy distribution became redder than 4 mag, the flux going through the similar near-IR leak of old Astrodon filters become dominant compared to that going through the filter main profile, resulting in an artificially brighter nova in the -band. That near-IR leak has been corrected, and new Astrodon filters now offer clean band measurements.
The H filter has no near-IR leak, but it does not accurately suppress the transmission away from the main profile, as Figure 1 shows. Over the 7000-9000 Å range its average transmission is 0.17 %. Again, this has no practical consequence on Nova Del 2013 photometry given its blue energy distribution, the lack of significantly strong emission lines in that wavelength region and the huge intensity of H emission line. To check this, we have integrated the flux through the H filter profile on our very extensive set of accurately fluxed spectra of Nova Del 2013 that cover its entire evolution, and repeated the computation after forcing to 0.00 the filter transmission everywhere outside the main profile. The maximum difference between the two sets of measurements amounts to 0.022 mag, for the day of maximum brightness (and lowest equivalent width of H emission line). By the third day past maximum, the difference has dropped below 0.010 mag, and disappeared below 0.001 mag twenty days past maximum. On heavily reddened novae or novae harbouring red giants or novae with very strong CaII triplet and OI 7772, 8446 Å emission lines, the story would probably be different and requires checking on a case by case basis.
3.3 Depedence on the angle of illumination
Inserting interference filters in the converging light beam of a telescopes requires careful evaluation of the effects on the transmission profile.
The wavelength interval transmitted by interference filters shifts toward the blue when the illuminating beam is tilted away from normal incidence (90∘). We have measured the trasmission profile of all four program filters for increasing deviations from normal incidence (0∘, 1∘, 5∘, 10∘ and 15∘ deg deviations). These profiles are plotted in Figure 2 and the corresponding shift in the effective wavelength is plotted in Figure 3, where the interpolating lines are drawn from the following parabolic fits:
| (1) | |||||
| (2) | |||||
| (3) | |||||
| (4) |
where is in Å and is the deviation (in degrees) from normal incidence. Also the width of the profile and peak transmission change with the deviation, but these are minor effects compare to the shift in wavelength.
The dependence on the angle of incidence has some relevant consequences.
A controlled tilt of the filter placed in a parallel beam can be used to recenter the passband. To center the peak of [OIII] filter transmission on the rest wavelength of [OIII] 5007 line, a tilt of 6∘.5 should be introduced. To center on the [OIII] 5007 line at the barycentric velocities of M33 (Triangulum) and M31 (Andromeda) galaxies, tilts of 7∘.4 and 8∘.0 should be applied, respectively. A similar re-centering for the H filter would require tilts of 1∘.8 and 2∘.7 for M33 and M31, respectively.
Our observations of Nova Del 2013 were carried out at a f/5.3 Newtonian focus, by placing the filters in the converging beam. This has an angular aperture of 12∘.0 (11∘.67 from the f/number and 0.33 from the field of view on the sky), fully covered by the oversized filters that do not introduce spatial vignetting. The mean of the angular deviation from normal for the light incident on the filters, weighted according to the area of the entrance pupil (thus taking into account the obstruction by the secondary mirror), is
| (5) |
This, and not 0∘, is the effective deviation for a target placed at the center of the imaging field. The filter parameters for the Newtonian f/5.3 focal ratio are listed in Table 2.
4 Observations
The photometric observations of Nova Del 2013 were carried out with ANS Collaboration telescope N. 125 located in Bastia (Ravenna, Italy). It is a 0.42-m f/5.3 Newton telescope feeding light to a Moravian G2-1600 CCD camera, equipped with Kodak KAF-1603ME chip, 15361024 array, 9 m pixels 0.82′′/pix plate scale. Technical details and operational procedures of the ANS Collaboration network of telescopes running since 2005, are presented by Munari et al. (2012a). Detailed analysis of the photometric performances and measurement of actual transmission profiles for the photometric filter sets in use with ANS telescopes is presented by Munari & Moretti (2012). All measurements on Nova Del 2013 were performed with aperture photometry, the long focal length of the telescope and the sparse surrounding field not requiring the use of PSF fitting.
At nova maximum brightness, the exposure times were 2510 sec in [OIII], 252 sec in H, 303 sec in , and 302 sec in . They grew with fading of the nova, reaching for the latest observations 12120 sec in [OIII], 1290 sec in H, 12240 sec in , and 12180 sec in . A few-pix wide random dithering was introduced between individual exposures (each filling about half of the full well capacity), with the observed field centered in a similar manner on the chip throughout the whole observing campaign. This ensured that any issue related to possible outer-field vignetting or differential illumination by the shutter (of the rotating blade type) even at the shortest exposures, were accurately cancelled out throughout the observing campaign. All photometric measurements were carefully tied to a local photometric sequence extracted from the APASS survey (Henden et al. 2012, Henden and Munari 2014, Munari et al. 2014), covering the whole sky down to =17 in five bands, Landolt , and Sloan ,,. Stromgren , magnitudes of 18 field stars around Nova Del 2013 were derived via the transformation equations from APASS data published by Munari (2012). The corresponding H and [OIII] magnitudes for these 18 field stars were derived by a two step procedure. The magnitudes were first calculated by m(H)= and m([OIII])=(+)/2, and further checked that these instrumental magnitudes for H and [OIII] images were on a normal Pogson scale. Secondly, to fix the zero point, we used the dense spectrophotometric monitoring of Nova Del 2013 that we obtained with the Asiago 1.22m telescope + B&C spectrograph, which will be studied elsewhere. On the absolutely fluxed spectra obtained at nova maximum brightness, and using the filter transmission profiles for f/5.3 we computed the [OIII] and H magnitudes, and repeated the computation after removing from the spectra the weak emission and absorption lines present within the filter transmission range. The difference between the two readings fixed the zero point of the transformation scale on the Vega scale.
The same 18 comparison stars were used throughout the whole observing campaign (and in the process continuously checked for absence of intrinsic variability). When the nova was at maximum brightness, they were fainter than the nova and thus required co-adding (after astrometric registration) many individual frames (individually calibrated for bias, dark and flat frames) to obtain a high S/N on the comparison stars, and the reverse toward the end of the campaign when the nova turned fainter than the comparison stars. Even if it was of minimal impact given the narrowness of the filter band pass, all observations were corrected for instantaneous color equations.
The resulting , , [OIII] and H photometry of Nova Del 2013 is given in Tables 2 and 3. The total error budget is quoted for each measurement, which quadratically includes the Poissonian contributions of the variable and the comparison stars and the uncertainty in the transformation to the standard system as defined by the 18 local photometric standards. The color is derived directly during the reduction and not computed as the difference between the corresponding magnitudes.
![[Uncaptioned image]](/html/1504.05483/assets/x11.png)
![[Uncaptioned image]](/html/1504.05483/assets/x12.png)
5 Results
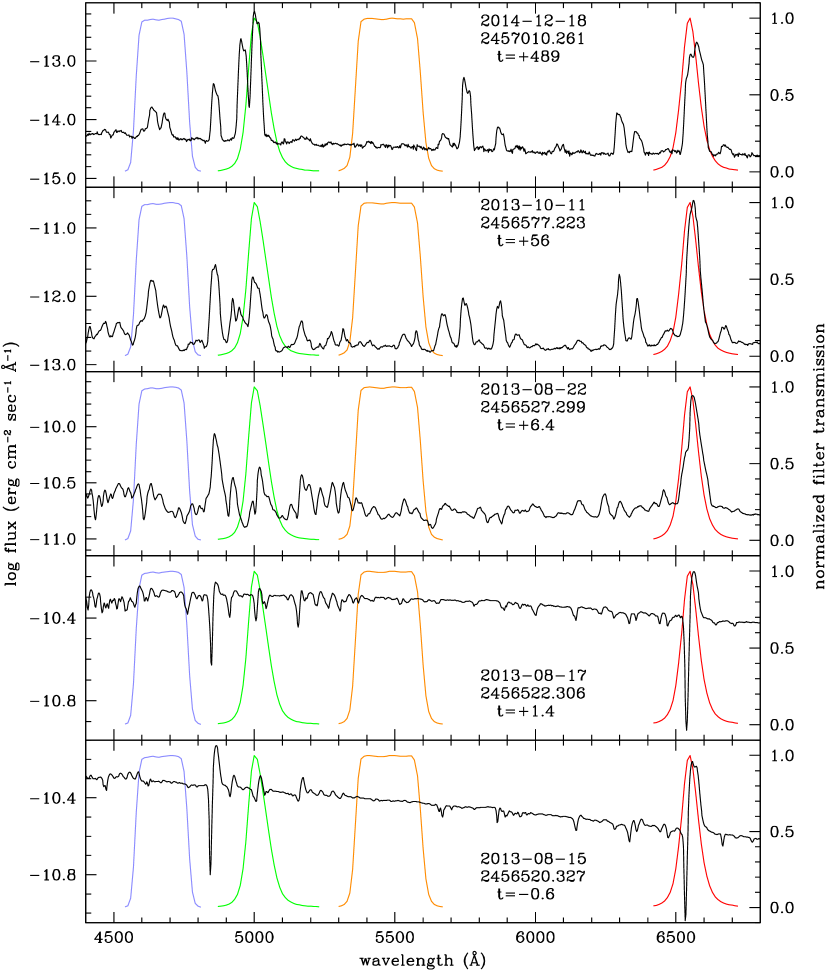
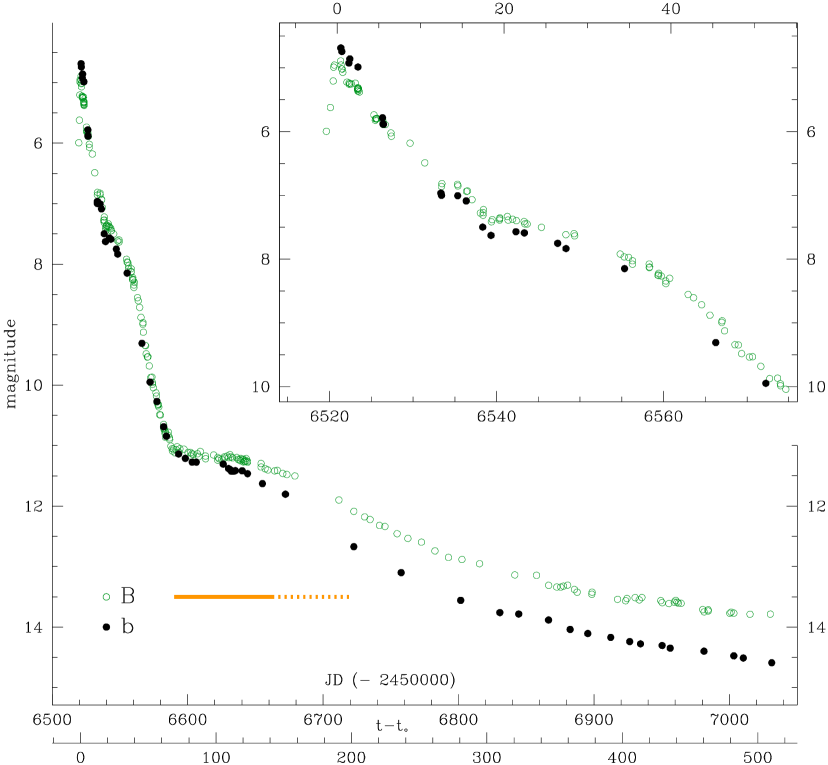
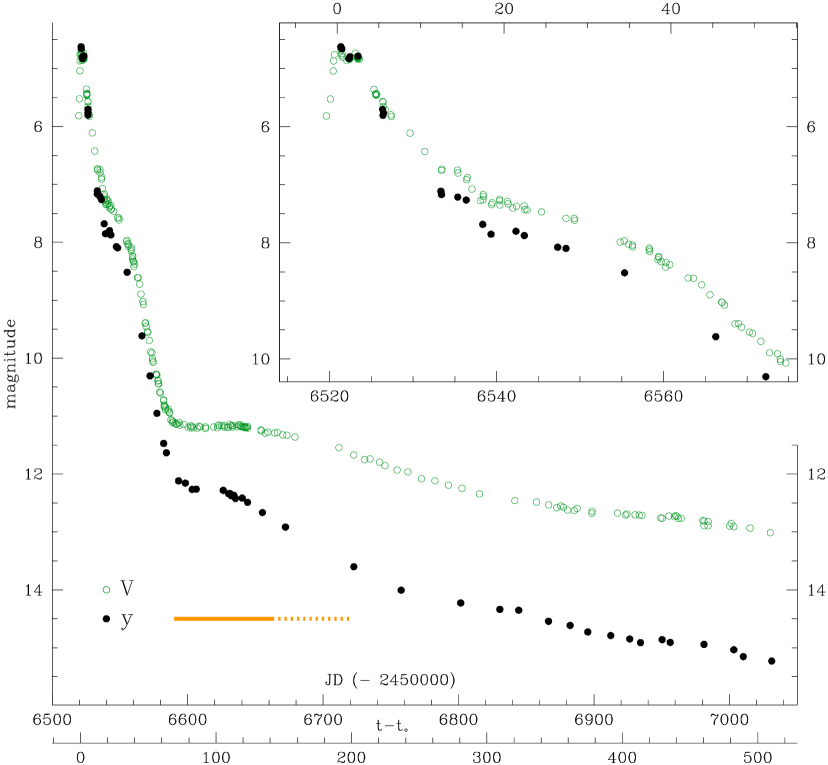
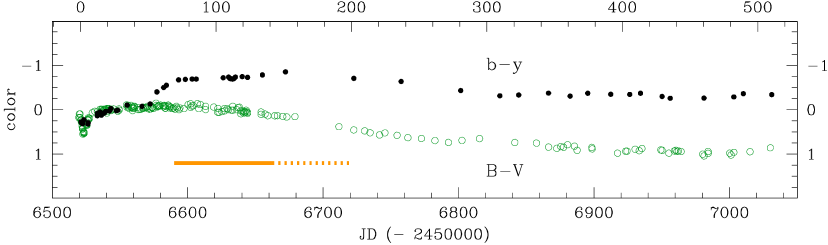
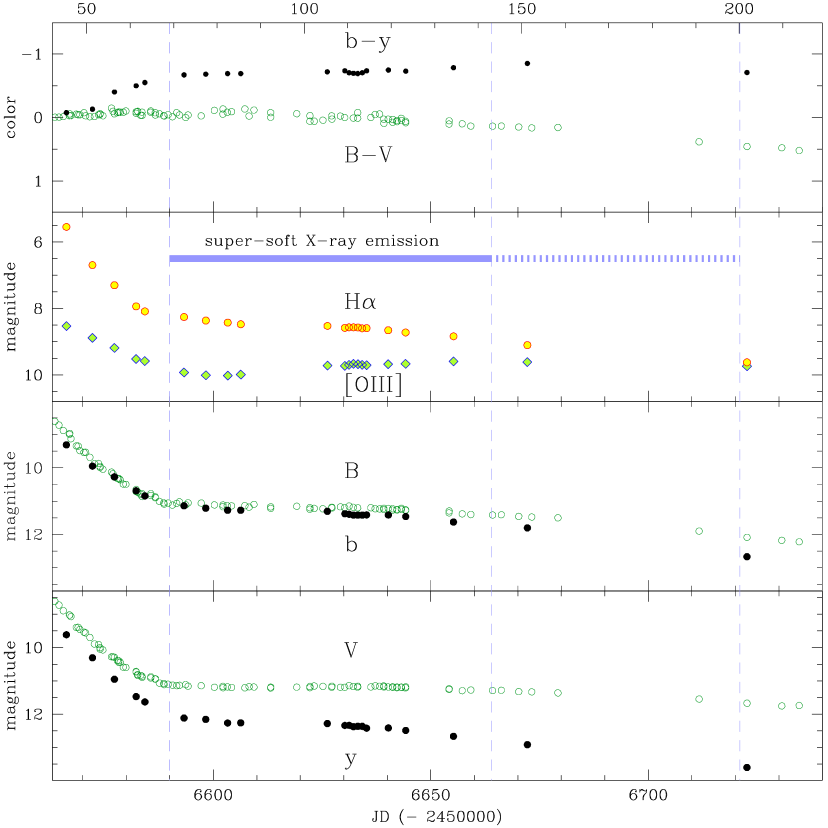
The transmission of the , , [OIII] and H filters is overplotted in Figure 4 to the spectral evolution of Nova Del 2013 at some key epochs. The photometric evolution in and bands is compared to that in and bands in Figures 5 and 6, and the lightcurves in [OIII] and H filters are plotted in Figure 8. The color evolution is compared to in Figure 7, and Figure 9 focuses on the portion of the lightcurves that cover the period during which super-soft X-ray emission was recorded from Nova Del 2013.
5.1 Stromgren bands
As illustrated by Figure 4, the Stromgren filter remains remarkably clear of significant emission lines through the whole photometric evolution, especially around maximum brightness and advanced decline, confirming that band is an excellent tracer of the continuum emission of novae. At the time of peak intensity of FeII, a few weak lines from multiplets 48 (5362.9 Å) and 49 (5425.3 and 5477.2 Å) emit within the filter passband, and during early nebular phases weak emission by NII multiplet 63 and the auroral [NII] 5577 Å lines contribute a little to the recorded flux. Around maximum, and lightcurves essentially coincide (including the 2 day plateau described by Munari et al. 2013d), but as soon as emission lines emerge with a significant flux a few days past maximum, the two lightcurves start to diverge with the band systematically brighter than because of the large flux contributed by H and FeII multiplet 42. As long as H and FeII 42 are the dominant emission lines within the passband, the and lightcurves evolve in parallel with a nearly constant difference in magnitude. When the ejecta finally turn optically thin (around day +70), and super-soft X-ray emission from the central WD begins to be observed, the divergence of and lightcurves resumes and continues over the rest of the lightcurve.
When the ejecta turn optically thin (around day +70), the rate of photometric decline flattens out considerably at all bands. At this time, the continuum emission observed from the nova is no more dominated by the pseudo-photosphere receding through the ejecta, but by the recombinations in the optically thin ejecta. Initially (days +70 to +100), the recombinations are nearly balanced by the re-ionization induced by the hard radiation emanating from the white dwarf (in the super-soft X-rays phase) that now permeates the ejecta, and the brightness in the band remains essentially constant. Later on (day +110 and onward), the continuing dilution of the ejecta into the surrounding space brings recombinations eventually out of balance with re-ionization, and the band resumes declining. Such decline resumption occurs at later times in the band (around day +155), because its bandpass intercepts a large fraction of the increasing emission in the [OIII] 4959, 5007 Å doublet. The brightness of the nova in the [OIII] filter keeps increasing throughout the super-soft phase, as the result of the ionization from the central star and the continuous expansion that brings an increasingly large fraction of the ejecta below the critical density for collisional de-excitation of [OIII].
The Stromgren band is far more affected by emission lines than the band (cf Figure 4), and it evolves much closer to band (cf Figure 5) than compared to . In particular, no plateau soon after optical maximum is observed in , and it is similarly missing in . Around maximum brightness, Nova Del 2013 is brighter in than because of the greater density of deep aborption lines in compared to , especially in the bluer part of the passband. As the Balmer and FeII emission lines begin to reinforce and the absorption weakens, and are first equal and then turns slightly fainter than because no Balmer and only a few weak lines from FeII multiplets 37, 38, 43 and 54 emit within the passband. As for the band with respect to , the small offset between and remains stable (days +12 to +45 in Figure 5) as long as the spectra are dominated by Balmer and FeII emission lines. Before novae enter the nebular phase, they usually experience the NIII flaring phase (McLaughlin 1960), during which the 4640 Å blend of fluorescent excited NIII lines greatly increase in intensity, surpassing that of H. Because the NIII 4640 Å blend sits entirely within the passband, at the peak of the NIII flaring (days +60 to +65) the brightness of Nova Del 2013 in increases and equals the magnitude. Soon after, at the time of the emergence of super-soft X-ray emission and simultaneous flaring of [OIII] and decline of NIII 4640 Å blend, the brightness in and bands starts to depart and continue to diverge for the rest of the decline toward quiescence. This divergence is however much smaller than observed between and bands (compare Figure 5 and 6), with the brightness in the band sustained by HeII 4686 Å emission line in addition to that of NIII 4640 Å blend during the advanced decline.
5.2 [OIII] and H bands
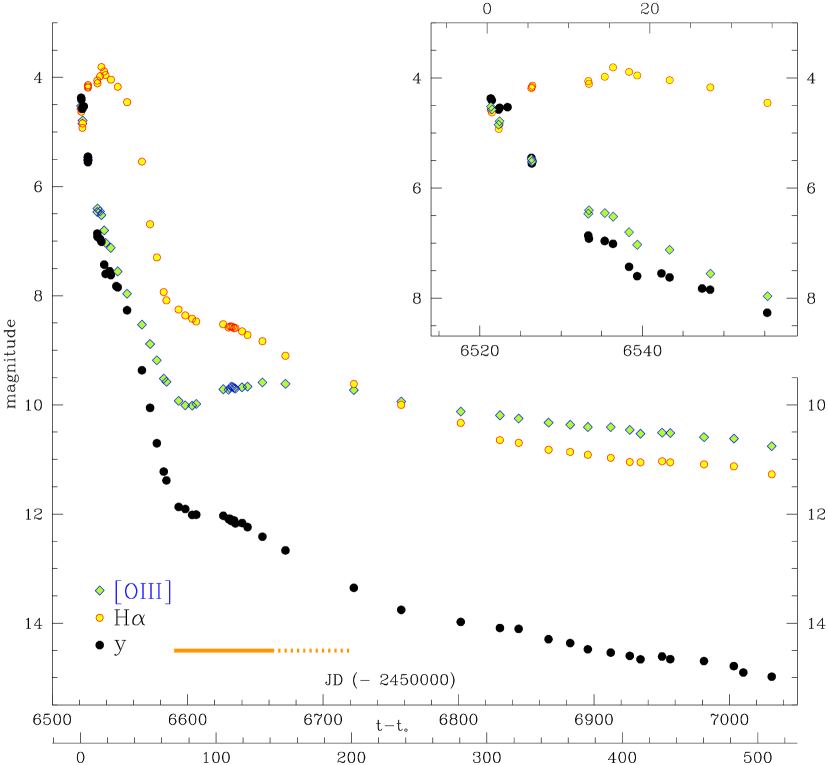
The photometric evolution of Nova Del 2013 in the [OIII] and H narrow-bands, as depicted in Figure 8, is particularly interesting.
In broad band photometry, soon after maximum brightness, Nova Del 2013 went through a brief plateau which lasted for 2 days in , 3 in and 4 in (Munari et al. 2013d). Such a plateau has no counterpart in [OIII] and H bands, where the decline started immediately after maximum was reached (see the first two observing dates on the upper right panel of Figure 8).
Around nova maximum brightness, the flux recorded through the [OIII] band is essentially that of the continuum, because the strong FeII multiplet 42 line at 5018 Å presents a marked P-Cyg profile (cf. Figure 4), where FeII absorption and emission balance each other. As soon as the P-Cyg absorption component vanishes, the nova brightness in the [OIII] filter rises above that of the Stromgren band recording the adjacent continuum, and remains brighter as long as the FeII multiplet 42 stays in emission. With the change to optically thin conditions of the ejecta and the spreading ionization caused by the super-soft X-ray input, the [OIII] 5007 Å emission line rapidly grows in intensity. This causes the brightness in the [OIII] band to slow and then to stop the decline (initial 20 days of the super-soft phase), followed by an actual and long lasting brightening (cf. Table 4 and Figure 9). At the end of the super-soft X-ray phase (130 days past it begun), Nova Del 2013 is still brighter by 0.2 mag in the [OIII] band than before it started. If confirmed in other novae, this increase and plateau phase in [OIII] band brightness could be used to trace the period during which super-soft X-ray emission is present. Following the end of the super-soft X-ray phase, the [OIII] band brightness begun to decline, at a very slow rate, slower than in the H band. At the time of the our last observation, on day +510, in the [OIII] band Nova Del 2013 was 4.22 mag brighter than in and 2.27 mag brighter than in .
As for [OIII], the flux recorded around maximum through the H band is essentially that of the continuum, because the strong H line at 6563 Å presents a marked P-Cyg profile (cf. Figure 4), where again absorption and emission balance each other. After maximum brightness, the pseudo-photosphere begins to contract inward through the ejecta and to rise in , so that a growing fraction of gas in front of the pseudo-photosphere is ionized, causing a brightening in H band, reaching maximum on day +16 for Nova Del 2013, and remaining on a plateau for about 35 days past the maximum brightness observed in the band (cf Figure 8). At the time when the plateau ended, Nova Del 2013 was in the H band 3.6 mag brighter than in , 3.8 mag brighter than in , and 3.5 mag brighter than in the [OIII] band. After the plateau phase, the brightness in the H band began to decline very rapidly (0.13 mag day-1), at a speed similar to that of the continuum (as traced by the Stromgren band) was declining (0.12 mag day-1) during the H plateau (cf. Figure 8). The post-plateau drop in H brightness coincides precisely with the first appearance of the [OIII] 5007 emission line and the NIII 4640 Å flaring. The rapid drop in the H band was halted by the start of the super-soft X-ray phase, during which the decline in H band proceeded at a much slower rate (0.010 mag day-1). At the end of the super-soft X-ray phase, the [NII] 6548, 6584 Å doublet was already contributing significantly to the brightness of Nova Del 2013 in the H band, and this contribution increased with time, so that by June/July 2014 nearly all the flux recorded in the H band was coming from the [NII] doublet. Once this happened, the brightness decline of Nova Del 2013 in the H band became slower than that of the [OIII] band, and the decline in brightness proceeded in parallel at the same 0.0027 mag day-1 for both the [OIII] and H bands.
The extreme smoothness of both the H and [OIII] lightcurves argues for absence of large and abrupt discontinuities in the ejecta of Nova Del 2013. Should they exist, glitches in the lightcurves would have appeared when the ionization and/or recombination fronts overtook them.
5.3 Optical photometry during the phase of large variability in the super-soft X-ray emission
During the early portion of the super-soft X-ray emission phase of novae, the super-soft flux is frequently seen to vary by huge amounts over short time-scales (Ness et al. 2007, Osborne et al. 2011, Osborne et al. 2013a, Schwarz et al. 2011). Beardmore et al. (2013) reported for Nova Del 2013 variations up to 5 magnitudes (i.e. 100 times) from one day to the next in the super-soft X-ray flux recorded during the two-weeks rise toward maximum X-ray brightness, which covers the period of time from day +69 to day +86 (cf. Figure 9). This effectively corresponds to turning on/off the recorded X-ray emission. The origin of these large amplitude variations (LAVs) in the super-soft X-ray flux is not certain, but it has been associated to clumpy ejecta passing through the line of sight or white dwarf photospheric temperature variations.
Our photometry in Figure 9 obtained during the LAVs period of Nova Del 2013 is particularly accurate and helps to constrain the origin of LAVs. The total error budget of our photometric measurements is much smaller than dot dimensions in Figure 9, as also confirmed by the residuals from low-order polynomial fits to the lightcurves which are of the order of 0.010 mag. A most relevant feature of the photometry in Figure 9 is that there is not even the lightest trace of short term optical variability superimposed to the underlying smooth trend during the LAVs period. This is equally true for narrow-band [OIII] and H, for Stromgren and and for Johnson-Cousins and bands. So no matter if the measurement refers only to continuum radiation, where all the ejecta contribute to the recorded flux (Stromgren ), or just to a single emission line, where radiation is received only from a single layer of the ejecta ([OIII] and H), the X-ray LAVs do not extend into the optical.
The presence of LAVs during the time interval from day +69 to day +86 is simultaneous with the initial growth in intensity of the [OIII] 4959, 5007 Å lines in the optical spectra. Standard photo-ionization modeling with CLOUDY shows that in such conditions the [OIII] emission originates from a confined region of the ejecta, extending radially for 10%20% of the total thickness of the ejecta (e.g. Munari et al. 2008). The critical electron density for the collisional de-excitation of these lines is 6.8105 cm-3 (Osterbrock and Ferland 2006), which is therefore the electron density of the ejecta or at least of the region producing the [OIII] lines when they turn visible. Such an electron density corresponds to a recombination time scale of one week (Ferland 2003). The fact that LAVs seen in Nova Del 2013 did not impact the brightness of the ejecta by an amount larger than the negligible measurement errors (of the order of 1%), indicates that LAVs are not related to global changes affecting the white dwarf as a whole, like the proposed variability of the surface temperature. Should this be the reason for observed LAVs, it would imply a parallel large variability of the input of ionizing radiation to the ejecta, whose balance with the recombinations ultimately drives the observed optical brightness of the ejecta. The LAVs time scale observed in Nova Del 2013 is of the order of one day, while the recombination time scale is a week. The two are sufficiently similar that one would expect to observe at optical wavelengths a counterpart of LAVs, which is not seen. The only feasible possibility is that LAVs affect only the x-ray emission directed toward the Sun, as with clumpy ejecta passing through the line of sight to us, leaving unchanged the hard radiation input to the ejecta integrated over the 4 sky as seen from the white dwarf.
6 Acknowledgements
We would like to thank Arne A. Henden and Elena Mason for careful reading of the manuscript and detailed comments.
References
- Abdo et al. (2010) Abdo A. A., et al., 2010, Sci, 329, 817
- Ackermann et al. (2014) Ackermann M., et al., 2014, Sci, 345, 554
- Anderson et al. (2013) Anderson G., Fender R., Chomiuk L., Staley T., 2013, ATel, 5428, 1
- Banerjee & Ashok (2012) Banerjee D. P. K., Ashok N. M., 2012, BASI, 40, 243
- Banerjee et al. (2013a) Banerjee D. P. K., Ashok N. M., Joshi V., Evans N., 2013a, ATel, 5337, 1
- Banerjee et al. (2013b) Banerjee D. P. K., Ashok N. M., Joshi V., Evans N., 2013b, ATel, 5404, 1
- Banerjee et al. (2014) Banerjee D. P. K., Joshi V., Venkataraman V., Ashok N. M., Marion G. H., Hsiao E. Y., Raj A., 2014, ApJ, 785, LL11
- Beardmore, Osborne, & Page (2013) Beardmore A. P., Osborne J. P., PageK. L., 2013, ATel, 5573, 1
- Burlak et al. (2013) Burlak A. M., Shenavrin I. V., Tatarnikov M. A., Tatarnikova A. A., 2013, ATel, 5294, 1
- Cariková & Skopal (2014) Cariková Z., Skopal A., 2014,A&A, 570, AA4
- Cass et al. (2013a) Cass C. A., Carlon L. R., Corgan T. D., Dykhoff A. D., Gehrz D. R., Shenoy P. D., 2013a, ATel, 5317, 1
- Cass et al. (2013b) Cass C. A., Carlon L. R., Corgan T. D., Dykhoff A. D., Gehrz D. R., Shenoy P. D., 2013b, ATel, 5340, 1
- Cass et al. (2013c) Cass A. C., Carlon R. L., Corgan D. T., Dykhoff D. A., Gehrz R. D., Shenoy D. P., 2013c, ATel, 5419, 1
- Cass et al. (2013d) Cass A. C., Carlon R. L., Corgan D. T., Dykhoff D. A., Gehrz R. D., Shenoy D. P., 2013d, ATel, 5434, 1
- Cass et al. (2013e) Cass A. C., Carlon R. L., Corgan D. T., Dykhoff D. A., Gehrz R. D., Shenoy D. P., 2013e, ATel, 5604, 1
- Cheung et al. (2010) Cheung C. C., Donato D., Wallace E., Corbet R., Dubus G., Sokolovsky K., Takahashi H., 2010, ATel, 2487, 1
- Cheung, Glanzman, & Hill (2012) Cheung C. C., Glanzman T., Hill A. B., 2012, ATel, 4284, 1
- Cheung et al. (2012) Cheung C. C., Shore S. N., De Gennaro Aquino I., Charbonnel S., Edlin J., Hays E., Corbet R. H. D., Wood D. L., 2012, ATel, 4310, 1
- Cheung et al. (2013) Cheung C. C., Jean P., Shore S. N., Fermi Large Area Telescope Collaboration, 2013, ATel, 5649, 1
- Chochol et al. (2014) Chochol D., Shugarov S., Pribulla T., Volkov I., 2014, CoSka, 43, 330
- Chomiuk et al. (2013a) Chomiuk L., et al., 2013a, ATel, 5298, 1
- Chomiuk et al. (2013b) Chomiuk L., et al., 2013b, ATel, 5382, 1
- Chomiuk et al. (2014) Chomiuk L., et al., 2014, Natur, 514, 339
- Darnley et al. (2013) Darnley M. J., Bode M. F., Smith R. J., Evans A., 2013, ATel, 5279, 1
- Darnley & Bode (2013) Darnley M. J., Bode M. F., 2013, ATel,5300, 1
- Deacon et al. (2014) Deacon N. R., et al., 2014, A&A, 563,AA129
- Denisenko et al. (2013) Denisenko D., et al., 2013, IAUC, 9258, 2
- Ferland (2003) Ferland G. J., 2003, ARA&A, 41, 517
- Fiorucci & Munari (2003) Fiorucci M., Munari U., 2003, A&A, 401, 781
- Fukugita et al. (1996) Fukugita M., Ichikawa T., Gunn J. E., Doi M., Shimasaku K., Schneider D. P., 1996, AJ, 111, 1748
- Gallagher et al. (1980) Gallagher J. S., Kaler J. B., Olson E. C., Hartkopf W. I., Hunter D. A., 1980, PASP, 92, 46
- Gehrz, Dykhoff, & Shenoy (2013) Gehrz R. D., Dykhoff D. A., ShenoyD. P., 2013, ATel, 5299, 1
- Hays, Cheung, & Ciprini (2013) Hays E., Cheung T., Ciprini S., 2013, ATel, 5302, 1
- Henden et al. (2012) Henden A. A., Levine S. E., Terrell D., Smith T. C., Welch D., 2012, JAVSO, 40, 430
- Kaler (1986) Kaler J. B., 1986, PASP, 98, 243
- Kuulkers et al. (2013) Kuulkers E., Page K. L., Osborne J. P., Kuin N. P. M., Sokolovsky K. V., Ness J.-U., 2013, ATel, 5283, 1
- Laird et al. (2013) Laird A. M., et al., 2013, PhRvL, 110, 032502
- Landolt (1973) Landolt A. U., 1973, AJ, 78, 959
- Landolt (1983) Landolt A. U., 1983, AJ, 88, 439
- Landolt (1992) Landolt A. U., 1992, AJ, 104, 340
- Landolt (2009) Landolt A. U., 2009, AJ, 137, 4186
- Landolt (2013) Landolt A. U., 2013, AJ, 146, 131
- Lockwood & Millis (1976) Lockwood G. W., Millis R. L., 1976, PASP, 88, 235
- Mannery (1970) Mannery E. J., 1970, PASP, 82, 626
- McLaughlin (1960) McLaughlin D. B., 1960, stat.conf, 585
- Mermilliod, Mermilliod, & Hauck (1997) Mermilliod J.-C., Mermilliod M., Hauck B., 1997, A&AS, 124, 349
- Metzger et al. (2015) Metzger B. D., Finzell T., Vurm I., Hascoet R., Beloborodov A. M., Chomiuk L., 2015, arXiv, arXiv:1501.05308
- Mooers & Wiethoff (2014) Mooers H. D., Wiethoff W. S., 2014,JAVSO, 42, 161
- Moro & Munari (2000) Moro D., Munari U., 2000, A&AS, 147, 361
- Munari et al. (2008) Munari U., et al., 2008, A&A, 492, 145
- Munari et al. (2013a) Munari U., Valisa P., Milani A., Cetrulo G., 2013a, ATel, 5297, 1
- Munari et al. (2013b) Munari U., Dallaporta S., Cherini G., Valisa P., Cetrulo G., Milani A., Ghirotto L., 2013b, ATel, 5304, 1
- Munari et al. (2013c) Munari U., Dallaporta S., Cherini G., Righetti G. L., Valisa P., Milani A., 2013c, ATel, 5533, 1
- Munari et al. (2013d) Munari U., Henden A., Dallaporta S., Cherini G., 2013d, IBVS, 6080, 1
- Munari et al. (2013e) Munari U., Dallaporta S., Castellani F., Valisa P., Frigo A., Chomiuk L., Ribeiro V. A. R. M., 2013e, MNRAS, 435, 771
- Munari et al. (2014) Munari U., et al., 2014, AJ, 148, 81
- Munari & Henden (2013) Munari U., Henden A., 2013, IBVS,6087, 1
- Nakano et al. (2013) Nakano S., et al., 2013, CBET, 3628, 1
- Nakano & Samus (2013) Nakano S., Samus N. N., 2013, IAUC,9258, 1
- Nelson et al. (2013a) Nelson T., et al., 2013a, ATel, 5305, 1
- Nelson et al. (2013b) Nelson T., Mukai K., Chomiuk L., Sokoloski J., 2013b, ATel, 5593, 1
- Ness et al. (2007) Ness J.-U., et al., 2007, ApJ, 665, 1334
- Ness et al. (2013) Ness J. U., et al., 2013, ATel, 5626, 1
- Osborne et al. (2011) Osborne J. P., et al., 2011, ApJ, 727, 124
- Osborne, Beardmore, & Page (2013a) Osborne J. P., Beardmore A., Page K., 2013a, ATel, 4727, 1
- Osborne et al. (2013b) Osborne J. P., et al., 2013b, ATel, 5505, 1
- Osterbrock & Ferland (2006) Osterbrock D. E., Ferland G. J., 2006, Astrophysics of gaseous nebulae and active galactic nuclei, 2nd. ed., University Science Books
- Page & Beardmore (2013) Page K. L., Beardmore A. P., 2013,ATel, 5429, 1
- Page et al. (2013) Page K. L., Osborne J. P., Kuin N. P. M., Woodward C. E., Schwarz G. J., Starrfield S., Shore S. N., Walter F. M., 2013, ATel, 5470, 1
- Page et al. (2014) Page K. L., Kuin N. P., Osborne J. P., Schwarz G. J., Shore S. N., Starrfield S., Woodward C. E., 2014, ATel, 5967, 1
- Roy et al. (2013) Roy N., Kantharia N. G., Dutta P., Anupama G. C., Ashok N. M., Banerjee D. P. K., 2013, ATel, 5376, 1
- Rudy et al. (2013) Rudy R. J., et al., 2013, CBET, 3650, 1
- Santangelo et al. (2013) Santangelo M. M. M., Pasquini M., Gambogi S., Cavalletti G., 2013, ATel, 5313, 1
- Schaefer et al. (2014) Schaefer G. H., et al., 2014, Natur, 515, 234
- Schwarz et al. (2011) Schwarz G. J., et al., 2011, ApJS, 197, 31
- Shenavrin, Taranova, & Tatarnikov (2013) Shenavrin V. I., Taranova O. G.,Tatarnikov A. M., 2013, ATel, 5431, 1
- Shore et al. (2013a) Shore S. N., Skoda P., Rutsch P.,2013a, ATel, 5282, 1
- Shore et al. (2013b) Shore S. N., et al., 2013b, ATel, 5312, 1
- Shore et al. (2013c) Shore S. N., et al., 2013c, ATel, 5378, 1
- Shore et al. (2013d) Shore S. N., et al., 2013d, ATel, 5409, 1
- Shore et al. (2013e) Shore S. N., et al., 2013e, ATel, 5546, 1
- Shore et al. (2013f) Shore S. N., et al., 2013f, ATel, 5624, 1
- Shore et al. (2014a) Shore S. N., et al., 2014a, ATel, 6088, 1
- Shore et al. (2014b) Shore S. N., De Gennaro Aquino I., ScaringiS., van Winckel H., 2014b, A&A, 570, LL4
- Sitarek et al. (2015) Sitarek J., et al., 2015, arXiv, arXiv:1502.05853
- Skopal et al. (2014a) Skopal A., et al., 2014a, ATel, 6132, 1
- Skopal et al. (2014b) Skopal A., et al., 2014b, A&A, 569, AA112
- Smith et al. (2002) Smith J. A., et al., 2002, AJ, 123, 2121
- Stromgren (1956) Stromgren B., 1956, VA, 2, 1336
- Tang et al. (2013) Tang S., Ofek E. O., Kasliwal M. M., Bildsten L., Kulkarni S. R., Sesa B., 2013, ATel, 5308, 1
- Taranova et al. (2014) Taranova O. G., Tatarnikov A. M., Shenavrin V. I., Tatarnikova A. A., 2014, AstL, 40, 120
- Tarasova (2013) Tarasova T. N., 2013, ATel, 5291, 1
- Tarasova & Shakhovskoi (2013) Tarasova T. N., Shakhovskoi D. N., 2013, ATel, 5370, 1
- Tomov et al. (2013) Tomov T., Ilkiewicz K., Swierczynski E., Belcheva M., Dimitrov D., 2013, ATel, 5288, 1
- Warner (1995) Warner B., 1995, Cataclysmic Variable Stars, Camb. Astrophys. Ser., Vol. 28
- Woodward et al. (2013) Woodward C. E., Wagner R. M., Hounsell R. A., Starrfield S., 2013, ATel, 5493, 1