Structural and Magnetic Reconstruction of Thermodynamically Stable CaMnO3 (001) Surfaces
Abstract
The relative thermodynamic stability of surface reconstructions including vacancies, adatoms and additional layers on both CaO and MnO2 terminations is calculated to predict the surface phase diagram of ()R45∘ CaMnO3 (001) using ab initio thermodynamics. Stoichiometric and nonstoichiometric reconstructions are considered. A set of boundary conditions driven by the binary and ternary sub-phases from CaMnO3 defines its bulk stability region, enclosing the stable surface reconstructions that can be in equilibrium with the bulk. Most of the surfaces take the magnetic ordering of the bulk ground state, G-type antiferromagnetic (AFM); however, some of the MnO2-terminated surfaces are more stable when the surface layer spins flip. At 573 K, the stoichiometric CaO- and MnO2-terminated surfaces are predicted to be thermodynamically stable, as well as a CaO-terminated surface reconstruction where half the Ca are replaced by Mn. The MnO2-terminated surface reconstructions dominate the phase diagrams at high temperatures, including phases with MnO and MnO2 adatoms per surface unit cell.
I. Introduction
Perovskite CaMnO3 has recently been the subject of increasing interest due to its strain-assisted multiferroicity Bhattacharjee et al. (2009); Wang et al. (2012), thermoelectric efficiency Urata et al. (2007); Koumoto et al. (2010), colossal magnetoresistance Zeng et al. (1999), and catalytic properties Kawashima et al. (2008). Its high catalytic activity for oxidation reactions and structural similarity to important biological catalysts has motivated studies on CaMnO3 as a potential catalyst for water oxidation Najafpour et al. (2012). While atomic insight into the CaMnO3 surface is imperative if its potential application as a catalyst is to be realized, very little has been investigated in this direction. Most of the previous studies have focused on magnetic properties Filippetti and Pickett (1999, 2000); Nguyen et al. (2011) of the stoichiometric cubic CaMnO3 surface.
In this study, we determine the atomic and magnetic low-energy surface structures of orthorhombic Pnma CaMnO3 (001) as functions of environmental variables, developing surface phase diagrams by combining density functional theory (DFT) and thermodynamics Reuter and Scheffler (2001). Various surface reconstructions for both CaO- and MnO2-terminated surfaces are explored within a ()R45∘ surface periodicity. For structures with Mn atoms at the surface, we considered multiple magnetic spin configurations to ensure that the surface stability accounts for the potential magnetic reconstruction at the surface. The surface free energies are computed to generate the surface phase diagram within the bulk stability range. To illustrate the surface stability at a range of temperatures, the vibrational free energy is included in the calculation of the bulk stability region. Through our surface examination, we predict thermodynamically stable surface reconstructions at a range of conditions.
II. Methodology
A. Computational Methods
DFT calculations were performed using the PBEsol Perdew et al. (2008) generalized gradient approximation (GGA), as implemented in the Quantum Espresso Giannozzi et al. (2009) computer code. Perdew and collaborators have shown that the PBEsol functional describes solids and surfaces accurately Perdew et al. (2008). PBEsol+U was also used to test electronic properties, with U = 7.23 eV, in line with previous work Luo et al. (2007) and determined with the linear response scheme Cococcioni and de Gironcoli (2005). However, adding strong correlations to CaMnO3 provides unsatisfactory description of the magnetic properties, as has been established by Luo et al. Luo et al. (2007). Spin-polarized electronic densities were used in all calculations, treating the magnetic moments as collinear in all cases, with additional non-collinear (NC) calculations for some Mn-terminated surfaces and for the ternary sub-phases. All atoms are represented by norm-conserving, optimized Rappe et al. (1990), designed nonlocal Ramer and Rappe (1999) pseudopotentials with spin-orbit interaction (for NC magnetism). The pseudopotentials are generated with the opium package Opi , treating the 3s, 3p, 3d, 4s, and 4p of Ca, the 3s, 3p, 3d, 4s, and 4p of Mn, and the 2s and 2p of O as valence states. An accurate description of the magnetic properties of all the systems studied is achieved when nonlinear core-valence interaction is included in the Mn pseudopotential by the partial core correction scheme Fuchs and Scheffler (1999); Porezag et al. (1999). The CaMnO3 magnetic ground state is collinear G-type antiferromagnetic (AFM) with an observed Néel temperature of about 130 K Poeppelmeier et al. (1982), estimating the magnetic interaction energy to be around 6.6 meV Bhattacharjee et al. (2008). Therefore, all calculations are run with a 70 Ry plane-wave energy cutoff to ensure accuracy for the small relative energies among the different magnetic configurations. The Brillouin zone is sampled using a Monkhorst-Pack Monkhorst and Pack (1976) -point mesh for surface structures based on energy convergence for bulk CaMnO3. For binary and ternary sub-phases, a dense enough set of -points was used so that the total energy is converged. The ionic relaxation parameters are chosen so that the forces in the surface and bulk structures are lower than 2 meV/Å.
We use density functional perturbation theory Baroni et al. (2001); Gonze (1995) to calculate phonon frequencies and vibrational displacement vectors at the point for all binary and ternary sub-phases in order to include the vibrational free energy contribution into the definition of the free energy. Translational symmetry is ensured by enforcing the three translational acoustic sum rules requiring that the acoustic modes have zero frequency. This is accomplished through small corrections to the diagonal elements of the dynamical matrix.
B. CaMnO3 (001) Surface Structures
The (001) surface of CaMnO3 is the lowest energy, since it consists of alternating CaO and MnO2 planes, each of which is neutral in an ionic picture Tasker (1979). We construct surface structures with different compositions and reconstructions for both CaO and MnO2 terminations, with symmetrical slabs of 7-9 layers and a vacuum gap between slabs of 15 Å. All atoms are fully relaxed.
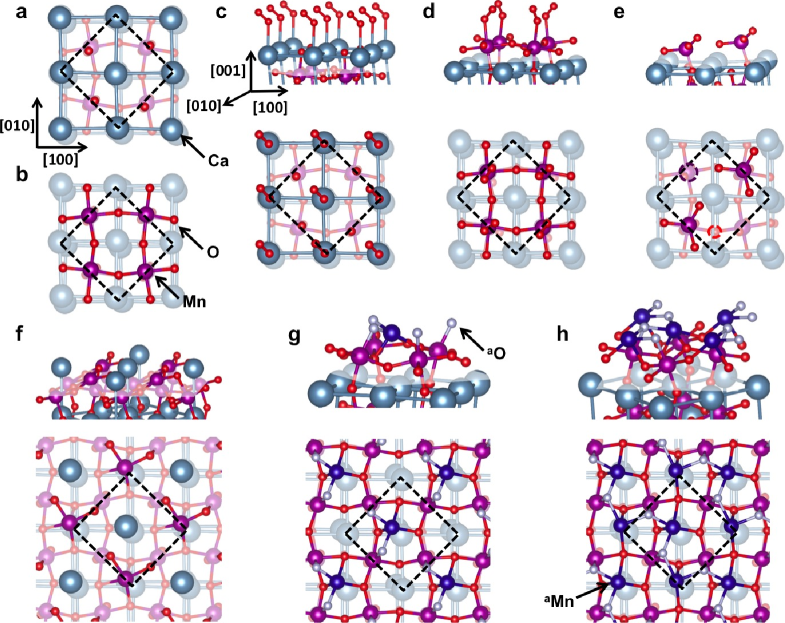
Over 80 surface terminations are made by varying the stoichiometry of Ca, Mn and O including additional CaxOy and MnxOy layers in the ()R45∘ surface symmetry. The positions of adatoms and additional layers are strategically selected; Ca and Mn atoms are placed on top of O atoms, and O species on top of Ca and Mn atoms. Each surface termination is identified based on its stoichiometric termination (either CaO or MnO2) and whether its composition involves vacancies (-) or adatoms (+). As an illustration, CaO+2.0O refers to a CaO-terminated surface with two oxygen adatoms per primitive unit cell of CaO. The number of adatoms and/or vacancies is tabulated per formula unit of either CaO or MnO2, even though there are two formula units in the surface super cell. Similarly, MnO2-0.5Mn-0.5O refers to a MnO2-terminated surface with one Mn vacancy and one oxygen vacancy per two MnO2 units. Illustrations of the thermodynamically stable surface terminations after relaxation are shown in Fig. 1. These surface phases include (a,b) the stoichiometric surfaces, (c,d) their full surface coverage with adsorbed oxygen molecules, (e) the MnO2-terminated surface with one Mn vacancy and one oxygen vacancy, as well as (f) a CaO-terminated surface where a Mn adatom occupies a Ca vacancy. The last two surface phases (g,h) are stable at high temperatures but represent very exotic surface structures, as the aMn adatoms and aO adatoms have different coordination than the stoichiometric atoms, potentially indicating active sites.
| FM | A-AFM | C-AFM | G-AFM | |
|---|---|---|---|---|
| Energy (meV/formula unit) | 38 | 12 | 4 | 0 |
| Magnetic moment (B/Mn) | 2.75 | 2.68 | 2.64 | 2.61 |
The ferromagnetic (FM) and three AFM phases of bulk CaMnO3 were analyzed. The A-AFM state has FM planes of alternating direction along the z-axis. The C-AFM arrangement consists of a Mn with nearest neighbors of opposite spin in the plane, and parallel spins between one plane and the next, while G-type AFM arranges the spins so that all nearest neighbors have opposite spin orientation. The magnetic ground state of bulk CaMnO3 is found to be G-AFM Pnma insulator, as reported in previous theoretical and experimental studies Pickett and Singh (1996); Bhattacharjee et al. (2008); Poeppelmeier et al. (1982). Our computed electronic band gap is 0.65 eV, significantly underestimating the experimental value of 3.1 eV Jung et al. (1997) but in close agreement with previous computational work Tsukahara et al. (2010); Pickett and Singh (1996) The atom-projected magnetic moments of Mn atoms in each magnetic phase are shown in Table 2 as well as the relative energies with respect to the stable G-AFM phase, which are in very good agreement with those of a recent projector augmented wave calculation using the PBE functional Tsukahara et al. (2010). The surface calculations are performed with G-AFM ordering, magnetic spin flip at the surface and other possible magnetic spin configurations for surfaces with complex MnxOy reconstructions (See Supplementary Material). The magnetic spin flip configuration is studied for all MnO2-based surfaces since stoichiometric MnO2 is found to be more energetically favorable when all the surface spins flip (making the top and second layers FM aligned) Filippetti and Pickett (1999).
C. Thermodynamic Stability
The free energies of CaMnO3 (001) surfaces are calculated with the thermodynamic approach described in this section. In this model, the CaMnO3 bulk is considered to be in contact with an atmosphere composed of all its components in equilibrium. This implies that the system acts as a reservoir where removal and/or addition of any of its components at the surface leads to a range of thermodynamically stable reconstructions and compositions at different conditions. The oxygen chemical potential, , is used to correlate the surface stability with environmental conditions such as temperature, T, and oxygen partial pressure, p(O2).
The surface free energy, , of an individual surface slab, i, is defined as the excess amount of free energy needed to create the surface from its bulk form Reuter and Scheffler (2001),
| (1) | |||||
The Gibbs free energy of the slab is denoted by G. The term represents the free energy of the material in slab i as the sum of the chemical potentials from the bulk of each component, , multiplied by the number of its atoms in each slab, N Cahn (1973). The factor of is included to account for top and bottom slabs. The surface free energy is reported as energy per unit area.
The term shown in Eq. (2) accounts for the off-stoichiometric atoms of component n with respect to component m in any surface slab i by relating the number of atoms of components Nm and Nn in the slab to their ratio in the bulk,
| (2) |
In our case, the non-stoichiometric surface components were defined with respect to Mn atoms. Defining with respect to Ca atoms does not change the results. Next, Eqs. (1) and (2) are merged to express the Gibbs surface free energy as
| (3) | |||||
Since the system acts as a thermodynamic reservoir, the chemical potentials of CaMnO3 components are not independent; they are related to the chemical potential of CaMnO3 crystal, . The Gibbs free energy of bulk CaMnO3 per formula unit, g, is then equal to because the slabs must be in equilibrium with the bulk as shown below:
| (4) |
Inserting the relationship above into Eq. (3) simplifies the surface free energy to
| (5) | |||||
The bulk stability region is defined by a set of boundary conditions Lee et al. (2011); Heifets et al. (2011); Kolpak et al. (2008); Levchenko and Rappe (2008). First, Ca and Mn are not allowed to form metallic precipitates by satisfying the following conditions:
| (6) | |||||
| (7) |
Second, the bulk is stable, while binary metal oxides derived from its components do not precipitate:
| (8) | |||||
| (9) | |||||
| (10) | |||||
| (11) | |||||
| (12) |
Third, there should be no precipitation of other ternary sub-phases (CaxMnyOz) from the bulk CaMnO3. The experimental phase diagram of bulk CaMnO3 illustrates the importance of considering these ternary sub-phases, as they can co-exist with CaMnO3 Horowitz and Longo (1978); Balakirev and Golikov (2006). Consequently, the following conditions must be met:
| (13) | |||||
| (14) | |||||
| (15) | |||||
| (16) | |||||
| (17) |
The DFT energy is taken as the Helmholtz free energy at 0 K with zero-point energy, so the Gibbs free energy and the DFT energy are related as follows Reuter and Scheffler (2001),
| (18) |
The energetic contributions provided by the pV and the configurational entropy TS terms to the thermodynamic stability are considered to be negligible, as has been proven in previous studies Lee et al. (2011); Heifets et al. (2011); Kolpak et al. (2008); Levchenko and Rappe (2008).
The term F, which is equal to E-TS, is calculated from the vibrational modes of the system. The phonon density of states, (), is used to express F as an integral over frequency, :
| (19) |
The analytical expression of the harmonic quantum vibrational free energy per mode as a function of temperature and frequency, F(T,), can be written as
| (20) |
Once the Gibbs free energy of each compound is calculated, the stability region of bulk CaMnO3 as a function of T can be evaluated Lee et al. (2011). The vibrational free energy is included for all bulk phases while it is neglected for all slab structures Heifets et al. (2011); Kolpak et al. (2008); Levchenko and Rappe (2008). The surface vibrational behavior is complex, and the vibrational modes could be affected by the electronic redistribution at the surface region; however, it has been shown for other systems that the phonon frequencies do not vary the order of stable surface phases Lee et al. (2011).
The chemical potential for each component of CaMnO3 is defined as its difference from the total energy of its reference state:
| (21) | |||
| (22) | |||
| (23) |
For the metals Ca and Mn, the reference energy is the DFT total energy and vibrational free energy of the elemental bulk crystal. For oxygen, the reference is the energy of an O atom in an isolated O2 molecule. The E is corrected so that E = 2E+ E Kolpak et al. (2008) since a known shortcoming of DFT is the overestimation of binding energies Furche (2001), particularly for double bonds Walter and Rappe (1999); Grinberg et al. (2002).
| Experimental | Theoretical | |
|---|---|---|
| CaO | -6.59 | -6.71 |
| MnO (AFM-II) | -3.99 | -4.06 |
| Mn3O4 (FiM-III) | -14.38 | -15.46 |
| Mn2O3 (FM) | -9.93 | -11.36 |
| MnO2 (AFM) | -5.39 | -6.60 |
| CaMn2O4 (AFM) | — | -18.23 |
| CaMn7O12 (NC-AFM) | — | -47.01 |
| Ca2MnO4 (G-AFM) | — | -20.56 |
| Ca3Mn2O7 (G-AFM) | — | -34.34 |
| Ca4Mn3O10 (G-AFM) | — | -48.12 |
| CaMnO3 (G-AFM) | -12.83 | -13.79 |
-
a
FM layers in the [111] plane and successive antiparallel layers.
-
b
Ferrimagnetic with Mn atoms () in the corresponding order as Ref. Fritsch and Navrotsky (1996).
Combining the chemical potential expressions, Eq. (21-23), and the approximation to the Gibbs free energy for the slabs and CaMnO3 bulk leads to the following expression for the Gibbs surface free energy,
| (24) | |||||
The same approach including the vibrational free energy is applied to Eq. (4), whose expression is rewritten introducing the formation energy, , as follows,
| (25) |
This equation is then used to rearrange all the bulk stability boundary inequalities, Eq. (6-17), so that only and are kept as variables. For instance, Eq. (15) becomes
| (26) | |||||
The results from the DFT formation energies, , for all the binary and ternary sub-phases are compared to experimental quantities in Table 2. The formation energies are slightly overestimated, which is a well-known shortcoming of DFT Kotomin et al. (2008).
The surface phase diagram dependence on T and p(O2) provides insightful physical interpretations of the experimental range of conditions for the surface stability. The can be directly related to T and p(O2) by the ideal gas approximation, since at equilibrium the in CaMnO3 bulk is equal to the chemical potential of oxygen gas in the environment, =(T,p). This leads to
| (27) |
where (T,p0)=G(T,p0). Thermodynamic data from the NIST-JANAF thermochemical tables Jr. (1998) are used to determine the values of (T,p0) by selecting the reference state for G(T,p0) extrapolated to T=0 K and p(O2)=1 atm. Then, the values obtained are plotted for a temperature range of 0–3000 K at different p(O2) to correlate the stable surface phases with controlled environmental conditions.
III. Results and Discussion
A. Magnetic Surface Reconstruction
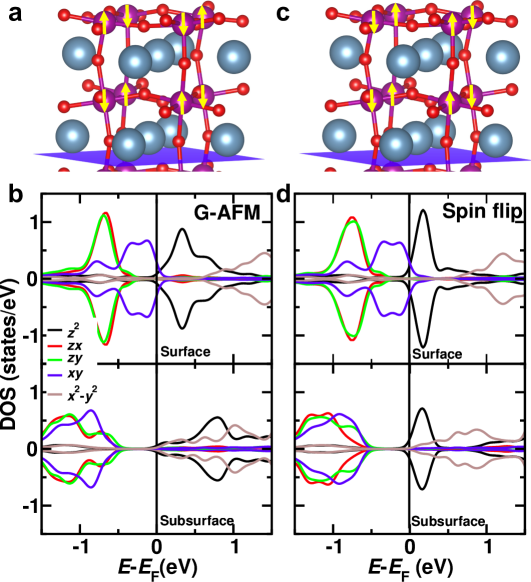
Depending on their surface composition, some of the MnO2-based slabs undergo a magnetic spin flip reconstruction at the surface Filippetti and Pickett (1999) that is energetically favorable, leading to lower total energy and greater surface stability. This magnetic spin flip reconstruction refers to a surface with G-AFM bulk order, but where the Mn spins in the surface layer align with the spins of the Mn in the second layer, generating a bilayer with C-type AFM alignment, as shown in Fig. 2(a,c). This occurs when the surface breaks the degeneracy of eg and t2g states, as the Mn cage is changed from octahedral to square pyramidal. This leads to the partial occupation of the eg d bands at the surface, which favors the FM alignment of spins between the surface and subsurface MnO2 layers.
In bulk CaMnO3, the superexchange magnetic interactions between the filled t2g shells and the formally empty eg shells determine the G-AFM ordering. However, this G-AFM ordering does not extend to the (001) MnO2-terminated surfaces, since double-exchange governs the magnetic interaction between Mn subsurface and surface. The Mn 3d orbital-projected density of states (DOS) of both G-AFM and spin flip surface and subsurface layers of the MnO2-terminated stoichiometric surface are shown in Fig. 2(b,d). The surface states of both G-AFM and spin-flip show the broken degeneracy of eg d, d and t2g dxy, (dxz,dyz), as expected for square pyramidal. The G-AFM subsurface states have degenerate eg and t2g shells; however, the spin-flip subsurface eg degeneracy is broken, as the d is favorably aligned with the d from its neighboring surface state. The alignment of the Mn spins on surface and subsurface layers is induced by a double-exchange process, which is enabled by the occupation of the d orbital, lowering the energy of MnO2-terminated surfaces with the spin flip arrangement. Our DFT computed stoichiometric MnO2-surface yields a spin flip structure as its magnetic ground state, with an energy lowering relative to G-AFM of 15 meV per primitive surface cell.
Based on the prevalence of the energetically favorable magnetic spin flip reconstruction on the stoichiometric MnO2-terminated surface, it is important to study the effect of magnetic reconstruction on surface stability. All the MnO2-based surface reconstructions were relaxed with both G-AFM and spin flip magnetic ordering. Different magnetic configurations were explored for CaO-terminated surfaces with Mn adatoms as well as MnO2 terminated surfaces with MnxOy adatom reconstructions (See Supplementary Material). Half of the thermodynamically stable MnO2-based surfaces are magnetic spin flip configurations, as shown in Fig. 3 (surface phases with red grid lines). For surface reconstructions with only one extra Mn adatom, the spin arrangement that makes a local FM alignment between the surface Mn adatom and the nearest Mn atom is more favorable. For example, the local FM alignment between the Mn surface adatom and the Mn on the subsurface layer in CaO-0.5Ca+0.5Mn, which is within the bulk stability region, is 12 meV per primitive surface cell more stable than a local AFM alignment (See Supplementary Material).
B. Surface Phase Diagram
The computed surface phase diagram of CaMnO3, generated after calculating the surface free energy of the atomic and magnetic lowest energy configuration of each surface phase, is shown in Fig. 3. This diagram predicts a total of fourteen thermodynamically stable surface phases in the given range of and . The phase diagram can be divided into four different quadrants based on conditions of , and . Even though is not directly plotted, its value can always be deduced from Eq. (25). The upper left quadrant (I) shows oxygen rich and cation poor conditions; therefore, the favored phases are terminations with excess oxygen adatoms, denoted as MnO2+2.0O, CaO+2.0O and CaO+1.0O. This quadrant also shows stability of the stoichiometric CaO- and MnO2-terminated surfaces as well as MnO2-based reconstructions, MnO2-0.5Mn-0.5O and MnO2+0.5Mn+1.0O. In quadrant (II), both O and Ca are plentiful, leading to the absence of MnO2-terminated stable surfaces and the presence of Ca adatoms in stable CaO-based surfaces, CaO+1.0Ca+2.0O and CaO+1.0Ca+1.0O. The bottom right quadrant (III) involves oxygen-poor but relatively Ca-rich conditions. This region is characterized by stable surfaces with MnO2 termination, denoting that even though Ca is at high concentrations, MnO2-terminated surfaces are more favorable at oxygen poor conditions, clearly indicated by a surface phase where a Ca vacancy is filled by a Mn adatom, CaO-0.5Ca+0.5Mn. In the left bottom quadrant (IV), Mn is at its richest condition since both O and Ca are at poor levels. This promotes the large stable region for both MnO2+1.0Mn+1.0O and MnO2+2.0Mn+2.0O.
A boundary line from the top left to mid-bottom right corners of the diagram delimits the regions of CaO- (upper) and MnO2- (lower) terminated surfaces. Six different CaO-terminated surfaces are found, many of them covering a significant area of chemical potential space. On the other hand, MnO2-type phases generally show smaller stable regions with a higher variety of phases, which can be explained by the multivalency of Mn. For instance, the predicted path from MnO2+2.0Mn+2.0O to MnO2+2.0O consists of a complex series of transitions. These transitions occur by increasing the from -3.0 eV to -0.5 eV while keeping constant the at -7.0 eV. The changes in can be controlled experimentally by varying T or p(O2). For example, these surface phase transitions are predicted to occur at a constant p(O2) of 10-10 atm, as the temperature is decreased from 1400 K to 400 K. Starting with the surface initially at 1400 K in the MnO2+2.0Mn+2.0O phase, as the temperature is reduced to 750 K, the desorption of oxygen atoms is thermodynamically favorable, leading to the surface reconstruction MnO2+1.0Mn+1.0O. Reducing the temperature further to 600 K should cause the surface to reconstruct into MnO2+0.5Mn+1.0O and even co-exist with stoichiometric MnO2-terminated surface. Once the temperature reaches 400 K, the surface phase transition to MnO2+2.0O is thermodynamically favored.
The slopes of the boundaries between phases directly relate to the changes in numbers of surface atoms of each species. The CaO+2.0O surface phase changes to CaO+1.0Ca+2.0O at a vertical boundary of -5.75 eV via adsorption of Ca cations. Similarly, horizontal lines at -0.8 eV and -0.9 eV denotes its transition to CaO+1.0O and stoichiometric CaO, respectively, by the removal of oxygen adatoms. Between these extremes, the slope of the CaO to CaO+1.0Ca+2.0O transition, as indicated in Fig. 3, is -, suggesting the addition of 2 Ca cations and 4 oxygen atoms per cell since the transition line will be crossed by moving toward Ca- and O-rich conditions. Taking into account the relationship shown in Eq. (25), the slope of the boundaries between surface phases can then be defined as , where a, b, and c represent the net change in number of Ca, Mn, and O atoms, respectively, between phases. For example, the removal of 2 Mn atoms and the adsorption of 2 oxygen atoms per cell results in the transition of surface phase MnO2+2.0Mn+2.0O to MnO2+1.0Mn+1.0O. This is in agreement with the boundary for this phase transition having slope of -.
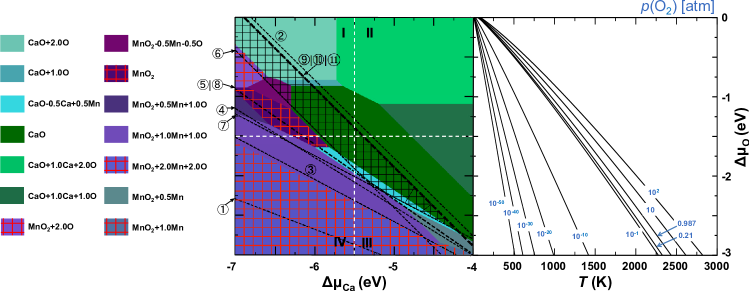
Stability Region
The surface phase diagram shows a series of stable surfaces, but only a few of them are within the bulk stability region. The ternary sub-phases illustrated in Eqs. 13-17 are included in the definition of the stability region since an extensive experimental examination of the phase relations of Ca-Mn-O bulk systems Horowitz and Longo (1978); Balakirev and Golikov (2006) found the co-existence lines for the CaMnO3 phase with these ternary sub-phases, and correspondingly narrower stability boundaries for CaMnO3. The boundary of bulk phase stability is defined by Ca2MnO4, Ca3Mn2O7, and Ca4Mn3O10 on the top and Mn2O3, MnO2, CaMn2O4, and CaMn7O12 on the bottom (lines 9-11 and 5-8, respectively, shown in Fig. 3).
A confirmation of the importance of including the ternary sub-phases is the ability of this model to describe the decomposition of bulk CaMnO3. Experimentally, decomposition of CaMnO3 occurs at 1700 K and 0.21 atm O2 Horowitz and Longo (1978). Using the DFT-generated stability region computed at 0 K, this decomposition temperature is predicted to be 2100 K at 0.21 atm by considering the decomposition conditions at the low end of the bulk stability region. However, if boundaries 7-11 are neglected, then the stability region is limited by MnO2, Mn2O3 and Mn3O4 on the bottom and bordered by CaO on the top (lines 6, 5, 4, and 2, respectively, in Fig. 2), artificially increasing the computed decomposition temperature to over 2500 K at 0.21 atm.
These ternary sub-phases include the Ruddlesden-Popper phases CaO(CaMnO3)n, which are perovskite structures with double CaO layer (001) planes with n layers of CaMnO3 in between Fawcett et al. (1998). Naturally, the surface reconstruction with CaO double layer, CaO+1.0Ca+1.0O, is found on the side where the Ruddlesden-Popper phases CaO(CaMnO3)n limit the stability of the CaMnO3 bulk. The CaMn2O4 phase is a marokite structure Ling et al. (2001), where the MnO6 octahedra share edges and corners. This network of octahedra leads to channels along the a-axis which provide Ca atoms with 8-coordinated sites. It has been found that this marokite-type phase shows potential photocatalytic activity Xue-Wei et al. (2011). This bulk phase borders the surface phase with a MnO2-terminated layer that has an additional MnO layer, MnO2+1.0Mn+1.0O. CaMn7O12 is a complex distorted double perovskite, whose chemical formula is formally written as (CaMn)(MnMn+4)O12. This perovskite-derived phase consists of of the A-sites occupied by Ca and the rest by Mn+3, while the B-site charges are arranged via charge ordering below 440 K Bochu et al. (1980). All these ternary sub-phases are stable for some range of chemical potentials Horowitz and Longo (1978); Balakirev and Golikov (2006), defining realistic stability boundaries for the surface of CaMnO3.
Temperature Dependence
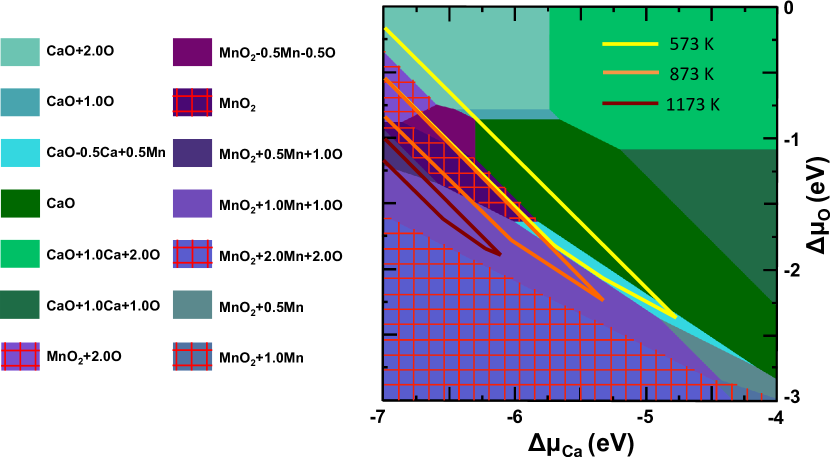
The bulk stability region described above is based on DFT calculations at 0 K enclosing the CaO+2.0O, CaO+1.0O, CaO, CaO-0.5Ca+0.5Mn, MnO2+2.0O, and MnO2-0.5Mn-0.5O phases. A more accurate description of the stability region requires the inclusion of the vibrational free energy. This is significant, since it determines how the stability region changes as a function of temperature.
The bulk stability region is recalculated incorporating the bulk vibrational free energy at 573 K, 873 K and 1173 K, shown in Fig. 4. These temperatures are selected since they are within the range of experimental temperature conditions used in the synthesis and pulsed laser deposition of the CaMnO3 crystal Jorge et al. (2001) and film, as well as in the annealing process for surface characterization techniques. These temperatures shift the stability region such that only MnO2-based surfaces are favored. As temperature increases, the stability region shifts towards Ca-poor and O-poor conditions, in agreement with previous studies on other surfaces Lee et al. (2011); Kolpak et al. (2008). As the stability region moves, it encloses other phases that are predicted to be stable at those temperatures. At 573 K, the surface phases within the bulk stability region are the same as in Fig. 3, with the addition of the stoichiometric MnO2-terminated surface. Increasing the temperature by 300 K leads to the stability of MnO2+1.0Mn+1.0O surface phase. At 1173 K, the phases within the bulk stability region include the MnO2+0.5Mn+1.0O phase. The clear trend is that the surface structures with MnO2 terminations are more favorable at higher temperatures.
Changes in the shape of the stability region reflect how binary and ternary sub-phase boundaries shift as the vibrational free energy at various temperatures is included. Overall, the bulk stability region tends to shrink as the higher temperature contributions are included. This is in good agreement with previous reports, since it is experimentally observed that CaMnO3 crystal decomposes at temperatures higher than 1700 K Horowitz and Longo (1978) and our theoretical bulk stability region vanishes around the same temperature.
IV. Summary and Conclusions
The energies of series of CaO- and MnO2-terminated CaMnO3 (001) surfaces with different combinations of vacancies, adatoms and additional layers are reported using ab initio thermodynamics to theoretically predict the surface phase diagram. The predicted surface phase diagram has surface structures for both terminations, with stability ranges specified by and . The is related to T and p(O2), linking surface stability with experimental conditions.
The chemical potential region for which CaMnO3 is the only bulk phase is bounded by coexistence lines with the Ruddlesden-Popper phases CaO(CaMnO3) (where n=1, 2, and 3), as well as Mn2O3, MnO2, CaMn2O4, and CaMn7O12. This shows the relevance of incorporating the ternary subphases from the experimental Ca-Mn-O compositional phase diagram Horowitz and Longo (1978); Balakirev and Golikov (2006). The surface phases that are favored within this bulk stability region change once the vibrational free energy at different temperatures is included. The stability region shifts to lower for higher T, leading to the predominance of complex MnO2-based surfaces at T above 800 K. Thermodynamically stable phases include potentially reactive surfaces, MnO2+1.0Mn+1.0O, since it shows two unique Mn sites based on coordination.
The MnO2-based surfaces show intriguing atomic and magnetic structures which are comprehensively explored by computing the magnetic ground state and analyzing its thermodynamic stability. Some of the MnO2-terminated surfaces are energetically more favorable when their surface and subsurface spins are aligned. This occurs when the filling of the d orbital causes a more favorable double-exchange interaction between the subsurface and surface Mn atoms. The atomic composition of the surface affects this magnetic reconstruction; for some MnxOy reconstructions, the surface reconstructs, rearranging the magnetic interactions in the system. However, this magnetic spin flip reconstruction prevails for key stable surfaces such as stoichiometric MnO2-terminated and MnO2+2.0O.
This study addresses structures with ()R45∘ surface symmetry, leading to ordered surfaces due to periodic boundary conditions. Admittedly, real surfaces are more complex and disordered; however, by taking into account the chemical and thermal contributions to the surface stability and exploring a wide range of possible surface structures, the predicted phase diagram provides an acceptable foundation for the analysis of experimental data on this surface. Consequently, this predicted surface phase diagram could lead to experimental studies performing low-energy electron diffraction and scanning tunneling microscopy to validate the stable surface reconstructions and further explore the surface evolution.
Acknowledgments
D.S.-G. was supported by the Office of Naval Research under Grant No. N00014-11-1-0664. C.-W.L. was supported by the US Department of Energy Office of Basic Energy Sciences under Grant No. DE-FG02-07ER15920. D.Y. was supported by the National Science Foundation under Grant No. DMR-1124696. A.M.R. was supported by the National Science Foundation under Grant No. CMMI-1334241. Computational support was provided by the High-Performance Computing Modernization Office of the US Department of Defense, and the National Energy Research Scientific Computing Center of the US Department of Energy.
References
- Bhattacharjee et al. (2009) S. Bhattacharjee, E. Bousquet, and P. Ghosez, Phys. Rev. Lett. 102, 117602 (2009).
- Wang et al. (2012) H. Wang, L. He, and X. Wu, EPL (Europhysics Letters) 100, 17005 (2012).
- Urata et al. (2007) S. Urata, R. Funahashi1, T. Mihara, A. Kosuga, S. Sodeoka, and T. Tanaka, International Journal of Applied Ceramic Technology 4, 535 (2007).
- Koumoto et al. (2010) K. Koumoto, Y. Wang, R. Zhang, A. Kosuga, and R. Funahashi, Annual Review of Materials Research 40, 363 (2010).
- Zeng et al. (1999) Z. Zeng, M. Greenblatt, and M. Croft, Phys. Rev. B 59, 8784 (1999).
- Kawashima et al. (2008) A. Kawashima, K. Matsubara, and K. Honda, Bioresource Technology 99, 3439 (2008).
- Najafpour et al. (2012) M. M. Najafpour, B. Pashaei, and S. Nayeri, Dalton Trans. 41, 4799 (2012).
- Filippetti and Pickett (1999) A. Filippetti and W. E. Pickett, Phys. Rev. Lett. 83, 4184 (1999).
- Filippetti and Pickett (2000) A. Filippetti and W. E. Pickett, Phys. Rev. B 62, 11571 (2000).
- Nguyen et al. (2011) T. T. Nguyen, T. C. Bach, H. T. Pham, T. T. Pham, D. T. Nguyen, and N. N. Hoang, Physica B: Condensed Matter 406, 3613 (2011).
- Reuter and Scheffler (2001) K. Reuter and M. Scheffler, Phys. Rev. B 65, 035406 (2001).
- Perdew et al. (2008) J. P. Perdew, A. Ruzsinszky, G. I. Csonka, O. A. Vydrov, G. E. Scuseria, L. A. Constantin, X. Zhou, and K. Burke, Phys. Rev. Lett. 100, 136406 (2008).
- Giannozzi et al. (2009) P. Giannozzi, S. Baroni, N. Bonini, M. Calandra, R. Car, C. Cavazzoni, D. Ceresoli, G. L. Chiarotti, M. Cococcioni, I. Dabo, A. D. Corso, S. de Gironcoli, S. Fabris, G. Fratesi, R. Gebauer, U. Gerstmann, C. Gougoussis, A. Kokalj, M. Lazzeri, L. Martin-Samos, N. Marzari, F. Mauri, R. Mazzarello, S. Paolini, A. Pasquarello, L. Paulatto, C. Sbraccia, S. Scandolo, G. Sclauzero, A. P. Seitsonen, A. Smogunov, P. Umari, and R. M. Wentzcovitch, J. Phys.:Condens. Matter 21, 395502 (2009).
- Luo et al. (2007) W. Luo, A. Franceschetti, M. Varela, J. Tao, S. J. Pennycook, and S. T. Pantelides, Phys. Rev. Lett. 99, 036402 (2007).
- Cococcioni and de Gironcoli (2005) M. Cococcioni and S. de Gironcoli, Phys. Rev. B 71, 035105 (2005).
- Rappe et al. (1990) A. M. Rappe, K. M. Rabe, E. Kaxiras, and J. D. Joannopoulos, Phys. Rev. B Rapid Comm. 41, 1227 (1990).
- Ramer and Rappe (1999) N. J. Ramer and A. M. Rappe, Phys. Rev. B 59, 12471 (1999).
- (18) http://opium.sourceforge.net.
- Fuchs and Scheffler (1999) M. Fuchs and M. Scheffler, Comput. Phys. Commun. 119, 67 (1999).
- Porezag et al. (1999) D. Porezag, M. R. Pederson, and A. Y. Liu, Phys. Rev. B 60, 14132 (1999).
- Poeppelmeier et al. (1982) K. R. Poeppelmeier, M. E. Leonowicz, J. C. Scanlon, J. M. Longo, and W. B. Longo, J. Solid State Chem. 45, 71 (1982).
- Bhattacharjee et al. (2008) S. Bhattacharjee, E. Bousquet, and P. Ghosez, J. Phys.: Condens. Matter 20, 255229 (2008).
- Monkhorst and Pack (1976) H. J. Monkhorst and J. D. Pack, Phys. Rev. B 13, 5188 (1976).
- Baroni et al. (2001) S. Baroni, S. de Gironcoli, and A. Dal Corso, Rev. Mod. Phys. 73, 515 (2001).
- Gonze (1995) X. Gonze, Phys. Rev. A 52, 1096 (1995).
- Tasker (1979) P. W. Tasker, Journal of Physics C: Solid State Physics 12, 4977 (1979).
- Pickett and Singh (1996) W. E. Pickett and D. J. Singh, Phys. Rev. B 53, 1146 (1996).
- Jung et al. (1997) J. H. Jung, K. H. Kim, D. J. Eom, T. W. Noh, E. J. Choi, J. Yu, Y. S. Kwon, and Y. Chung, Phys. Rev. B 55, 15489 (1997).
- Tsukahara et al. (2010) H. Tsukahara, S. Ishibashi, and K. Terakura, Phys. Rev. B 81, 214108 (2010).
- Cahn (1973) J. W. Cahn, Interfacial Segregation (ASM, Metals, Park, OH, 1973) p. 3.
- Lee et al. (2011) C.-W. Lee, R. K. Behera, E. D. Wachsman, S. R. Phillpot, and S. B. Sinnott, Phys. Rev. B 83, 115418 (2011).
- Heifets et al. (2011) E. Heifets, E. A. Kotomin, Y. A. Mastrikov, S. Piskunov, and J. Maier, Thermodynamics - Interaction studies - Solids, liquids and gases (InTech Open Access Publishers, 2011) pp. 491–518.
- Kolpak et al. (2008) A. M. Kolpak, D. Li, R. Shao, A. M. Rappe, and D. A. Bonnell, Phys. Rev. Lett. 101, 036102 (2008).
- Levchenko and Rappe (2008) S. V. Levchenko and A. M. Rappe, Phys. Rev. Lett. 100, 256101 (2008).
- Horowitz and Longo (1978) H. S. Horowitz and J. M. Longo, Materials Research Bulletin 13, 1359 (1978).
- Balakirev and Golikov (2006) V. F. Balakirev and Y. V. Golikov, Inorganic Materials 42, S49 (2006).
- Furche (2001) F. Furche, Phys. Rev. B 64, 195120 (2001).
- Walter and Rappe (1999) E. J. Walter and A. M. Rappe, Surf. Sci. 427, 11 (1999).
- Grinberg et al. (2002) I. Grinberg, Y. Yourdshahyan, and A. M. Rappe, J. Chem. Phys. 117, 2264 (2002).
- Fritsch and Navrotsky (1996) S. Fritsch and A. Navrotsky, Journal of the American Ceramic Society 79, 1761 (1996).
- Kotomin et al. (2008) E. A. Kotomin, Y. A. Mastrikov, E. Heifets, and J. Maier, Phys. Chem. Chem. Phys. 10, 4644 (2008).
- Jr. (1998) M. W. Chase Jr., J. Phys. Chem. Ref. Data, Monograph 9 , 1 (1998).
- Fawcett et al. (1998) I. D. Fawcett, J. E. Sunstrom IV, M. Greenblatt, M. Croft, and K. V. Ramanujachary, Chemistry of Materials 10, 3643 (1998).
- Ling et al. (2001) C. D. Ling, J. Neumeier, and D. N. Argyriou, Journal of Solid State Chemistry 160, 167 (2001).
- Xue-Wei et al. (2011) W. Xue-Wei, Z. Hai-Xin, L. Xiao-Jun, and Z. Xing-Gan, Chinese Physics Letters 28, 107101 (2011).
- Bochu et al. (1980) B. Bochu, J. Buevoz, J. Chenavas, A. Collomb, J. Joubert, and M. Marezio, Solid State Communications 36, 133 (1980).
- Jorge et al. (2001) M. E. Melo Jorge, A. Correia dos Santos, and M. R. Nunes, International Journal of Inorganic Materials 3, 915 (2001).