The Gemini NICI Planet-Finding Campaign: Asymmetries in the HD 141569 disc
Abstract
We report here the highest resolution near-IR imaging to date of the HD 141569A disc taken as part of the NICI (near-IR coronagraphic imager) Science Campaign. We recover 4 main features in the NICI images of the HD 141569 disc discovered in previous HST imaging: 1) an inner ring / spiral feature. Once deprojected, this feature does not appear circular. 2) an outer ring which is considerably brighter on the western side compared to the eastern side, but looks fairly circular in the deprojected image. 3) an additional arc-like feature between the inner and outer ring only evident on the east side. In the deprojected image, this feature appears to complete the circle of the west side inner ring and 4) an evacuated cavity from 175 AU inwards. Compared to the previous HST imaging with relatively large coronagraphic inner working angles (IWA), the NICI coronagraph allows imaging down to an IWA of 0.3”. Thus, the inner edge of the inner ring/spiral feature is well resolved and we do not find any additional disc structures within 175 AU. We note some additional asymmetries in this system. Specifically, while the outer ring structure looks circular in this deprojection, the inner bright ring looks rather elliptical. This suggests that a single deprojection angle is not appropriate for this system and that there may be an offset in inclination between the two ring / spiral features. We find an offset of 42 AU between the inner ring and the star center, potentially pointing to unseen inner companions.
keywords:
circumstellar matter – infrared: stars.1 Introduction
During the process of formation, planets can sculpt complex structures in their natal discs, observable both at the transitional and debris disc stage. Thus, features such as gaps and spirals within such discs are often considered signposts of ongoing or recently completed planet formation. However, complex structures might form with no planets present – for instance, Lyra & Kuchner (2013) recently found that dust-gas interactions in debris discs with remnant gas may also form sharp features in discs, such as narrow, eccentric rings. Thus, considerable care in data analysis and modeling is necessary to attempt to elucidate the origins of imaged structure in any given disc.
One disc which has already proven to be a vital laboratory of in-situ planet-formation and disc structure is that around HD 141569A. HD 141569A is a B9.5 Ve young pre-main sequence star (Merín et al., 2004) 1168 pc from the Sun (van Leeuwen, 2007) with co-moving M2 and M4 companions that form a binary pair 7.5” from A (Weinberger et al., 2000). All three stars show signs of youth and Weinberger et al. (2000) find an age for the system of 53 Myr. The HD 141569A disc is one of the largest imaged discs known to date, both in projection on the sky, with a radial extent along its major axis of 450 AU (4” on the sky). The disc has been variously classified as a debris disc and a transitional disc, as it still has some remnant gas. It is now generally considered an example of a very young debris disc.
HST and ground based studies in both optical and near-IR wavelengths have revealed complex structure in scattered light in this disc (Augereau et al., 1999; Weinberger et al., 1999; Mouillet et al., 2001; Boccaletti et al., 2003; Clampin et al., 2003):
- 1.
- 2.
- 3.
- 4.
-
5.
a very faint open spiral structure on the edge of the disc which, towards the southwest, leads towards the binary companions HD141569BC (Clampin et al., 2003), potential evidence for a fly-by event, and
-
6.
an offset of up to 30 AU between the star position and the measured disc centre (Clampin et al., 2003).
Numerous modeling efforts both with and without embedded planets have been attempted but none to date can capture all the features of the imaged HD 141569A disc. Takeuchi & Artymowicz (2001) model a mixed gas and dust ring and can reproduce an inner and outer ring structure purely due to dust migration from gas friction without invoking any embedded companions or interactions. However, this modeling approach fails to reproduce any of the observed spiral structure in this disc. Augereau & Papaloizou (2004) and Quillen et al. (2005) model the effects of the orbital passage of a bound companion (in this case, presumably the binary M stars HD 141569BC) using an N-body gravitational code and a 2D hydrodynamical code respectively. Such an interaction can reproduce the outer spiral features and faint open spiral structure seen in the HD 141569A disc, but fails to reproduce the inner spiral / ring or inner cavity. Wyatt (2005) models the effect of the secular perturbations from a planet on an eccentric orbit on the dust disc using an N-body gravitational code. This approach qualitatively reproduces the outer spiral feature, but not the inner features, or the faint outer open spiral seen by Clampin et al. (2003). Two more recent approaches combine the effects of a fly-by event and one or more embedded planets (Ardila et al., 2005; Reche et al., 2009), using N-body and SPH simulations. These studies are generally able to reproduce the spiral structures seen with one planet and a fly-by, but both struggle to reproduce the gap between the inner and outer spiral / ring structures.
We report here the tightest inner working angle (henceforth IWA) and highest near-IR resolution observations to date of the HD 141569A disc taken as part of the NICI Science Campaign. From 2008 December to 2012 September, the NICI Planet-Finding Campaign (Liu et al., 2010; Wahhaj et al., 2013a, b; Nielsen et al., 2013; Biller et al., 2013; Wahhaj et al., 2014; Nielsen et al., 2014) obtained deep, high-contrast AO imaging of 230 young, nearby stars. Our observations confirm much of the previously observed structure, reveal new asymmetries in this disc, and place strong upper limits on the mass of any embedded planet.
2 Observations and Data Reduction
The near-IR coronagraphic imager (NICI) was the first custom planet-finding camera, available at the Gemini South 8-m telescope from 2008-2012. NICI is a dedicated adaptive optics (AO) instrument tailored expressly for direct imaging of exoplanet companions (Chun et al. 2008), combining several techniques to attenuate starlight and suppress speckles for direct detection of faint companions to bright stars: (1) Lyot coronagraphy, (2) dual-channel imaging for Spectral Differential Imaging (SDI; Racine et al. 1999; Marois et al. 2005; Biller et al. 2007), and (3) operation in a fixed Cassegrain rotator mode for Angular Differential Imaging (ADI; Liu 2004; Marois et al. 2006; Lafrenière et al. 2007). As part of the NICI Planet-finding Campaign, HD 141569 was observed with NICI on 2009-03-07, 2010-04-08, and 2011-05-03. Observations and sky rotation over the observation are reported in Table 1. Observations were conducted in the two standard NICI campaign modes: Angular Spectral Differential Imaging (ASDI) and Angular Differential Imaging (ADI). In both modes, the telescope rotator was left off, allowing the field to rotate with parallactic angle on the sky, enabling effective speckle suppression. In ASDI mode, we observed simultaneously in two narrow band filters (1.578 m; 4% and 1.652 m; ) which cover the 1.6 m absorption feature found in T-type brown dwarfs. To prevent saturation and yield higher contrasts, the primary star was always placed behind NICI’s partially transmissive focal plane mask. Frame time was kept to 60 s / frame across the NICI campaign, with each frame consisting of multiple coadded subframes to prevent saturation. We reduced each dataset using two independent pipelines: 1) a custom ADI pipeline developed specifically for the NICI Campaign (Wahhaj et al., 2013b) and 2) the publically available PCA (principal component analysis) pipeline of Dimitri Mawet (http://www.astro.caltech.edu/dmawet/pca-pipeline.html).
The NICI Campaign pipeline is described in detail in Wahhaj et al. (2013b). We describe the basic data reduction only very briefly here. After basic flatfield and distortion correction, each image is registered to a master image based on the centroid position of the primary star under the mask. A PSF image is built from the median combination of the entire stack of images and then subtracted from each individual image. The individual images are then rotated to place north up and east to the left and median combined. For the purposes of this study, data from each channel taken in ASDI mode were reduced separately.
For the PCA reduction, basic data processing was done similarly as with the NICI Campaign pipeline. PCA-based pipelines (following the algorithms of Soummer et al. 2012, Amara & Quanz 2012) use a stack of images (taken at different times or different wavelengths) to determine the principle components of the data. These principal components are then used to build ideal PSFs image by image for quasi-static speckle suppression. For each NICI dataset, we reduced data from each narrowband filter separately, using the individual frames from a single narrowband filter over the ADI time sequence to generate the principal components and build ideal PSFs. After ideal PSFs are built and subtracted, each frame is then derotated to place north up and east to the left. Finally, all frames are stacked to provide the final image.
We retrieve the HD 141569 disc in all 4 NICI datasets. However, the 2009 and 2010 datasets rotate by 30∘ on the sky and thus, the disc is more affected by self-subtraction and is comparatively faint in these datasets. Therefore, we only present results from the 2011-05-03 dataset in this paper.
3 Results
3.1 Pipeline results
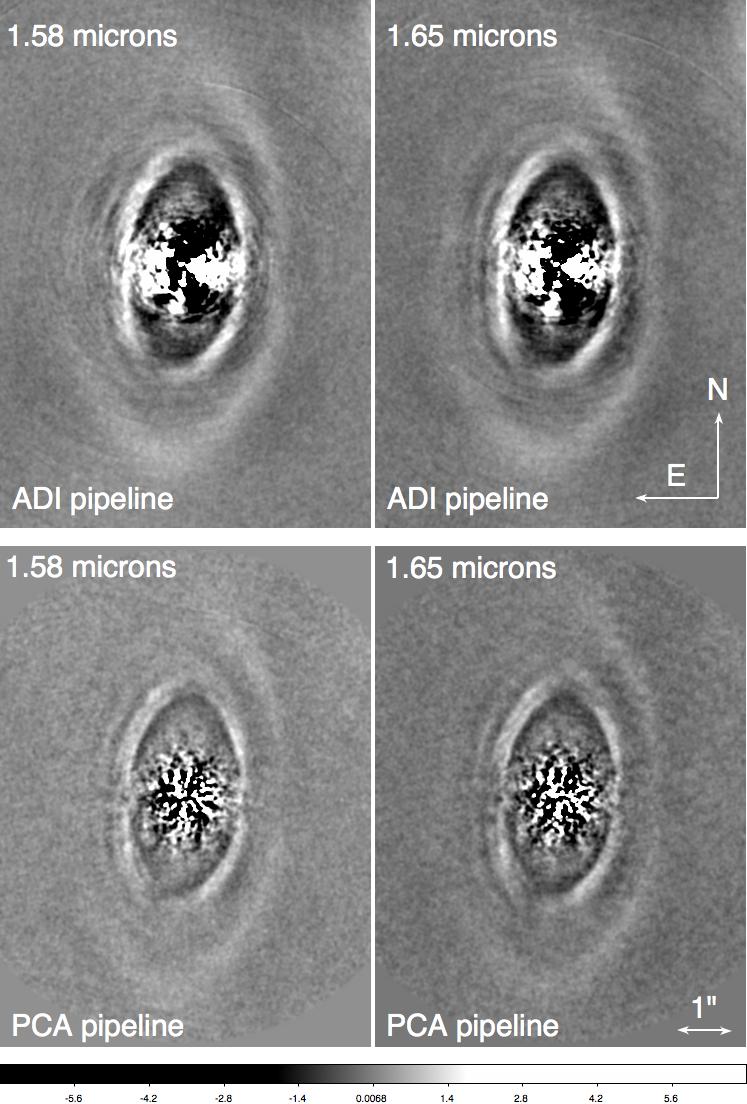
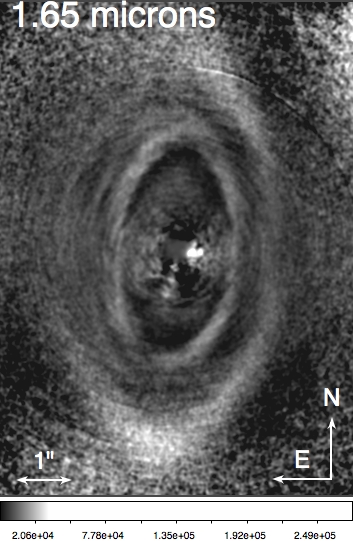
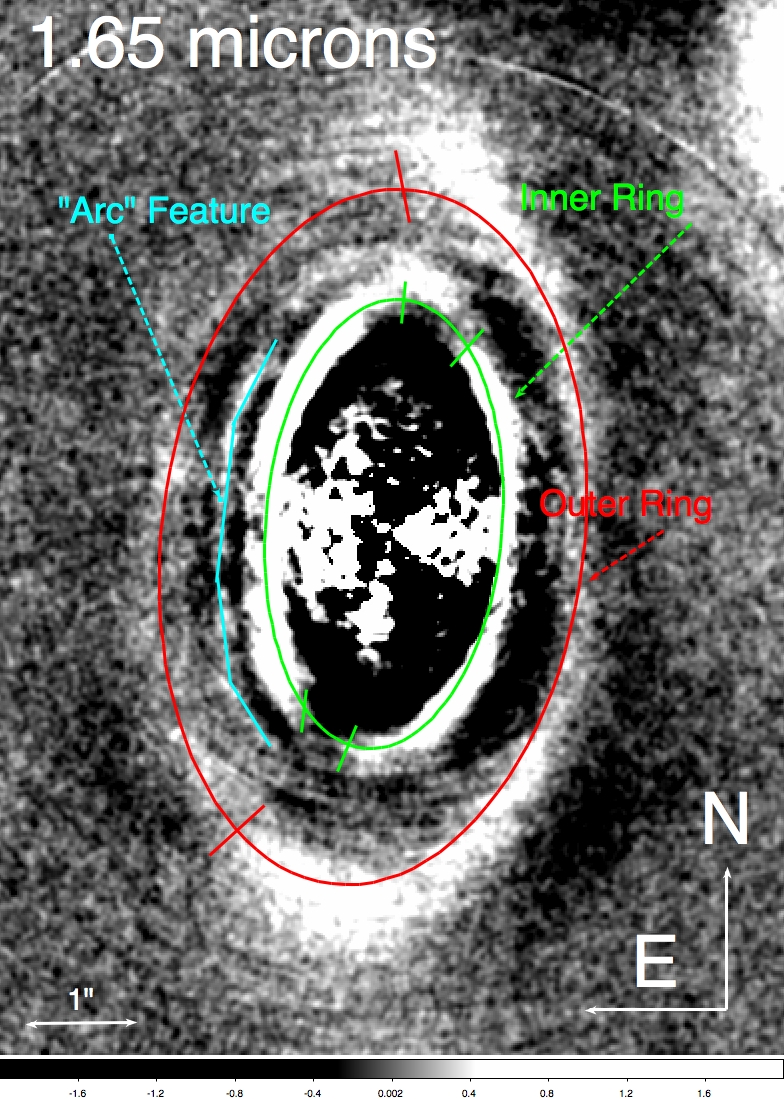
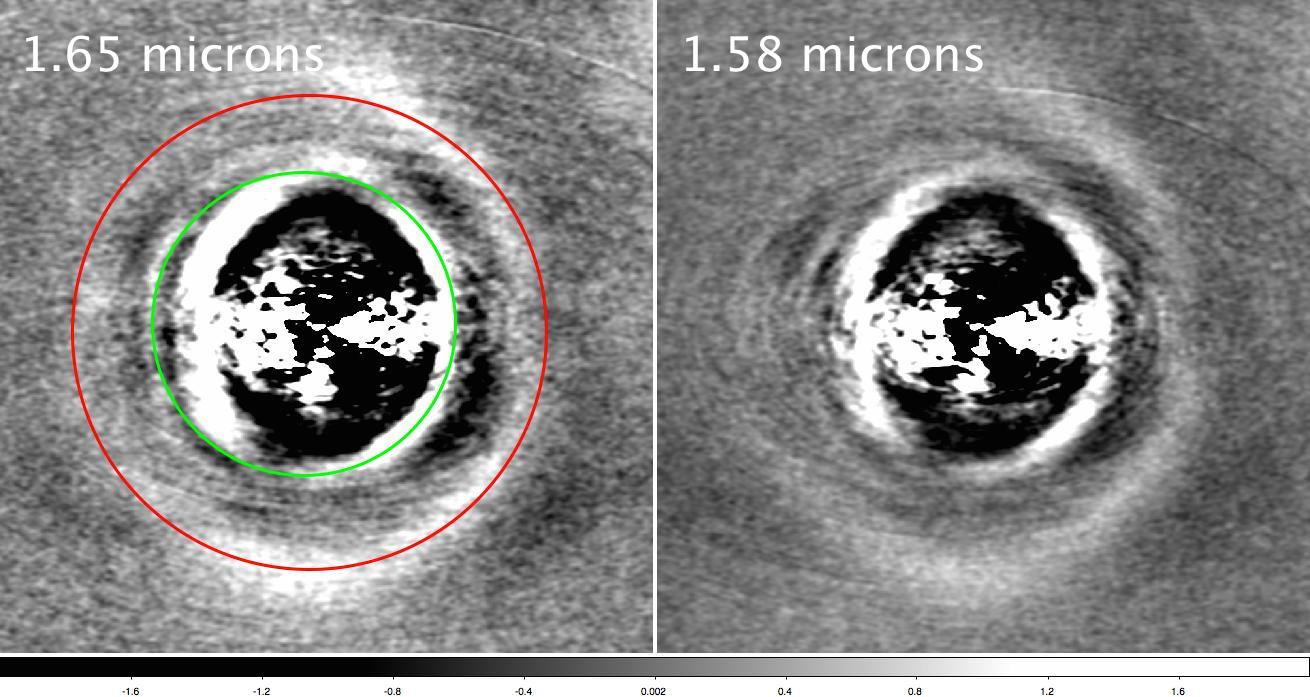
Reduced images from both pipelines and both NICI channels are presented in Fig. 1. Images have been smoothed with a 3-pixel Gaussian to highlight faint structures. Disc features in the ADI and PCA-reduced images appear roughly similar, although it is clear that the disc self-subtraction is worse in in the PCA reduction. In order to highlight faint outer structure, the 1.65m ADI-processed image scaled by (radial separation from the image center) is presented in Fig. 2 An annotated image with main features labeled is presented in Fig. 3. A deprojected image is presented in Fig. 4, using an inclination to the line of sight of 51∘ (where 90∘ is edge-on and 0∘ is pole-on) and a PA of 356∘ (from Weinberger et al. (1999)).
3.2 Features recovered
We recover 5 main features in the NICI images of the HD 141569 disc discovered in previous HST imaging, however, significant self-subtraction is apparent in both our ADI and PCA reductions (Fig. 1) which affects the apparent morphology of some of these features:
1) an inner ring / spiral feature (Clampin et al., 2003; Mouillet et al., 2001; Weinberger et al., 1999). In the NICI imaging, self-subtraction will affect the details of ring or spiral feaures, so we cannot confirm nor refute the claim from Clampin et al. (2003) of tightly wound spirals. Once deprojected, this feature does not appear circular.
2) an outer ring / spiral (Clampin et al., 2003; Mouillet et al., 2001; Weinberger et al., 1999; Augereau et al., 1999) which is considerably brighter on the western side compared to the eastern side, but looks fairly circular in the deprojected image.
3) an additional arc-like feature between the inner and outer ring only evident on the east side of the image and only imaged in the IR before by Mouillet et al. (2001). This may correspond to the tightly wound spiral claimed by Clampin et al. (2003). In the deprojected image, this feature appears to complete the circle of the west side inner ring.
4) a lower surface brightness region between the inner and outer ring/spiral features.
We do not retrieve the wide “open spiral arms” found by Clampin et al. (2003), but we may simply not be sensitive to such low surface brightness features; working in the near-IR from the ground, we are limited by a much higher sky background compared to the optical HST-ACS imaging of Clampin et al. (2003).
We note some additional asymmetries in this system. Specifically, while the outer ring / spiral structure appears circular in this deprojection, the inner bright ring / spiral appears elliptical. This suggests that a single deprojection angle is not appropriate for this system and that there may be an offset in inclination angle between the two ring / spiral features. Additionally, there appear to be gaps to the north and south in the inner ring / spiral feature (Fig. 3), which may be artifacts from disc self-subtraction.
3.3 Assessing Self-Subtraction
Significant self-subtraction is apparent in both our ADI and PCA reductions (Fig. 1), and appears somewhat worse in the PCA reduction. Over the course of the observation, the disc rotates 60 degrees on the sky. Given the extent of the disc, no matter how carefully we build our ADI PSF, the final image will still suffer from self-subtraction. Unlike previous HST observations which used reference star subtraction to remove the stellar PSF and reveal the disc, self-subtraction is unavoidable for circumstellar discs with all ADI-based observations but can be calibrated in some cases with careful data reduction. Completely symmetric face-on discs will be entirely subtracted using any ADI-based algorithms, whereas edge-on discs will be minimally affected, and only in their inner regions. For edge on discs, conservative ADI algorithms can prevent most self-subtraction, however, with an inclination of 51∘, the HD 141569 disc is right on the edge of being amenable to ADI reduction. The complex double ring / spiral structure of this disc will also introduce further complications in this case.
Milli et al. 2012 directly consider the case of ADI with the HD 141569 disc. They show that a classical ADI reduction will act like a filtering algorithm, with the following effects: narrowing of disc features along the minor axis and brightening at the ansae (as seen e.g. in HR 4796, Thalmann et al. 2011). Generally for discs with various morphologies, they find that while ADI will affect the flux brightness along the disc, measurements of disc centre position, disc PA, and disc inclination are minimally affected.
Given these considerations, we only qualitatively describe disc morphology in this paper, attempt to identify and point out potential artifacts, and do not measure flux in the disc. We first fit a simple double ring model to the reduced data as a baseline estimate of the disc morphology. We then introduce the double ring model as well as a spiral model into a separate NICI dataset with similar field rotation to determine if we can distinguish between these two scenarios.
3.3.1 Ring Parameter Fitting
As a baseline quantification of the morphology of the disc structure, we fit each apparent ring feature using a Markov Chain Monte Carlo (MCMC) method similar to that used by Wahhaj et al. (2014) for the HR 4796A disc. As we find no significant differences between the imaged morphology in the 1.65 m image vs. the 1.58 m image, we conduct the MCMC fitting only on the 1.65 m image. This model is intended solely as a baseline to understand how self-subtraction may have affected disc structure and to measure some basic morphological properties of the disc.
We model the geometry of each feature as a a circular annulus with mean radius r0 and a gaussian radial brightness profile with width :
| (1) |
with additional parameters including the disc inclination, disc PA, and position of the ring center, for 7 parameters total. While significant azimuthal asymmetries have been found by several authors (Weinberger et al., 1999; Mouillet et al., 2001; Clampin et al., 2003), the details of these asymmetries are too complicated to model analytically and will also be affected by our ADI subtraction. Thus we have chosen this simple model for the moment and accept the fact that the brightness fit for each ring will be incorrect.
We use the AMOEBA algorithm to find an initial best-fit set of parameters. We then use Metropolis-Hastings Markov Chain Monte Carlo methods to evaluate the posterior probabilities for the 7 ring parameters.
Starting from the initial parameter set, we apply a trial jump to a new part of parameter space. The trial jump is drawn randomly from a seven-dimensional Gaussian distribution across all 7 ring parameters with appropriate standard deviations along each dimension. We evaluate the goodness of fit of the trial model using the statistic:
| (2) |
The trial jump is accepted or not according to the Metropolis-Hastings measure and the algorithm is run for 106 steps. For a more in-depth discussion of this method, see Wahhaj et al. (2014).
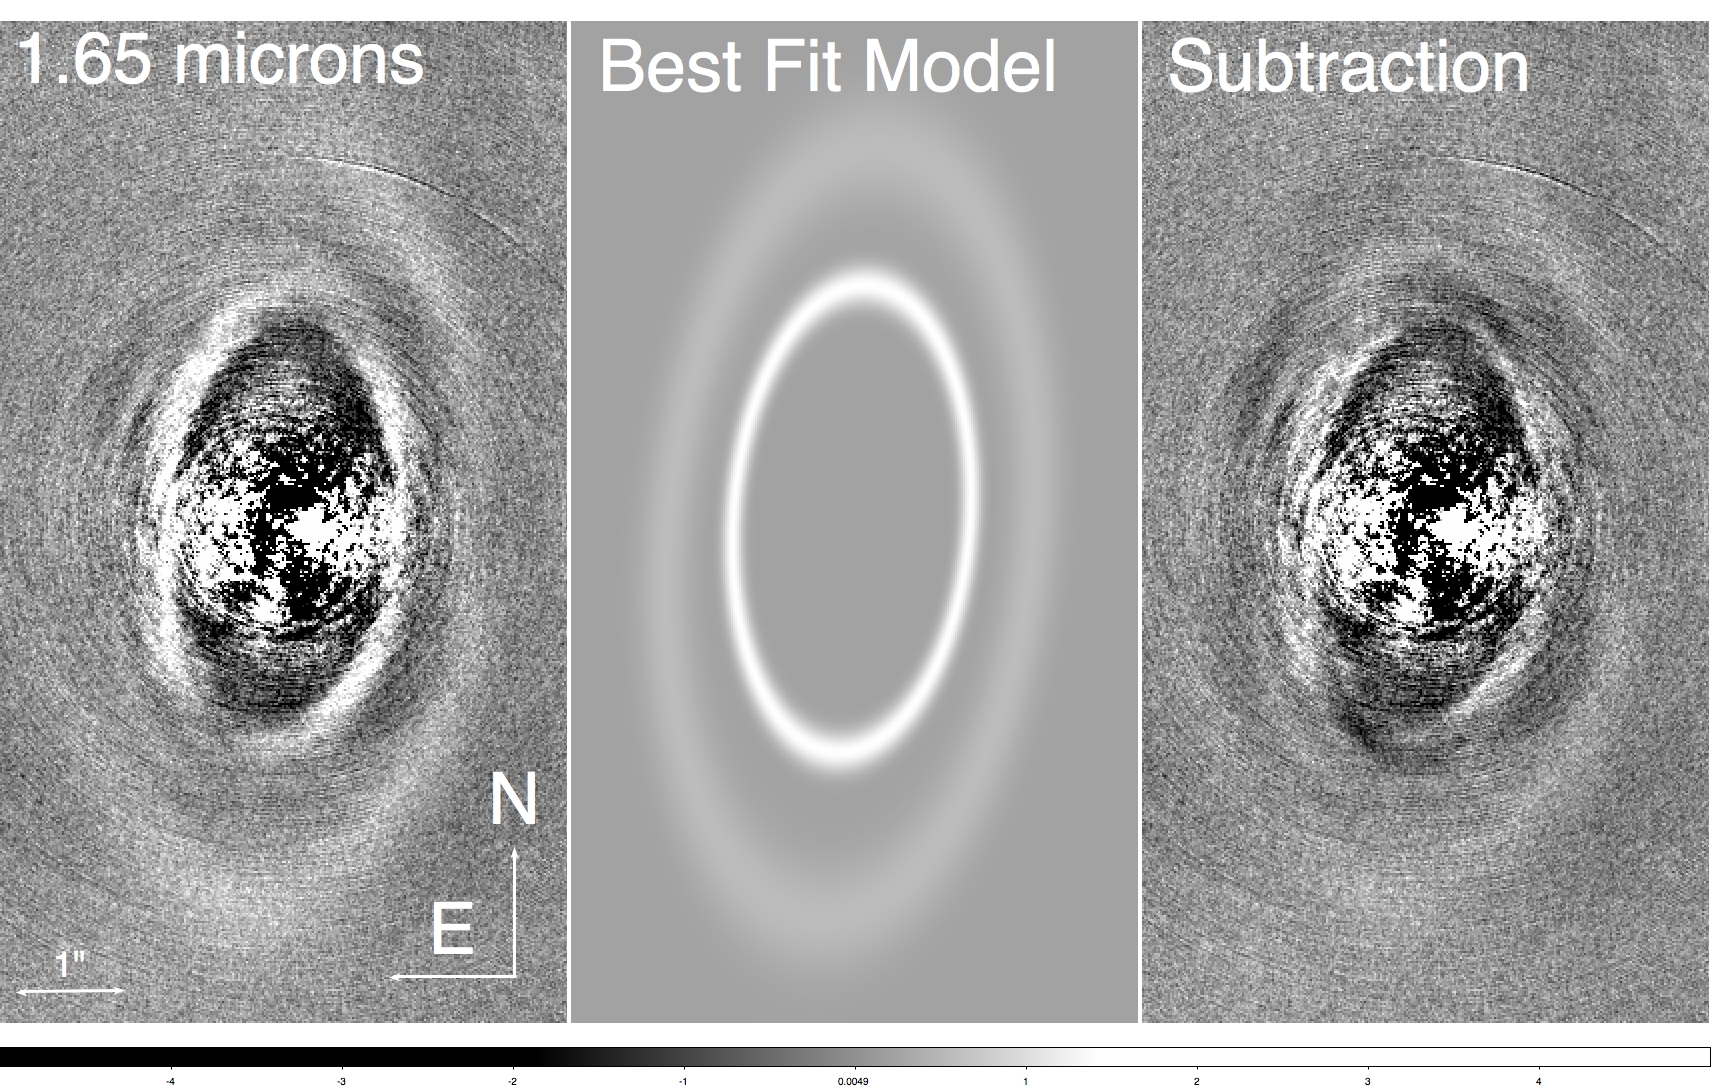
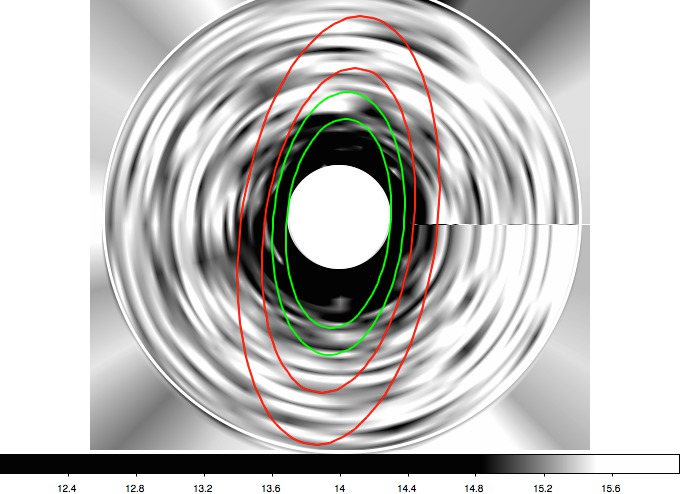
We evaluated the posterior probability distribution functions (henceforth pdfs) for both the inner and outer ring features. Chains were visually inspected to ensure convergence. We also used the Gelman-Rubin (GR) statistic to check for convergence. After throwing out the first 105 steps to account for burn-in, we divided each chain into three 3105 step sub-chains. To calculate the GR statistic, we calculate the variance in each parameter in each sub-chain as well as the total variance across all chains. The GR statistic is then the ratio of the variance in each parameter in individual sub-chains to the total variance for all sub-chains. If the sub-chains are exploring the same (converged) part of parameter space, the GR statistic should be close to 1 and values 1.1 and below indicate convergence. By 3105 steps, all parameters have converged for both rings except for B0, the peak brightness value of the rings. MCMC posterior pdfs are presented in Fig. 5 and 6 and best parameter values, uncertainties, and GR statistic values are presented in Table 2. A subtraction of the “best” models for both inner and outer rings (defined here as the median model from the evaluated posterior pdfs) is presented in Fig. 7.
We can glean several important results from the MCMC fits. First, we recover an offset between the star and the disc center for both rings, similar to Clampin et al. (2003). However, we find that the inner ring is offset by 42 AU from the star center, compared to up to 30 AU found by Clampin et al. (2003). The offset for the outer ring is larger (12 AU), but with considerably larger error bars. Nonetheless, these measured offsets point to possible perturbing companions in this disc. The fact that B0 does not converge is unsurprising – our model assumes uniform azimuthal brightness of both rings, and this is clearly not the case. Thus, while our models roughly fit the morphology of the ring, they fail to fit the photometry. Simple Gaussian ring models are not sufficient to model all features of the disc, but still can yield some insight into basic disc morphology.
3.3.2 Insertion of Model Discs
To enable qualitative forward-modeling of disc structure, we inserted simulated discs into a second NICI dataset with similar target star brightness and field-rotation as the HD 141569 dataset, but with no detected disc or point sources in the field of view. We selected the NICI Campaign dataset of 2MASS J04472312-2750358 (henceforth 2M J0447) taken on 2010-01-10 for this purpose. 2M J0447 has a similar H band magnitude as HD 141569 (H=7.1 vs. H=6.8). The 3122 s dataset was taken with the same filter set as our primary HD 141569 dataset (1.58 m and 1.65 m narrowband filters), with the same 60s base exposure time, and had a similar amount of field rotation as the HD 141569 dataset (58.9∘ for 2M J0447 vs. 58.7∘ for the HD 141569 dataset).
Model discs at arbitrary flux levels were inserted into each raw data frame (with single frame disc position angle given by the parallactic angle at the time of observation). Data with simulated discs added were then reduced using the NICI campaign pipeline described above. We used the mean ring fit parameters from the previous section as a baseline model and then altered its parameters to see if we could better qualitatively reproduce the observed structure.
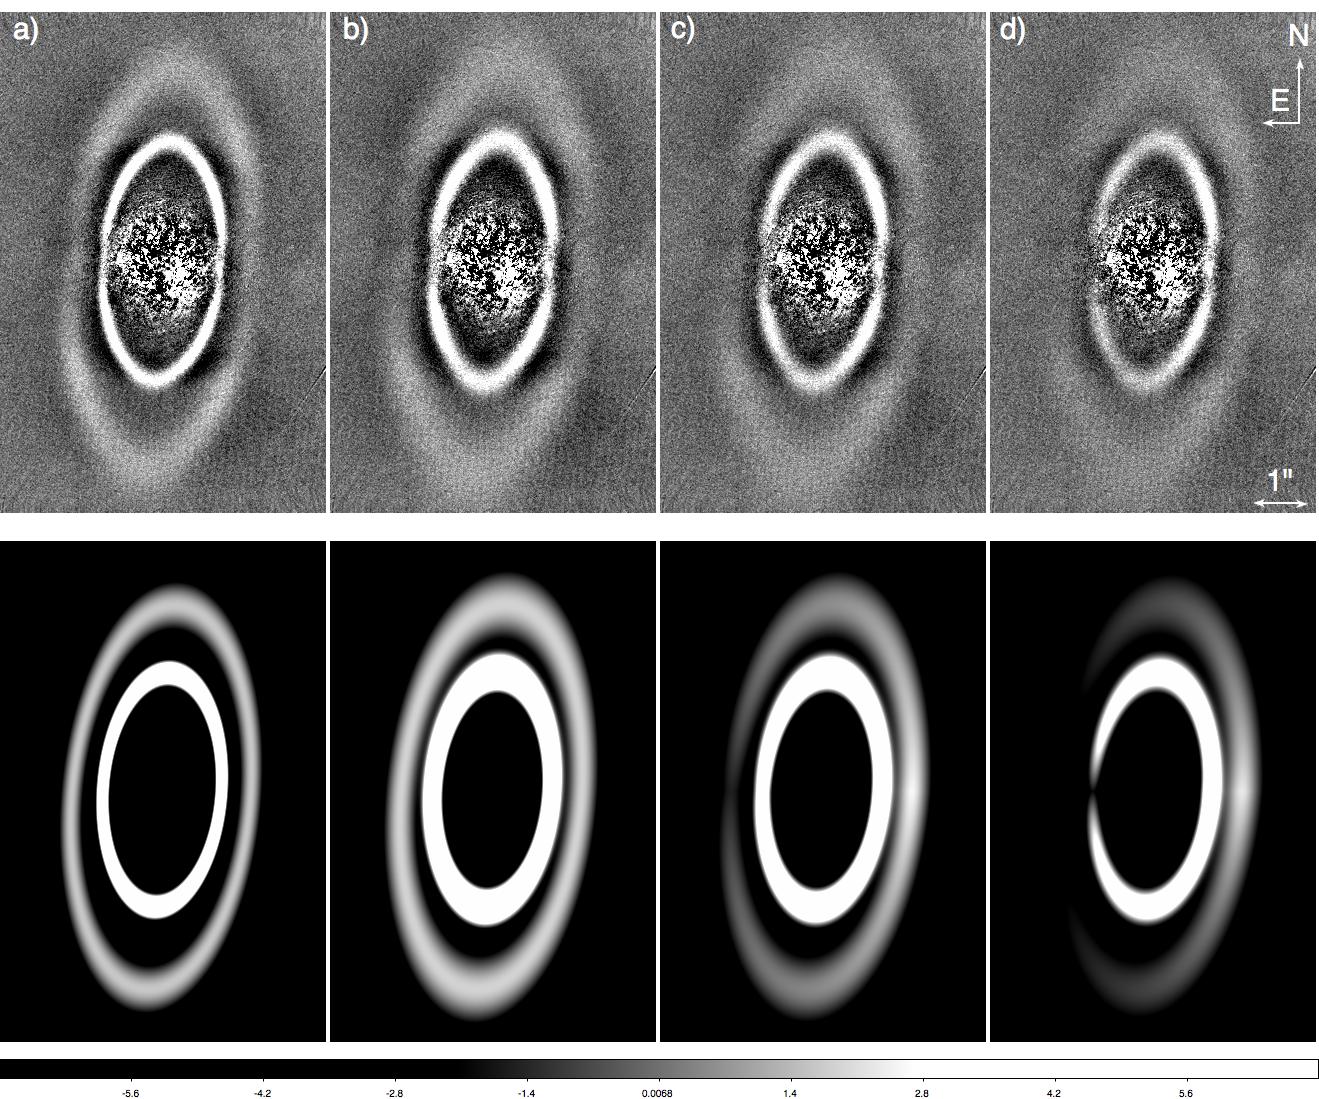
We show results for four simulated discs in Fig. 8. We first consider the mean ring fit parameters from the previous section as a baseline model (henceforth model a). As per Milli et al. 2012, the ADI reduction process alters the features of the disc, acting as a filtering algorithm, causing narrowing of the disc along the the minor axis and a dark self-subtraction region between the two rings. This is clearly seen in the far left side panel of Fig. 8, where the retrieved simulated disc is notably narrower than the original model. To better reproduce the observed disc width, we considered a second model with the MCMC mean ring width parameter increased by a factor of 1.5 (second panel in Fig. 8, henceforth model b). This model replicates the observed width of the HD 141569 better than the narrower model and is adopted for all further simulated discs.
Multiple authors note east / west brightness asymmetries in this disc (Weinberger et al., 1999; Mouillet et al., 2001; Clampin et al., 2003), potentially due to the inclination of the disc from the line of sight. To test how much such asymmetries would be affected by an ADI reduction, we also simulated two cases with a simple ring brightness asymmetry, where ring brightness varies from the initial model as a function of angle , with the west side of the disc along the minor axis as the brightest point and the east side of the disc along the minor axis as the faintest point. We considered two cases here: where the east side of the disc at its faintest is 0.5 as bright as the west side at its brightest (henceforth model c) and where the east side of the disc at its faintest is 0.1 as bright as the west side at its brightest (henceforth model d). After ADI processing, we find that the effects of east / west brightness asymmetries are relatively subtle in the 0.5 case and hard to disentangle from ADI processing artifacts even in this high S/N case.
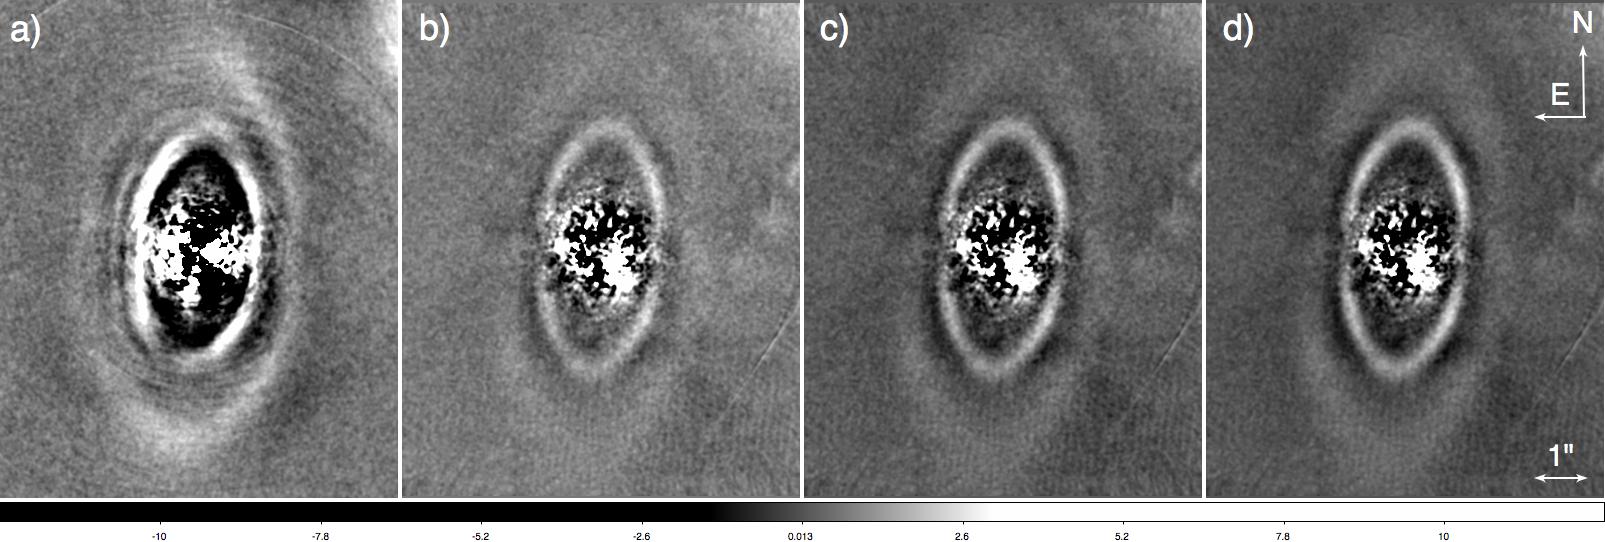
These simulated discs are clearly detected at higher S/N than the actual HD 141569 disc detection. Fig. 9 shows disc model b inserted into the data at S/N ratios more closely matching the actual detection of the HD 141569 disc (best by-eye S/N match in panel c), with the HD 141569 detection shown in the left-hand panel for comparison. Qualitatively, model b broadly replicates some of the features seen in the HD 141569 – specifically the observed double ring feature, with azimuthal asymmetries (potentially due to self-subtraction) around the ring. However, it does not exactly replicate the observed brightness asymmetries in the disc (most notably the northern and southern gaps) nor does it replicate the arc-like feature seen in between the inner and outer rings on the east side of the disc.
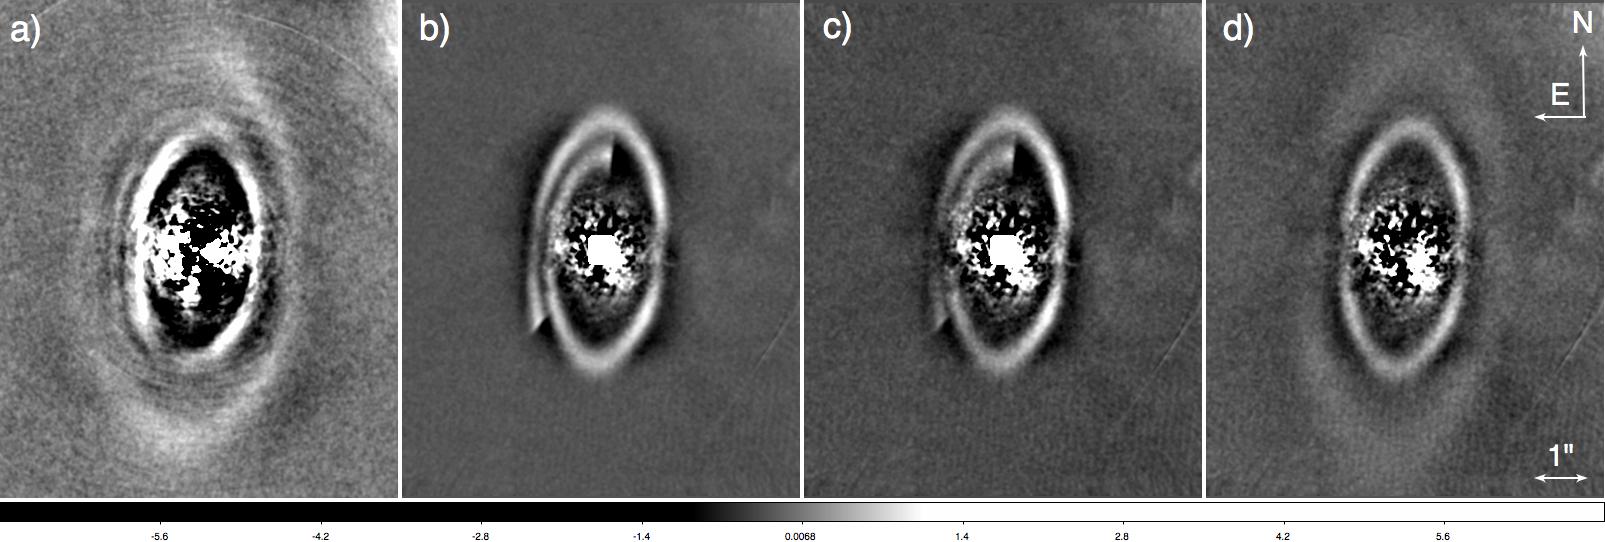
Some authors interpret the inner structures in the HD 141569 discs as potentially due to tightly wound spirals (Clampin et al., 2003). This is a possible explanation for the arc-like feature observed between the inner and outer ring. To determine if a spiral might replicate the observed features of the inner ring better than a gaussian ring model, we also inserted an Archimedean spiral model into the raw 2M 0447 dataset (more appropriate than a logarithmic spiral, considering the apparent tight winding). The width of the spiral feature was set to that of disc model b and then the Archimedean spiral model was qualitatively adjusted to best replicate the inner ring / arc structure. Results are presented in Fig. 10, with the observed HD 141569 disc shown in the left hand panel for comparison. Panel b shows the best match spiral model and panel c shows the same model with a 0.5 brightness asymmetry imposed. Panel d shows a double gaussian ring model for comparison. An Archimedean spiral model with a single peak flux does not recreate the observed disc structure. Although it also fails to account for all disc features, especially the observed azimuthal brightness asymmetries as well as the arc-like feature between the inner and outer spiral / ring features, the double ring model still qualitatively recreates the inner structure better than the Archimedean spiral feature. The reported tightly-wound spiral features are most evident in the Clampin et al. (2003) HST optical imaging. However, as the NICI imaging is at a different wavelength than the high-resolution optical HST imaging, direct comparison is problematic, as an accurate comparison would involve significant multi-wavelength disc modeling. Thus, we focus here on the morphology found in the NICI imaging only.
To build an accurate picture of disc structure in this case, we must detangle three factors: 1) the S/N of detection of various disc features, 2) artifacts inevitably introduced by ADI processing, and 3) intrinsic asymmetries due to e.g. disc inclination and actual physical asymmetries in disc structure. Since we can do so only broadly in the case of HD 141569 (as with an inclination of 51∘, the necessary ADI processing inevitably alters the observed disc structure), we do not interpret disc features in depth.
3.4 Comparison with HST datasets
The differences in features recovered between HST and NICI datasets are likely largely due to differences in sensitivity, resolution, inner working angle, and data processing methods.
During the 2011-05-03 NICI observation, we measure a FWHM of 3.80.2 pixels for the 1.58 m channel and a FWHM of 4.10.2 pixels for the 1.65 m channel. For the 18 mas NICI pixel size, this corresponds to a resolution of 0.07, somewhat above the diffraction limit performance for an 8.2 m telescope at this wavelength (0.05). This is a considerable improvement over the resolution in the HST near-IR imaging of this disc (diffraction limit of 0.12 for a 2.4 m telescope), but does not reach the 0.05 resolution achieved in the optical with HST (Clampin et al., 2003).
The NICI imaging is less sensitive to low-surface brightness features compared to the HST, due to the sky brightness in the near-IR. Since the HD 141569 disc is so large on the sky (4), most of the disc lies outside the speckle noise limited portion of the primary star PSF (corresponding roughly to the inner 0.5 of the image). Thus, sensitivity to faint features does not rely on AO correction but on the intrinsic background brightness. This is the likely reason that we do not recover the faint open spiral features seen in optical HST imaging by Clampin et al. (2003), nor do we recover the lower flux regions seen between the inner and outer ring/spiral features in HST imaging. The deeper “gap” we find between the inner and outer features is a result of disc self-subtraction with ADI processing, similar as is found by Milli et al. 2012.
However, NICI can reach much smaller inner working angles than were reached with the large coronagraphs on HST. Thus, we have the clearest picture of the inner 175 AU of the disk, and can trace the inner ring / spiral feature over its full 360∘ angular extent (although the details of its morphology may have been affected by self-subtraction).
3.5 Limits on Masses of Embedded planets
As our baseline contrast curve, we adopt the 95-completeness contrast curve calculated for this dataset in the NICI campaign debris-disc survey paper (Wahhaj et al., 2013a). The details of the 95%-completeness method are described in the NICI campaign pipeline paper (Wahhaj et al., 2013b). The 95%-completeness technique accounts for self-subtraction losses endemic to ADI and SDI data, unlike simple measurements based solely on the noise level of the data. Briefly, to build the 95% completeness curve, we first rereduce the dataset, but with frames mis-rotated to ensure no positive detections. This allows us to set a robust false-positive threshold – any object “detected” in this reduction must be by definition spurious. We can also determine a nominal 1- contrast curve from this “clean reduction”. The dataset is then rereduced with the correct frame de-rotations and with simulated companions 20 brighter than the 1- contrast curve inserted. The recovered simulated companions are then inserted into the “clean reduction” and scaled in intensity until they meet our detection criteria (set by the false-positive threshold). We adopt the contrast at which 95 of the simulated companions are detected (95 completeness) as the contrast curve for the star.
This method works very well for datasets without detected discs or datasets where the disc has a small angular extent in the field. However, given the extent and complexity of the HD 141569 disc, self-subtraction is inevitable and flux from the disc remains even in a mis-rotated reduction. Thus, to correct for the influence of the disc, we inserted simulated companions into the raw data along different angular trajectories. Simulated companions were inserted every 5 pixels from 45 pixels to 240 pixels (90-500 AU) and every 15 degrees in . At each position, simulated companions were inserted with mag equal to the 95 contrast curve, and also from 0.2 to 1 mag brighter than the 95 contrast curve, with steps of 0.2 mag. Only one simulated companion was inserted per analysis run, to prevent interaction / self-subtraction between adjacent objects. After insertion and re-reduction, simulated companions were automatically retrieved using find.pro from the IDL astronomy library. Significance level of detections were pinned to the 95-completeness curve at wide separations, where the influence of the disc is negligible. A contrast map was produced by linearly interpolating between adjacent curves. Contrast curves and the contrast map are presented in Fig. 11.
We then converted contrast curves to minimum detectable masses using the hot-start COND and DUSTY models of Baraffe et al. (2002, 2003), adopting an age of 5 Myr and a distance of 116 pc. The minimum detectable mass as a function of separation within the disc is plotted in Fig. 12. At a very young age of 5 Myr, any planets forming or recently formed in the inner or outer gap of this disc must have formed in situ via gravitational instability; the system is simply too young for planets forming via core accretion in the inner disc to have had the time to migrate or be scattered to separations 100 AU from the host star. Thus, hot start evolutionary models are the most appropriate models to use in estimating our sensitivity to potential planetary companions. Since it is not clear a companion would be methanated, we consider both the COND (appropriate for methanated companions) and DUSTY (appropriate for non-methanated companions) models and do not consider the SDI reduction for this dataset, as a non-methanated companion close in would be considerably self-subtracted. From separations of 200 AU outwards, we can rule out planets with mass 3 MJup.
4 Discussion
Numerous modeling efforts have qualitatively reproduced some of the features in the HD 141569A disc. Flyby scenarios or encounters with wide bound companions may be responsible for some of the outer spiral structure seen in this disc (Augereau & Papaloizou, 2004; Quillen et al., 2005; Ardila et al., 2005; Reche et al., 2009), but cannot account for the inner gap or spiral features. The inner features may be due to secular perturbations from a planet on an eccentric orbit Wyatt (2005). Modeling approaches that combine the effects of a fly-by event and one or more embedded planets (Ardila et al., 2005; Reche et al., 2009), have generally been able to reproduce the spiral structures seen with one planet and a fly-by, but both struggle to reproduce the gap between the inner and outer spiral / ring structures. None of these modeling approaches take into account the brightness asymmetries found by multiple authors (Weinberger et al., 1999; Mouillet et al., 2001; Clampin et al., 2003).
The inner ring / spiral feature is suggestive of the material being constrained by two planets, one inside its orbit, and one outside, similar to the shepherd moons observed in Saturns rings (Goldreich & Tremaine, 1982). To investigate this scenario we ran a suite of N- body plus test particle simulations with one planet located at r = 160 AU (where it would be in approximate 2:1 resonance with the inner edge of the inner ring) and the other at r = 416 AU. It is then assumed that there is a disc of small test-particles that extend from r = 130 AU to r = 460 AU. We consider 3 cases: both planets having masses of 2 Jupiter masses and both having no eccentricity, both planets having masses of 2 Jupiter masses, with the outer planet having an eccentricity of 0.1, and then a repeat of the first simulation (no eccentricity) but with a simple drag force imposed. We chose a planet mass of 2 Jupiter masses to simulate, as such a planet might have been missed with the contrast available with NICI.
Each simulation was run for 2.5 Myr, a reasonable timescale for planet-formation given the 5 Myr age of the star. The results are shown in Figure 13. It’s clear that the influence of these planets can produce a relatively narrow ring with a peak in flux at around AU and that this ring can have some structure. When the eccentricities are zero, however, the structure is symmetric. Increasing the eccentricity of the outer planet (middle panel) can introduce an asymmetry in the inner ring which is more consistent with what is observed in HD141569. Additionally, the outer ring appears similar to, for example, Jupiter’s Trojan asteroids (Morbidelli et al., 2005) which follow the same orbit, but librate around the and Lagrangian points.
The right panel illustrates the impact of a weak drag force due to the presence of some residual gas. A drag force could influence the collection of particles at the outer planet’s Lagrange points (Chanut et al., 2003) and could act to damp the particles’ eccentricities and inclinations, leading to accelerated grain growth (Peale, 1993) Although we have not done an extensive study of the influence of gas drag, the bottom right panel in Figure 13 suggests that a weak drag force does not significantly change the basic structure, but might act to sharpen the features in the particle disc, which is broadly consistent with suggestions in Peale (1993).
We should be clear, however, that the goal is not to exactly match the properties of the rings in HD141569, and we clearly have not done so. These simulations are simply intended to be illustrative and do suggest that these rings may be indicative of the presence of two low-mass planets ( 2 MJup), one at about r = 150 AU, and the other at about r = 400 AU. We also show that including a weak drag force does not significantly influence this basic conclusion, but could act to sharpen some of the features in the particle disc. This may be relevant given that the disc is thought to still have between 67 and 164 M⊕ of gas (Thi et al., 2014).
5 Conclusions
Our NICI imaging recovers four key morphological features in the HD 141569 disc at higher near-IR resolution and with a better inner working angle than ever before: 1) an inner ring / spiral feature. Once deprojected, this feature does not appear circular, 2) an outer ring / spiral which is considerably brighter on the western side compared to the eastern side Weinberger et al. (1999); Clampin et al. (2003), 3) an additional arc-like feature between the inner and outer ring only evident on the east side of the image, which may be part of the tight spiral structure claimed by Clampin et al. (2003). In the deprojected image, this feature completes the circle of the west side inner ring, and 4) an evacuated cavity within 175 AU. Additionally, we find an offset of 4 AU between the inner ring center and the stellar position, possibly hinting at the presence of unseen companions. We can recreate some but not all of the structure from N-body simulations with two embedded planets and argue that the asymmetries in the outer ring may trace an extrasolar analgue to the Trojan asteroids seen in our old solar system. Indeed, in 3-d modeling of a number of other debris discs, Nesvold & Kuchner (2015) find that such features should be common in debris discs with no planet migration and planets on circular orbits.
Acknowledgments
Based on observations obtained at the Gemini Observatory, which is operated by the Association of Universities for Research in Astronomy, Inc., under a cooperative agreement with the NSF on behalf of the Gemini partnership: the National Science Foundation (United States), the National Research Council (Canada), CONICYT (Chile), the Australian Research Council (Australia), Ministério da Ciência, Tecnologia e Inovação (Brazil) and Ministerio de Ciencia, Tecnología e Innovación Productiva (Argentina). B.A.B. was supported by Hubble Fellowship grant HST-HF-01204.01-A awarded by the Space Telescope Science Institute, which is operated by AURA for NASA, under contract NAS 5- 26555. This work was supported in part by NSF grants AST- 0713881 and AST- 0709484 awarded to M. Liu, NASA Origins grant NNX11 AC31G awarded to M. Liu, and NSF grant AAG-1109114 awarded to L. Close. We thank Alycia Weinberger for providing reduced HST NICMOS images for comparison with the NICI images and the anonymous referee for useful suggestions which helped improve the manuscript.
References
- Ardila et al. (2005) Ardila, D. R., Lubow, S. H., Golimowski, D. A., et al. 2005, ApJ, 627, 986
- Amara & Quanz (2012) Amara, A., & Quanz, S. P. 2012, MNRAS, 427, 948
- Augereau et al. (1999) Augereau, J. C., Lagrange, A. M., Mouillet, D., & Ménard, F. 1999, A&A, 350, L51
- Augereau & Papaloizou (2004) Augereau, J. C., & Papaloizou, J. C. B. 2004, A&A, 414, 1153
- Biller et al. (2007) Biller, B. A., Close, L. M., Masciadri, E., et al. 2007, ApJS, 173, 143
- Biller et al. (2013) Biller, B. A., Liu, M. C., Wahhaj, Z., et al. 2013, ApJ, 777, 160
- Baraffe et al. (2002) Baraffe, I., Chabrier, G., Allard, F., & Hauschildt, P. H. 2002, A&A, 382, 563
- Baraffe et al. (2003) Baraffe, I., Chabrier, G., Barman, T. S., Allard, F., & Hauschildt, P. H. 2003, A&A, 402, 701
- Boccaletti et al. (2003) Boccaletti, A., Augereau, J.-C., Marchis, F., & Hahn, J. 2003, ApJ, 585, 494
- Chanut et al. (2003) Chanut T., Winter O.C., Tsuchida M., 2008, A & A, 481, 519-527
- Chun et al. (2008) Chun, M., Toomey, D., Wahhaj, Z., et al. 2008, Proc. SPIE, 7015, 70151V
- Clampin et al. (2003) Clampin, M., Krist, J. E., Ardila, D. R., et al. 2003, AJ, 126, 385
- Goldreich & Tremaine (1982) Goldreich P., Tremaine S., 1982, ARA&A, 20, 249
- Lafrenière et al. (2007a) Lafrenière, D., Marois, C., Doyon, R., Nadeau, D., & Artigau, É. 2007, ApJ, 660, 770
- Liu (2004) Liu, M. C. 2004, Science, 305, 1442
- Liu et al. (2010) Liu, M. C., Wahhaj, Z., Biller, B. A., et al. 2010, Proc. SPIE, 7736,
- Lyra & Kuchner (2013) Lyra, W., & Kuchner, M. 2013, Nature, 499, 184
- Marois et al. (2005) Marois, C., Doyon, R., Nadeau, D., et al. 2005, PASP, 117, 745
- Marois et al. (2006) Marois, C., Lafrenière, D., Doyon, R., Macintosh, B., & Nadeau, D. 2006, ApJ, 641, 556
- Merín et al. (2004) Merín, B., Montesinos, B., Eiroa, C., et al. 2004, A&A, 419, 301
- Milli et al. (2012) Milli, J., Mouillet, D., Lagrange, A.-M., et al. 2012, A&A, 545, AA111
- Morbidelli et al. (2005) Morbidelli A., Levison H.F., Tiganis K., Gomes R., 2005, Nature, 7041, 462
- Mouillet et al. (2001) Mouillet, D., Lagrange, A. M., Augereau, J. C., & Ménard, F. 2001, A&A, 372, L61
- Nesvold & Kuchner (2015) Nesvold, E. R., & Kuchner, M. J. 2015, ApJ, 798, 83
- Nielsen et al. (2013) Nielsen, E. L., Liu, M. C., Wahhaj, Z., et al. 2013, ApJ, 776, 4
- Nielsen et al. (2014) Nielsen, E. L., Liu, M. C., Wahhaj, Z., et al. 2014, arXiv:1403.7195
- Peale (1993) Peale S.J., 1993, Icarus, 106, 308-322
- Quillen et al. (2005) Quillen, A. C., Varnière, P., Minchev, I., & Frank, A. 2005, AJ, 129, 2481
- Racine et al. (1999) Racine, R., Walker, G. A. H., Nadeau, D., Doyon, R., & Marois, C. 1999, PASP, 111, 587
- Reche et al. (2009) Reche, R., Beust, H., & Augereau, J.-C. 2009, A&A, 493, 661
- Soummer et al. (2012) Soummer, R., Pueyo, L., & Larkin, J. 2012, ApJ letters, 755, LL28
- Takeuchi & Artymowicz (2001) Takeuchi, T., & Artymowicz, P. 2001, ApJ, 557, 990
- Thalmann et al. (2011) Thalmann, C., Janson, M., Buenzli, E., et al. 2011, ApJ letters, 743, L6
- Thi et al. (2014) Thi W.-F., et al., 2014, A & A, 561, id.A50
- van Leeuwen (2007) van Leeuwen, F. 2007, A&A, 474, 653
- Wahhaj et al. (2013a) Wahhaj, Z., Liu, M. C., Nielsen, E. L., et al. 2013, ApJ, 773, 179
- Wahhaj et al. (2013b) Wahhaj, Z., Liu, M. C., Biller, B. A., et al. 2013, ApJ, 779, 80
- Wahhaj et al. (2014) Wahhaj, Z., Liu, M. C., Biller, B. A., et al. 2014, arXiv:1404.6525
- Weinberger et al. (1999) Weinberger, A. J., Becklin, E. E., Schneider, G., et al. 1999, ApJl, 525, L53
- Weinberger et al. (2000) Weinberger, A. J., Rich, R. M., Becklin, E. E., Zuckerman, B., & Matthews, K. 2000, ApJ, 544, 937
- Wyatt (2005) Wyatt, M. C. 2005, A&A, 440, 937
| Date | Mode | Number of Images | Total Exp. Time | Total Rotation |
|---|---|---|---|---|
| (s) | (degrees) | |||
| 2009 Mar 7 | ADI | 20 | 1208 | 10.6 |
| 2009 Mar 7 | ASDI | 65 | 3902 | 25.1 |
| 2010 Apr 8 | ASDI | 45 | 2701 | 23.6 |
| 2011 May 3 | ASDI | 114 | 6844 | 58.7 |
| Inner Ring | ||||
|---|---|---|---|---|
| Parameter | Mean | Median | RMS | GR statistic |
| X offset (pixels) | -1.2 | -1.1 | 0.4 | 1.03 |
| Y offset (pixels) | 1.5 | 1.5 | 1.0 | 1.01 |
| X offset (AU) | -2.5 | -2.3 | 0.8 | 1.03 |
| Y offset (AU) | 3.1 | 3.1 | 2.1 | 1.01 |
| PA (degrees) | -8.9 | -8.9 | 1.3 | 1.01 |
| inclination (degrees) | 44.9 | 44.9 | 0.48 | 1.02 |
| B0 | 1.1 | 1.1 | 0.09 | 1.11 |
| r0 (pixels) | 117.5 | 117.5 | 1.4 | 1.01 |
| r0 (AU) | 245 | 245 | 3.0 | 1.01 |
| (pixels) | 7.0 | 7.0 | 0.55 | 1.02 |
| (AU) | 14.6 | 14.6 | 1.1 | 1.02 |
| Outer Ring | ||||
| Parameter | Mean | Median | RMS | GR statistic |
| X offset (pixels) | -2.3 | -1.8 | 7.1 | 1.007 |
| Y offset (pixels) | -5.4 | -5.4 | 8.3 | 1.006 |
| X offset (AU) | -4.8 | -3.8 | 14.8 | 1.007 |
| Y offset (AU) | -11.3 | -11.3 | 17.3 | 1.006 |
| PA (degrees) | -11.3 | -11.0 | 6.1 | 1.008 |
| inclination (degrees) | 47.3 | 47.0 | 3.3 | 1.016 |
| B0 | 0.3 | 0.3 | 0.08 | 1.480 |
| r0 (pixels) | 194.5 | 194.6 | 6.4 | 1.008 |
| r0 (AU) | 406 | 406 | 13.3 | 1.008 |
| (pixels) | 21.1 | 19.9 | 5.8 | 1.009 |
 |
 |
 |
 |
 |
 |
 |
 |
 |
 |
 |
 |
 |
 |
 |
 |
 |
 |
 |
 |
 |