PHENIX Collaboration
Systematic study of charged-pion and kaon femtoscopy in AuAu collisions at =200 GeV
Abstract
We present a systematic study of charged pion and kaon interferometry in AuAu collisions at =200 GeV. The kaon mean source radii are found to be larger than pion radii in the outward and longitudinal directions for the same transverse mass; this difference increases for more central collisions. The azimuthal-angle dependence of the radii was measured with respect to the second-order event plane and similar oscillations of the source radii were found for pions and kaons. Hydrodynamic models qualitatively describe the similar oscillations of the mean source radii for pions and kaons, but they do not fully describe the transverse-mass dependence of the oscillations.
pacs:
25.75.DwI Introduction
Measurements of the quark-gluon plasma (QGP), produced in nucleus-nucleus collisions at the Relativistic Heavy Ion Collider (RHIC) Adcox et al. (2005); Adams et al. (2005a); Back et al. (2005); Arsene et al. (2005) and the Large Hadron Collider (LHC) Aamodt et al. (2011); Chatrchyan et al. (2011); Aad et al. (2010), showed that the QGP exhibits rapid hydrodynamic expansion, followed by hadronization, which results in the emission of many particles. The time of last scattering among hadrons is referred to as kinetic freeze out. To understand the dynamics and properties of the QGP, it is important to understand the full system evolution and how it is constrained by the measurements of the space-time distribution at kinetic freeze out.
The quantum statistical interferometry of identical particles, also known as Hanbury Brown Twiss (HBT) interferometry or femtoscopy, is a powerful tool to measure the spatial and temporal scales of systems created in nucleus-nucleus collisions Zajc et al. (1984); Lisa et al. (2005). This technique was first developed to measure the angular diameter of stars through intensity interferometry of radio waves Brown and Twiss (1956). It has also been applied to nuclear and particle physics Goldhaber et al. (1960). In nucleus-nucleus collisions, the interferometry using emitted hadrons measures the spatial extent of the particle-emitting source at the time of kinetic freeze out.
Despite the successful description of various observables at RHIC by the hydrodynamic models Adcox et al. (2005); Adams et al. (2005a), there was significant discrepancy between HBT data and theoretical models Adler et al. (2004a); Adams et al. (2005a). Recent theoretical development has improved the agreement by including realistic physics conditions such as stiffer equation of state and a viscosity of the created matter Pratt (2009).
Charged pions are often used for the interferometry analysis because of their abundant production, but recently acquired large data sets by RHIC and LHC experiments allow study of the particle-species dependence Afanasiev et al. (2009a); Adamczyk et al. (2013); Szymanski et al. (2013). Kaon interferometry is of particular interest, because the contribution from resonance decays is reduced compared to pions Sullivan et al. (1994, 1993), thereby providing a more direct view of the particle-emitting source. PHENIX at RHIC published an analysis of one-dimensional source imaging for charged kaons Afanasiev et al. (2009a). STAR at RHIC has recently published three-dimensional source imaging Adamczyk et al. (2013), where charged kaons lack the nonGaussian tail in the source function observed in the pion sample. This result may be caused by the reduced contribution from long-lived resonances as well as a different time dependence due to a shorter rescattering phase. Further systematic studies using different particle species are needed to better constrain the space-time evolution and freeze-out distributions of the created medium.
The HBT measurement is also sensitive to the initial spatial anisotropy and the subsequent evolution of the created matter. Due to the strong collective expansion, one might expect the eccentricity of the source shape in the initial state to be reduced at freeze out and possibly to be reversed if the collective expansion is stronger in the direction of the reaction plane, or if the expansion time is sufficiently long. To probe the spatial source anisotropy at freeze out, HBT measurements with respect to the event planes have been performed using two-pion correlation Lisa et al. (2000); Adamov’a et al. (2008); Adams et al. (2004); Adare et al. (2014). Large oscillations of the pion source radii relative to the second-order event plane were observed, which indicates that the pion source at freeze out is elongated in the direction perpendicular to the event plane even after the collective expansion.
In this paper, we present azimuthal-integrated and azimuthal-dependent source radii for charged pions and kaons in AuAu collisions at = 200 GeV. Results are compared with the hydrodynamic models for both particle species.
II Experiment
The PHENIX experiment Adcox et al. (2003) is designed to measure particles produced in nucleus-nucleus collisions with good momentum resolution, including photons, electrons, muons, and hadrons, to study properties of the QGP. The PHENIX detectors are comprised of magnet systems and detectors for particle tracking and identification, event timing, plus vertex position and centrality determination. The particle tracking and identification detectors are arranged into central and forward (muon) arms. Figure 1 shows the layout of the PHENIX detector during the 2007 running period.
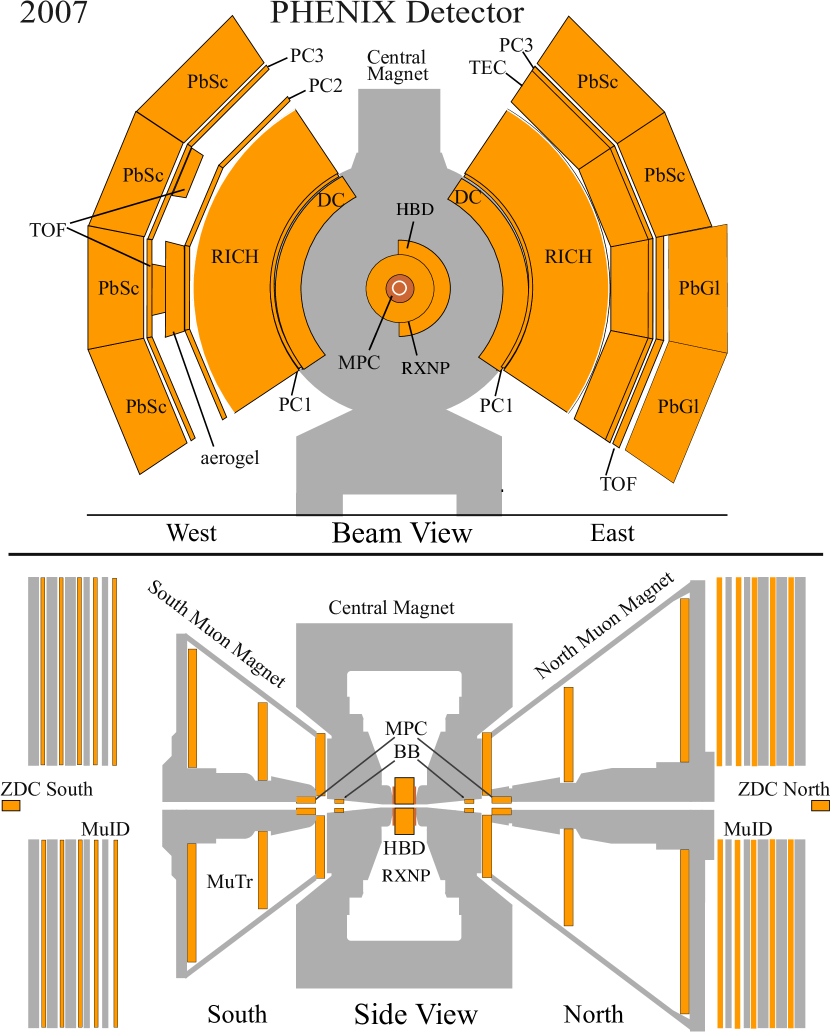
Global detectors characterize the global event characteristics in heavy ion collisions. The beam-beam counters (BBC) Allen et al. (2003) measure the collision time, and the position of the collision vertex along the beam axis, as well as the collision centrality. The BBC comprises two identical sets of counters located 144 cm from the nominal collision point and surrounds the beam pipe covering the pseudorapidity range of . Each BBC has 64 modules of Čerenkov radiators, and measures the number of charged particles in its acceptance. The zero-degree calorimeters are located 18 m from the nominal collision point and measure the energy of spectator neutrons. The reaction-plane detector (RXNP) Richardson et al. (2011) was installed prior to the 2007 RHIC run to measure the event-plane angle in heavy ion collisions. The RXNP comprises two sets of 24 scintillators on both north and south sides, and is located 39 cm from the vertex position. The scintillators are arranged around the beam pipe in two concentric rings of 12 segments in the azimuthal direction. The outer and inner rings cover pseudorapidity ranges of and , respectively.
The PHENIX central arms comprise two sets of detectors located on the west and east sides of the beam axis. Each arm covers 90∘ in azimuth and a pseudorapidity range of . Track and momentum reconstructions of charged particles were performed with the drift chambers (DC) and pad chambers (PC). The DC are located at a radial distance of 2.02 m to 2.46 m from the beam axis in the west and east arms, covering 2 m length along the beam axis. The PC are multi-wire proportional chambers in each of the central arms, and are located at radial distances of 2.5 m (PC1) and 4.9 m (PC3). The tracks and momenta were reconstructed by combining the hit information in the DC and PC1, providing a momentum resolution of GeV/ Adare et al. (2012). Global-track reconstruction was performed by associating these tracks with hits in the outer detectors, such as PC3 and the lead-scintillator (PbSc) electromagnetic calorimeters, as shown in Fig. 1. Particle identification is provided by the PbSc Aphecetche et al. (2003), which is a sampling calorimeter with a timing resolution of about 500 ps Adare et al. (2012) located at a radial distance of 5.1 m from the beam axis.
III Data Analysis
The = 200 GeV AuAu collision data were collected by PHENIX during the 2007 running period. A total of 4.2 billion events were used for this analysis, where the minimum bias trigger with at least two hits in each BBC was required. This trigger measures 923% of the total inelastic cross section Adare et al. (2013). Additional offline requirements of one zero-degree-calorimeter hit on each side and a collision vertex position of less than 30 cm were applied.
III.1 Track Selection
Charged tracks with good quality were selected based on the track information from the DC and PC1. To reduce the background due to the random association of hits and reconstructed tracks, track residuals were required to be less than 2 in the plane at the PC3 and PbSc for pions. For kaons, this cut was relaxed to 2.5 to increase statistics. The fraction of the random background is 4.6% after the 2 cuts and 5.3% after the 2.5 cuts at =0.5 GeV/ in the 0%–10% most central collisions. The effect of the track quality cuts was included in the systematic uncertainty.
III.2 Particle Identification
Particle identification was performed by combining time-of-flight data from the PbSc in the west arm, the reconstructed momentum, and flight path length from the collision vertex to the hit position at the PbSc wall. The squared mass of the particles is given by the following formula:
| (1) |
where is the momentum, is the time-of-flight, is the flight path length, and is the speed of light. Pions and kaons were selected from a 2 window around their peaks in the squared mass distribution. Additional requirements, i.e. to be away from the mass peak of other particles, were applied to reduce contamination. The / separation was achieved up to a momentum of 1 GeV/. Contamination in the pion samples from kaons is below 1% for GeV/ and contamination in the kaon samples from pions (protons) is below 4% (1%) for GeV/.
III.3 Construction of the Correlation Function
In this section, a bold character denotes four-dimensional vector and an arrow denotes three-dimensional vector.
The experimental correlation function defined as
| (2) |
was measured as a function of the pair momentum difference , where and are constructed from identical particle pairs from the same event and mixed-event respectively. The mixed-events are taken from similar event centralities and vertex positions. In the case of azimuthal-dependent analysis, the mixed-events are also required to have similar values for the second-order event plane defined in Sec.III.4.
Particle pairs with similar momenta and spatially close to each other are affected by incorrect track reconstruction and detector inefficiencies. These effects were removed by applying pair selection cuts at the DC and PbSc following our previous analysis Adare et al. (2014); Afanasiev et al. (2009a). In addition, pairs that are associated with hits on the same tower of the PbSc were removed.
The particle pairs were analyzed with the Bertsch-Pratt parameterization Pratt (1986); Bertsch et al. (1988) as functions of the pair momentum difference and mean pair momentum , where . The is projected into its longitudinal component and transverse component . The is projected into the longitudinal (), outward (), and sidewards () components, where denotes the beam direction, is perpendicular to , and is perpendicular to both and . In this frame, the energy (temporal) component of the four-dimensional vector is taken in the outward component by performing the analysis in the longitudinal co-moving system, where .
The function is divided into two components based on the core-halo picture in which the parameter controls the relative strength of the core and the halo.
| (3) | |||
| (4) |
The is the Coulomb correction factor evaluated by the Coulomb wave function Bowler (1991); Sinyukov et al. (1998), where is the scalar quantity of . The central core contributes to the quantum statistical interference. The halo includes the decay of long-lived particles for which the quantum statistical interference occurs in a range that is too small to be resolved experimentally, and for which the Coulomb interaction is negligible. The core is assumed to be a Gaussian source as given by Eq. (4).
The HBT radii denoted by , , and represent the spatial extent of the emission region in each direction, but and to a lesser extent and include a contribution from the emission duration. All radii are sensitive to position-momentum correlations. The term arises in the case of azimuthal-dependent analysis due to asymmetries in the emission region Lisa et al. (2005), while it vanishes in the azimuthal-integrated analysis.
The HBT radii were measured as a function of and presented as a function of the transverse mass to study particle-species dependence, where is the particle mass.
III.4 Event Plane Dependence
The second-order event-plane angle () was determined using the RXNP detector based on the azimuthal anisotropy of emitted particles in momentum space:
| (5) | |||||
| (6) | |||||
| (7) |
where is the azimuthal angle of each segment in the RXNP and is the weight which reflects the particle multiplicity in that segment. Corrections for detector acceptance as detailed in Ref. Afanasiev et al. (2009b) were applied.
Due to the finite number of particles within the RXNP acceptance, the observed event plane is smeared around the true event plane . This smearing effect is typically accounted for by the resolution. The event plane resolution defined as was estimated by the two-subevent method Poskanzer and Voloshin (1998) using the event plane correlation between the RXNP at forward and backward angles. The has a maximum of 0.75 in midcentral events Adare et al. (2012).
The finite event plane resolution reduces the oscillation amplitude of HBT radii relative to the event plane. To take this effect into account, a model-independent correction suggested in Ref. Retière and Lisa (2004) was applied. The pair distribution measured at a certain azimuthal angle relative to the reconstructed event plane, , is smeared by the finite event plane resolution and finite width of angular bins . The Fourier coefficients for the true and measured , , can be associated with the following relation:
where denotes sine and cosine terms of the Fourier coefficients () and denotes the order of the coefficient. The above equation is analogous to the correction for the elliptic flow (). Based on Eq. (III.4), the and functions can be unfolded by using the following equation:
where is the number of azimuthal angular bins, and is the order of the event plane, and denotes the center of angular bin which corresponds to the azimuthal angle of the pair with respect to the event plane. , , and are given by
| (10) | |||||
| (11) | |||||
| (12) |
The details of Eqs. (III.4)–(12) can be found in Ref. Retière and Lisa (2004).
III.5 Systematic Uncertainties
Systematic uncertainties were estimated by variations of track quality cuts at PC3 and PbSc, pair selection cuts, and particle identification (PID) cuts. Also, the effect of the Coulomb correction was studied by varying the input source size in the calculation of in Eq. (3). Typical systematic uncertainties of the measured radii for charged pions and kaons are listed in Table 1 and Table 2.
In the azimuthal-dependent analysis, the variations when using different event planes from forward, backward, and both combined RXNPs, were also incorporated. The systematic uncertainties of the oscillation amplitudes of HBT radii were dominated by the event plane determination, which were 16% on average in the final eccentricity defined by the oscillation of and the same fraction of the uncertainty was assumed for pions and kaons.
| systematic source | ||||
|---|---|---|---|---|
| [%] | [%] | [%] | ||
| track quality | 1.8 | 0.3 | 0.5 | 3.1 |
| pair selection | 4.3 | 1.0 | 4.6 | 3.7 |
| Particle ID | 0.4 | 0.3 | 1.3 | 0.0 |
| Coulomb | 0.4 | 0.1 | 0.3 | 0.1 |
| Total | 4.7 | 1.1 | 4.8 | 4.8 |
| systematic source | ||||
|---|---|---|---|---|
| [%] | [%] | [%] | ||
| track quality | 5.1 | 2.2 | 1.9 | 2.2 |
| pair selection | 9.0 | 1.5 | 0.1 | 1.9 |
| Particle ID | 6.1 | 0.3 | 4.5 | 0.1 |
| Coulomb | 4.6 | 0.3 | 1.1 | 0.2 |
| Total | 12.9 | 2.7 | 5.0 | 2.9 |
The effect of momentum resolution was studied employing the same method as previous analyses Alt et al. (2008); Adams et al. (2005b). The momentum was smeared according to the known momentum resolution and the correlation function was reconstructed using the smeared ) and ) functions. By taking the ratio of the smeared and unsmeared correlation function, the correction factor was obtained. The correction on the momentum resolution was performed by multiplying the correction factor to the measured correlation function. The correction did not affect and , but slightly increased (10%) and (6%).
IV Results and Discussion
IV.1 Azimuthal-integrated analysis
Figure 2(a-c) shows an example of correlation functions of pion pairs and kaon pairs in 0%–10% centrality in a bin with fit lines given by Eq. (3), where the momentum correction is not applied. The range is selected to have similar for pions and kaons. The 3-dimensional and functions are projected in each direction. In the projection, the other are restricted to be less than 40 MeV/ (e.g. when making , the projection ranges of and should be 40 MeV and 40 MeV). The 1D correlation functions shown in Fig. 2 are obtained by taking ratio of the projected and functions. The extracted HBT radii with the statistical uncertainties are also shown in each panel. The width of the enhancement at the low region in the correlation function is proportional to the inverse of the HBT radius. The width of the correlation function is comparable between pions and kaons in the sidewards direction, but narrower for kaons in the outward and longitudinal directions, indicating a larger radius in those directions than for pions with a similar mean . We note that the data points at lower q bins fluctuate due to lower statistics. The effect of the fluctuation on the radii was studied by varying the fit range and it was found to be within a few percent for both pions and kaons.
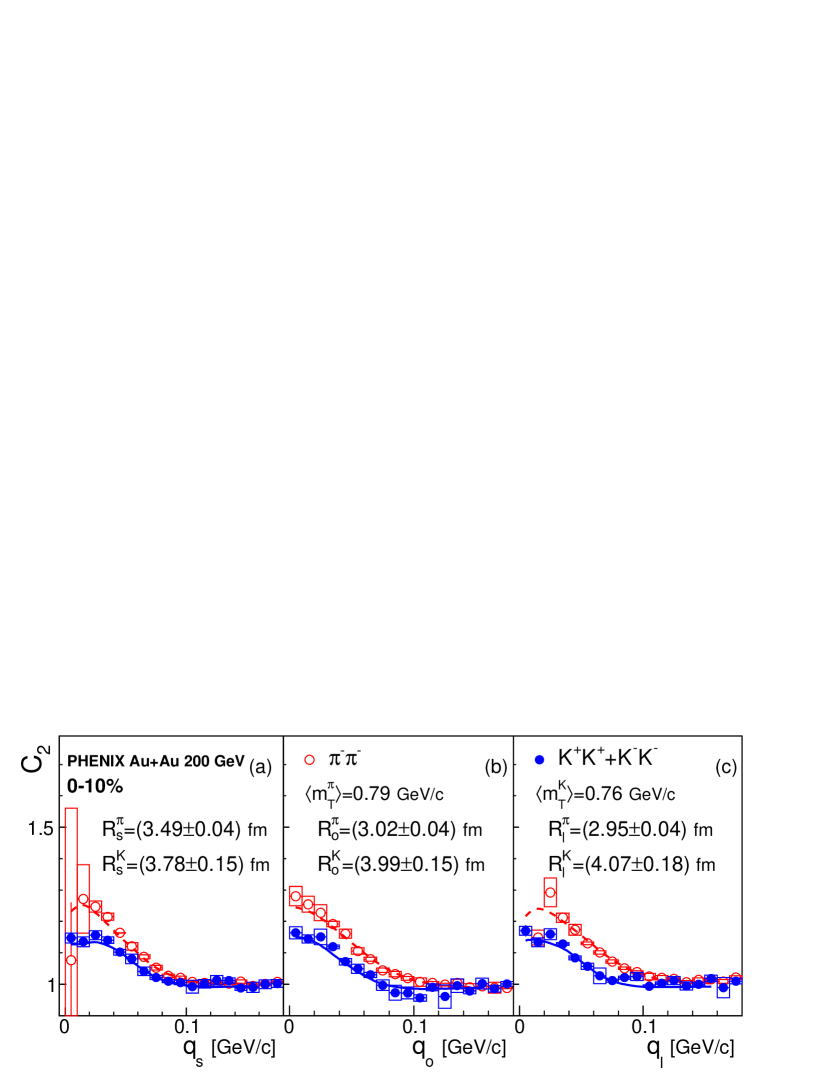
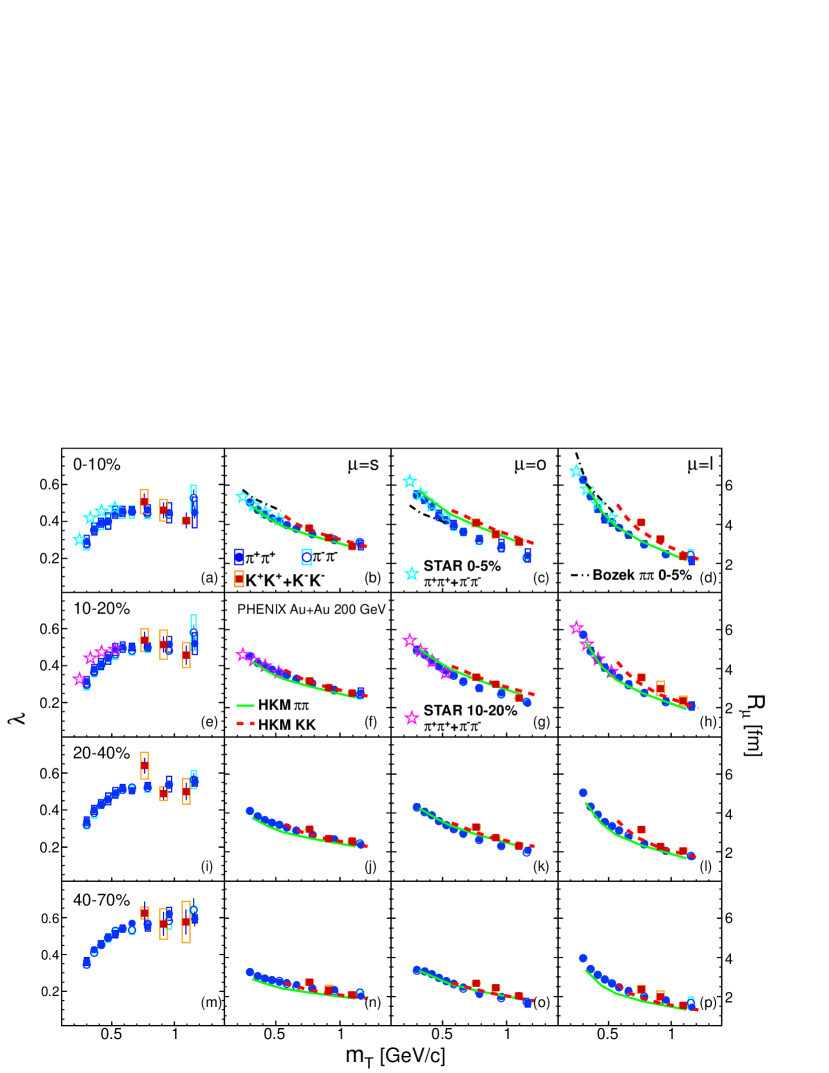
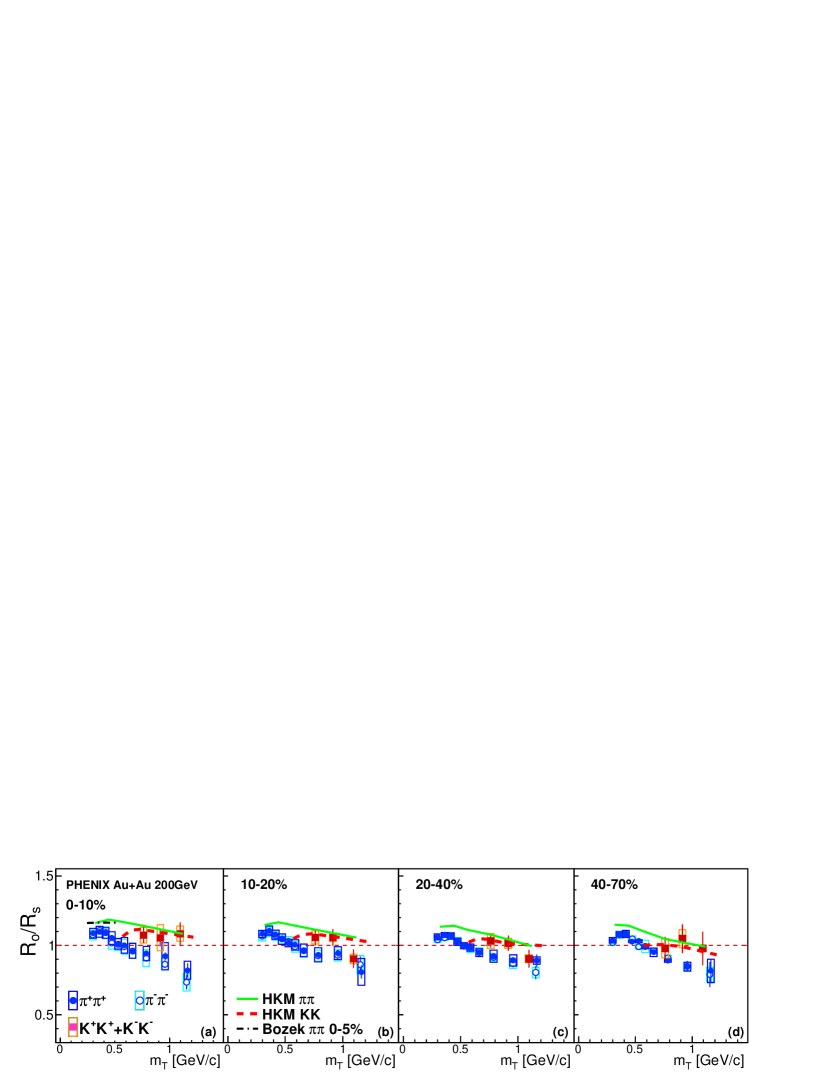
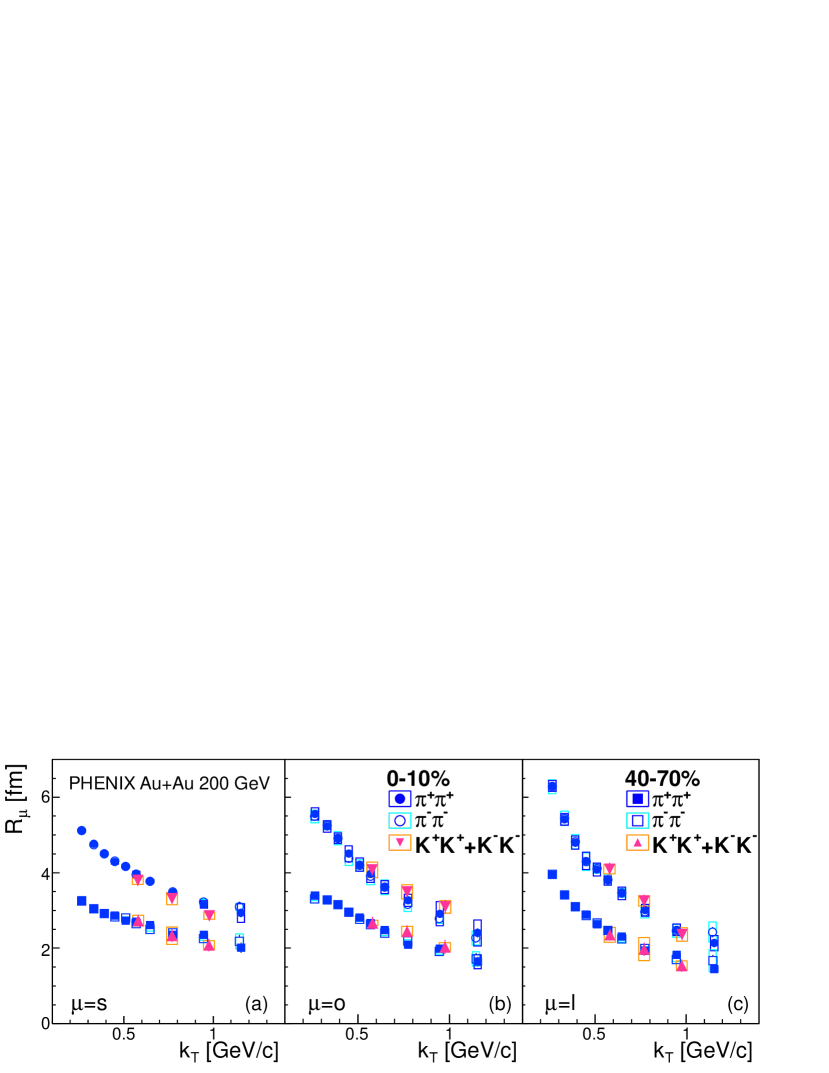
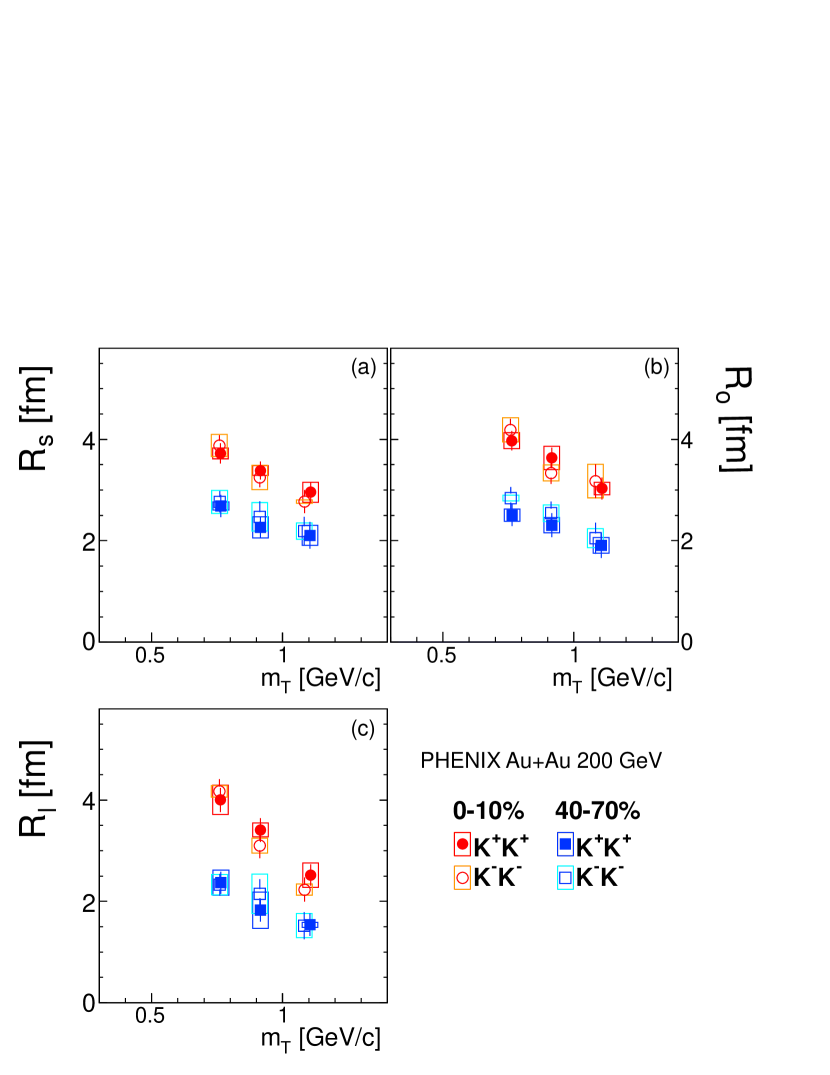
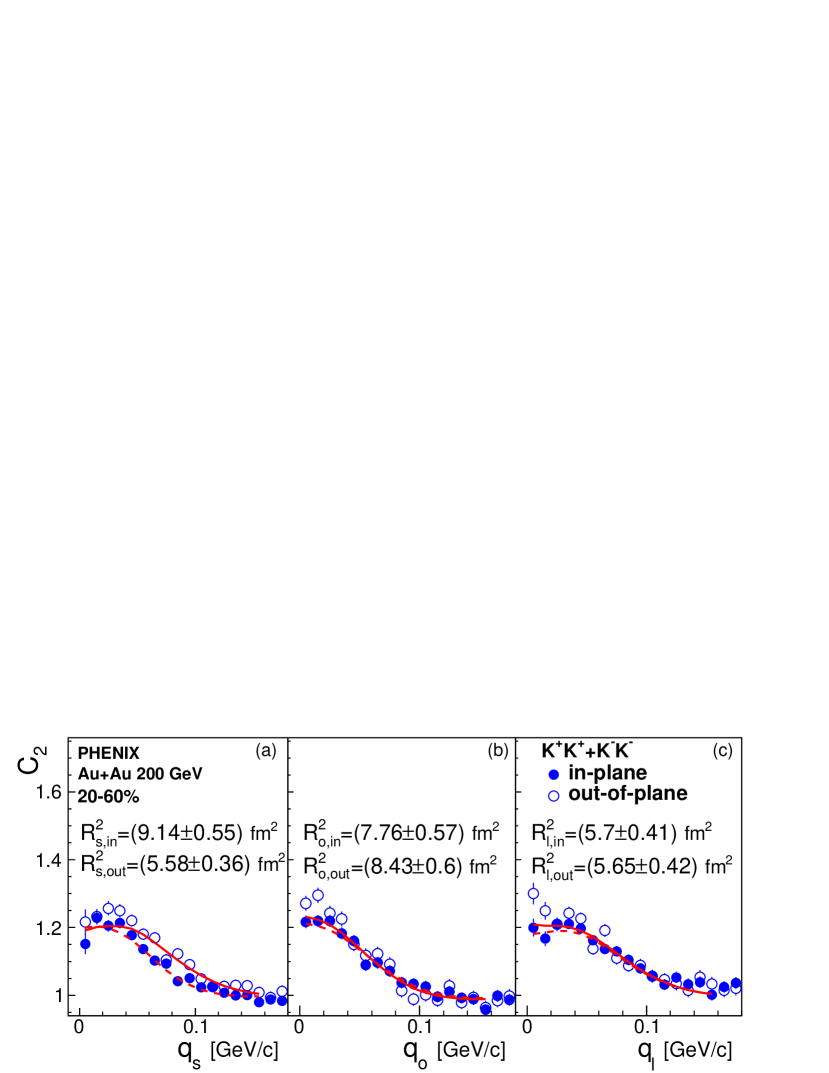
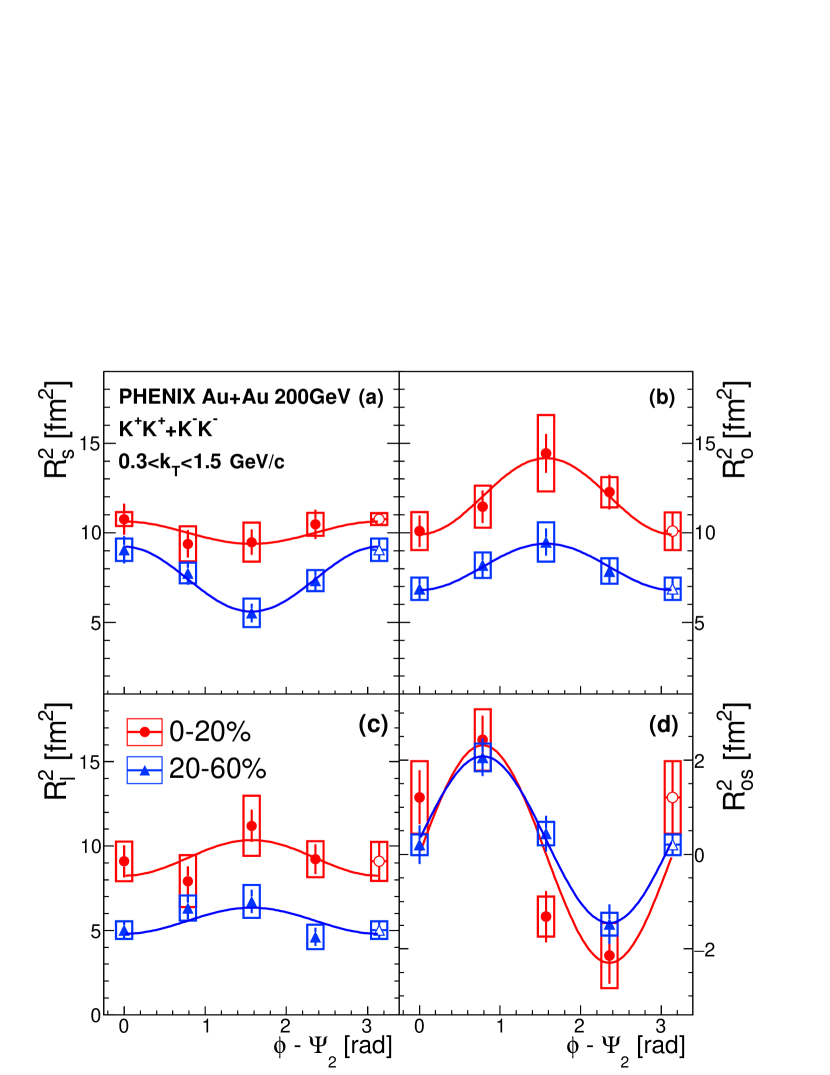
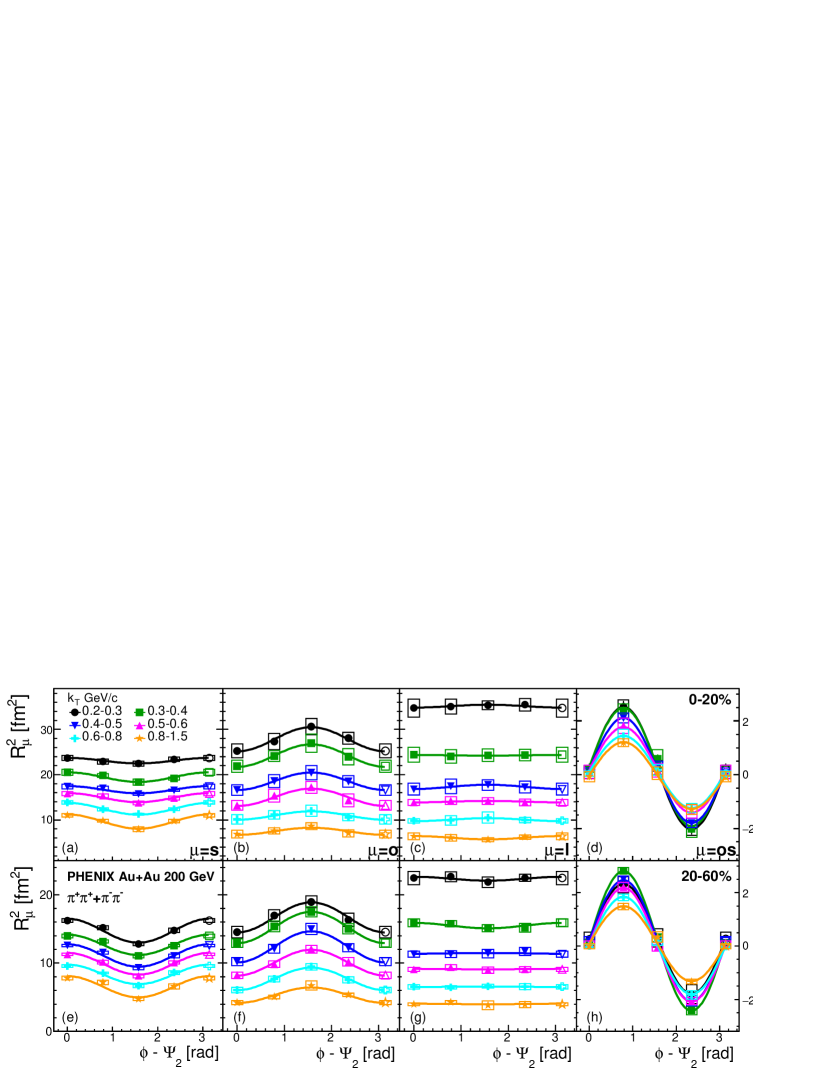
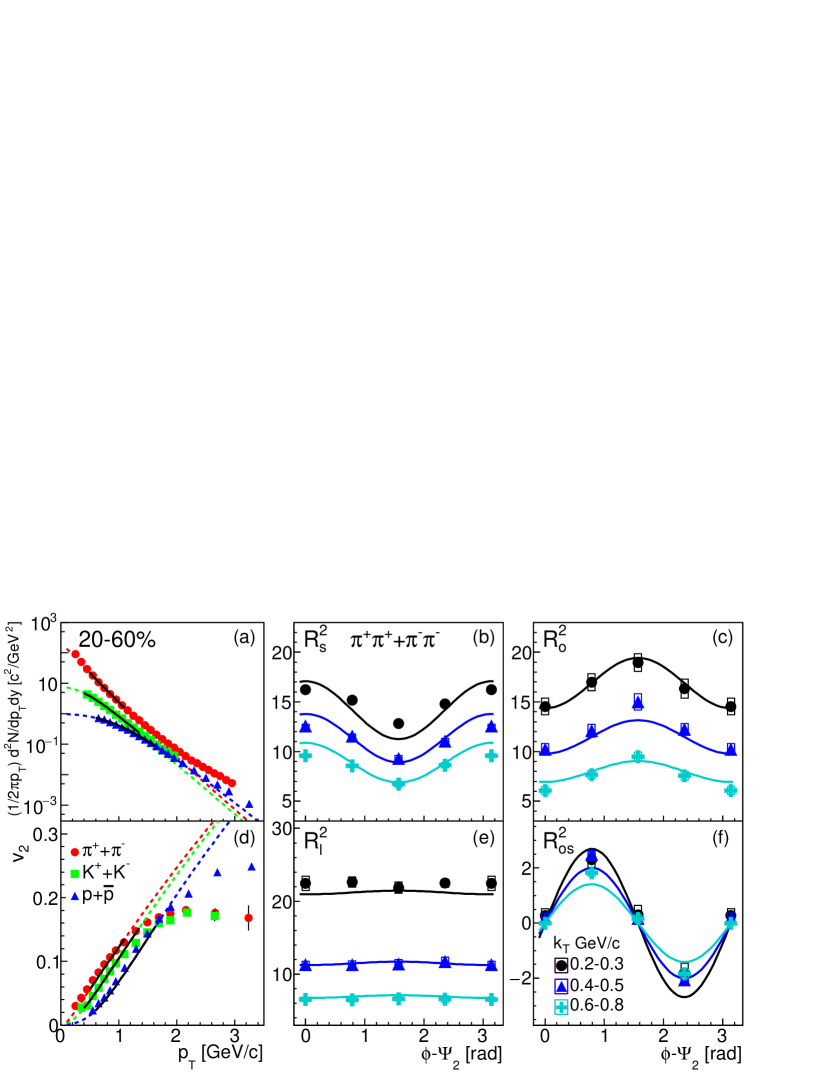
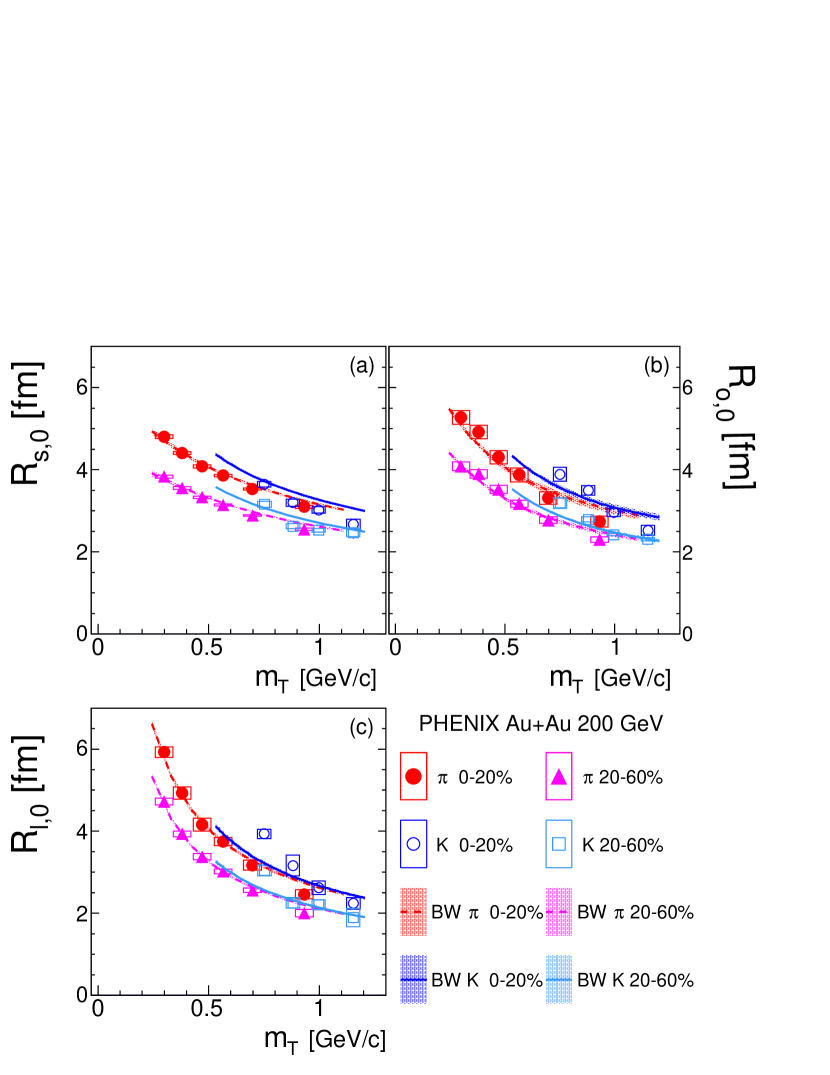
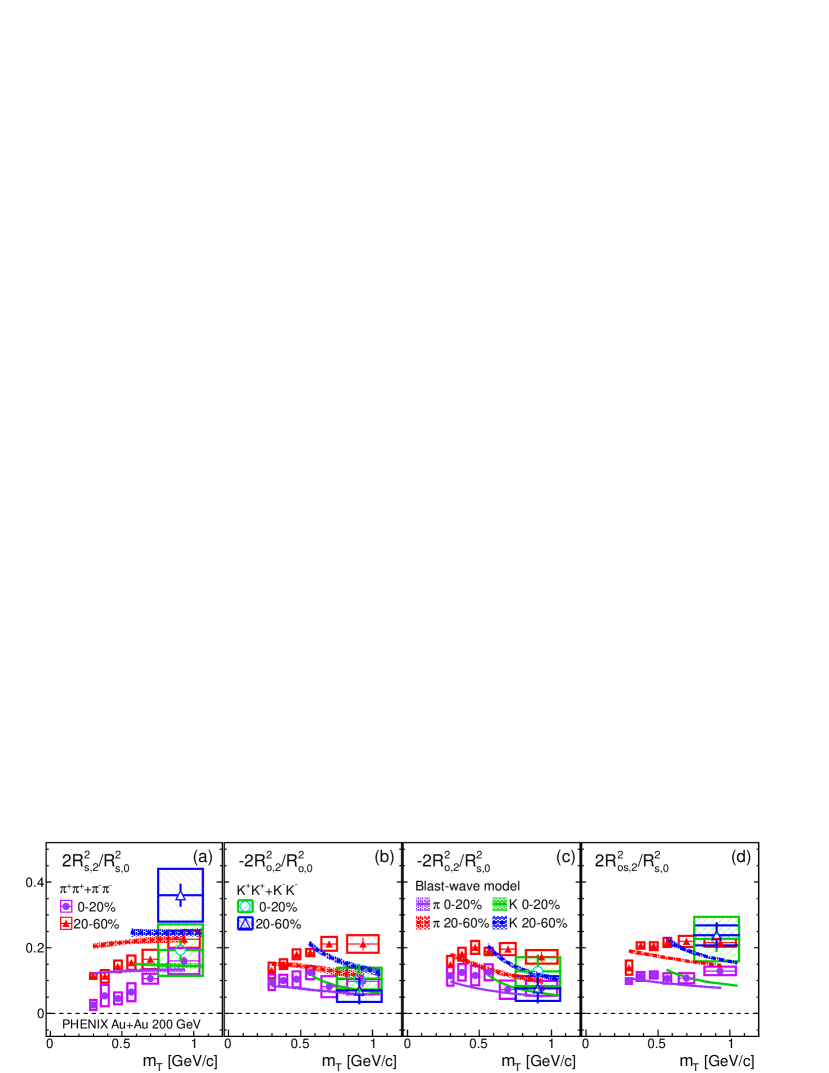
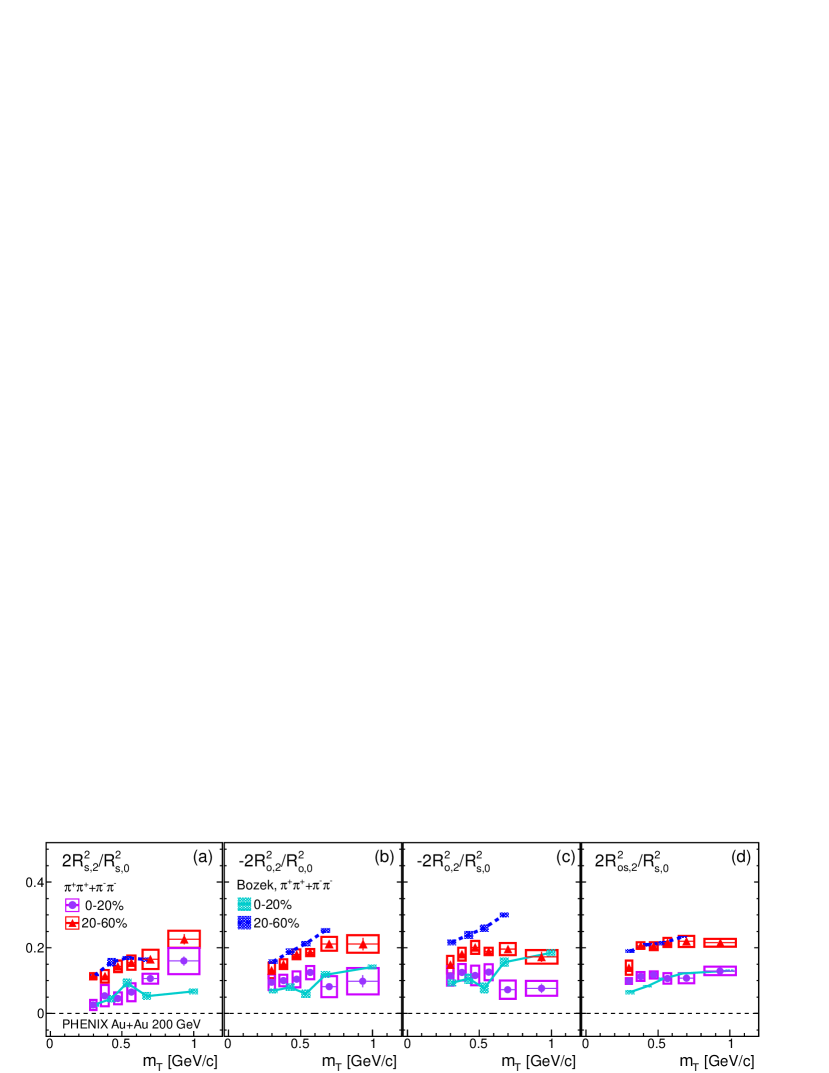
Figure 3 shows the extracted HBT parameters of charged pions and kaons for four centrality classes as a function of . Results for charged pions in the low region from STAR Adams et al. (2005b) are also plotted. The source parameters from the two experiments are in good agreement, but the parameters are 20% lower at low . The value of is sensitive to the combinatorial background level, which may differ between PHENIX and STAR. Positive and negative pions are quite consistent. The presented data are also consistent with our previous results Adler et al. (2004a); Afanasiev et al. (2009a).
The decrease of HBT radii with is often attributed to the position-momentum correlation induced by collective flow. The slope of the dependence becomes steeper for more central collisions, which is consistent with an expectation of a stronger radial flow Lisa et al. (2005). shows approximate scaling between pions and kaons as predicted by the Buda-Lund model M. Csanád and T. Csörgő (2008), which is based on the analytic approach of the perfect fluid hydrodynamics. On the other hand, and of kaons show larger values than those of pions as noted already in Fig. 2, where the scaling is broken. The difference increases with centrality going from peripheral to central collisions. The similar difference between pions and kaons for was reported by STAR Adamczyk et al. (2013).
The results are compared with the hydrokinetic model (HKM) I. A. Karpenko and Y. M. Sinyukov (2010); Y. M. Sinyukov, V. M. Shapoval, private communication; I. A. Karpenko and Y. M. Sinyukov and and K. Werner (2013). The HKM incorporates realistic conditions such as the Glauber initial condition, crossover transition, fluid hydrodynamics, microscopic transport and resonance decays, but does not explicitly include the viscous correction. It is reported that the model calculations with the initial condition of the color glass condensate are very similar to those with the Glauber initial condition I. A. Karpenko and Y. M. Sinyukov (2010). As shown in Fig. 3, the HKM Y. M. Sinyukov, V. M. Shapoval, private communication; I. A. Karpenko and Y. M. Sinyukov and and K. Werner (2013) describes well the overall trend of HBT radii for pions and kaons in all centrality bins, however it overestimates of pions in more central collisions and underestimates and of pions in peripheral collisions. The HKM also describes the difference of pions and kaons in the longitudinal direction, which can be understood by strong transverse flow Shapoval et al. (2014), but the difference in the outward direction cannot be explained well. The data for pions in most central collisions are also compared with (3+1)-D viscous hydrodynamic model P. Boz̀ek (2014) calculations which employ a Glauber initial condition and (also see Sec. IV.2.3 for details). The model follows the general trends in the data.
The ratio of and , which is sensitive to the emission duration of particles, is also plotted as a function of in Fig. 4. Results for both species do not show any significant centrality dependence, but the values for kaons are larger than those for pions at all and centralities, a possible indication of longer emission duration time for kaons than for pions. The HKM reproduces the data for kaons well, but not for pions.
The scaling of HBT radii was inspired by the hydrodynamic expansion Akkelin and Sinyukov (1996). This is based on the idea that the kinetic freeze out of hadrons occurs at the same time and the hadrons with similar velocities are emitted from the same homogeneity region. In other words, the homogeneity length depends on the particle mass under the presence of radial flow. In Fig. 5, both pion and kaon HBT radii for central and peripheral events are plotted as a function of . Unlike the case of the dependence shown in Fig.3, both radii seem to be scaled better for in all directions as predicted in Ref. Shapoval et al. (2014). This model includes many different effects such as the hadronic cascade and resonance decays in addition to radial flow.
We have also checked charge-dependent kaon HBT radii in Fig. 7. There was no significant difference between positive and negative kaons as we expected. If nucleons are dominant in the particle-emitting source and the net baryon density is not small, the measured radii might be different between and (and also pions) because of smaller cross section of than Beringer et al. (2012). However this is not observed.
IV.2 Azimuthal-dependent analysis
IV.2.1 Results
We have measured the azimuthal angle dependence of HBT radii with respect to for both charged pions and kaons. Figure 7(a-c) shows the correlation functions of charged kaons in the 20%–60% centrality bin in the in-plane () and out-of-plane () directions without correction for the event plane resolution. The correlation functions in Fig. 7 are calculated in the same way as Fig. 2, i.e. when making the 1-dimensional along the q of interest, the other are limited to be less than 50 MeV/. To make a comparison of the width between in-plane and out-of-plane directions, the in the positive and negative are averaged because they are symmetric over within the statistical uncertainties. The extracted radii without the correction are also shown in the figure. A difference of the width in the correlation function between these (in- and out-of-plane) directions can be seen in the sidewards (Fig. 7(a)) direction. Figure 8 shows the extracted HBT radii of charged kaons as a function of azimuthal pair angle with respect to for two centrality bins where is 0.77 GeV/. We first fix in Eq. (3) by taking the average for obtained in all azimuthal bins, then we fit in individual azimuthal bins again with fixed parameter as detailed in Adams et al. (2005b). This treatment is based on the assumption that has no azimuthal angle dependence, and the data fluctuate but do not depend on the azimuthal angle beyond the systematic uncertainty. The cosine oscillations of and (Fig. 8(a,b)) and the sine oscillation of (Fig. 8(d)) can be clearly seen. Non-zero at implies that the direction of the particle emission is tilted relative to the main axis of the emission region. The oscillation of seems to be larger than for in 20%–60% centrality bin.
We have also measured the charged pion HBT radii with respect to for the same centrality bins as kaons with six () bins as shown in Fig. 9. The averages of , , and decrease with as seen in Fig. 3. The and have similar but opposite oscillations in all bins. For 20%–60% centrality, both transverse radii show finite oscillation even in the lowest bin, which indicates that the pion emission happens from an elliptical source. For 0%–20% centrality, the has a weak azimuthal angle dependence, while the has a larger oscillation than the . It could be consistent with being more influenced by the anisotropic flow as discussed in our previous publication Adare et al. (2014). The oscillations of decrease with and displays a negligible azimuthal angle dependence, which qualitatively agree with hydrodynamic calculations Retière and Lisa (2004); Frodermann et al. (2007).
IV.2.2 Blast-wave model fit
In this section, we perform blast-wave model fits to our results to extract features at the kinetic freeze out and study their particle species dependence. The blast-wave (BW) model E. Schnedermann and J. Sollfrank and U. Heinz (1993) is based on a hydrodynamical model parameterized by the freeze-out conditions, such as the freeze-out temperature () and the transverse flow rapidity (). This model is further expanded in Ref. Retière and Lisa (2004) to describe the elliptic flow and azimuthal angle dependence of HBT radii by introducing additional parameters: 2nd-order modulation in transverse flow rapidity (), the transverse source size (, ), the freeze-out time (), and the emission duration (). Once the above seven parameters are fixed, the spectra, elliptic flow, and HBT radii can be calculated within the model.
Each freeze-out parameter has a different sensitivity to each experimental observable Retière and Lisa (2004). For example, the and the ratio of and are less sensitive to spectra, but more sensitive to the elliptic flow and the azimuthal angle dependence of HBT radii. To effectively constrain those parameters, a fit to spectra was first performed to determine and , then the other parameters were determined by simultaneous fit to the elliptic flow and azimuthal-dependent HBT radii. For the source size parameters, the and are actually used as the fitting parameters.
The BW model assumes that the freeze out for all hadron species takes place at the same time, but the actual situation may be more complicated. To investigate how the extracted freeze-out parameters vary by particle species of HBT radii, the following fits were tested:
-
A.
Fit for spectra and of , , along with HBT radii of .
-
B.
Fit for spectra and of , , along with HBT radii of .
In the case of Fit B, both azimuthal-dependent and azimuthal-integrated HBT radii of charged kaons were included in the fit.
Figure 10 shows the results of Fit A for the spectra (Fig. 10(a)) and elliptic flow (Fig. 10(d)) of , and , and pion HBT radii (Fig. 10(b,c,e,f)) in 20%–60% centrality. The solid lines show the BW fitting functions and the dashed lines in the panel (a) and (d) represent the extended fitting function beyond their actual fit ranges. Only three bins for HBT radii are shown here, but all six bins shown in Fig. 9 were simultaneously used in the fit. Here, the data of spectra are taken from Adler et al. (2004b) and the data of from Adare et al. . The spectra and are well described at low , and the overall trend of the HBT radii is also reproduced by the BW model.
The results from the fits are summarized in Table 3. The systematic uncertainties of the BW model fit were estimated by varying the fit conditions: the fit range, a surface diffuseness to control the density profile Retière and Lisa (2004), and the relative weighting factor between different particle species. The systematic uncertainties of data were taken into account in the calculation of . Our results from Fit A are in good agreement with those in previous studies Adler et al. (2005); Adams et al. (2005b). The results of Fit B shows slightly different values, i.e, smaller and larger . The smaller source () might be intuitively understood as due to kaons freezing out earlier than pions, but it is not significant in the parameter . The obtained by the Fit B using the kaon HBT result shows relatively larger values than the results by Fit A, which is consistent with the result from as shown in Fig. 4.
Also, the dependence of the pion and kaon HBT radii has been calculated using the parameters obtained from Fit A as shown with lines in Fig. 11. For a comparison, the 0th-order Fourier coefficients () for pions which correspond to the HBT radii obtained in the azimuthal-integrated analysis are plotted as filled symbols. The kaon HBT radii from the azimuthal-integrated analysis are also compared in the figure. The BW model shows the / difference in the sidewards and outward directions, but not in the longitudinal direction unlike the experimental data.
| Fit | Centrality | /NDF | /NDF | /NDF | |||||||
|---|---|---|---|---|---|---|---|---|---|---|---|
| [MeV] | [fm] | [fm/] | [fm/] | (spectra) | () | (HBT) | |||||
| A | 0%–20% | 104 | 0.995 | 0.047 | 11.28 | 1.092 | 8.22 | 2.06 | 143.4/27=5.3 | 25.2/21=1.2 | 2526.7/96=26.3 |
| (5) | (0.055) | (0.005) | (0.23) | (0.003) | (0.23) | (0.18) | |||||
| A | 20%–60% | 113 | 0.905 | 0.074 | 8.25 | 1.171 | 6.1 | 1.56 | 206.5/27=7.6 | 46.4/21=2.2 | 1998.3/96=20.8 |
| (8) | (0.059) | (0.012) | (0.29) | (0.003) | (0.31) | (0.12) | |||||
| B | 0%–20% | 104 | 0.995 | 0.042 | 10.19 | 1.102 | 8.48 | 2.73 | 143.4/27=5.3 | 11.0/21=0.5 | 116.9/28=4.2 |
| (5) | (0.055) | (0.004) | (0.46) | (0.004) | (0.81) | (0.58) | |||||
| B | 20%–60% | 113 | 0.905 | 0.067 | 7.44 | 1.182 | 4.95 | 2.86 | 206.5/27=7.6 | 39.4/21=1.9 | 95.7/28=3.4 |
| (8) | (0.059) | (0.01) | (0.55) | (0.008) | (0.91) | (0.52) |
IV.2.3 Oscillation amplitudes with hydrodynamic models
The BW model Retière and Lisa (2004) suggests that the source eccentricity at freeze out is given by (see Eq. (13)) in the absence of position-momentum correlation, i.e. radial flow. In the presence of radial flow, the above relation would be smeared because the HBT radius does not reflect the whole source size, but the from could still be a good estimator in the limit of .
The HBT radii of both pions and kaon averaged over the azimuthal direction are well described by the hydrodynamic models including the BW model as shown so far. In this section, the oscillation amplitudes are also compared with the hydrodynamic models. The oscillation amplitudes were extracted by using Eq. (13). The systematic uncertainties were estimated by performing the fitting with Eq. (13) for the data of various systematic sources described in Sec III.5. In Fig. 13 and Fig.13, the oscillation amplitudes with 4 different combinations of HBT radii are plotted in the form of a final eccentricity, , where and denote . The is a fitting parameter in Eq. (13) that can take a negative value, which represents a different phase of the cosine function and shown in Fig. 13(b,c) and Fig. 13(b,c).
Figure 13(a) shows the oscillation amplitude of relative to the average, which is most sensitive to the final source eccentricity. The value of increases with , which would reflect dependent ellipticity of the emission region. The other combinations of show similar dependence, but less dependence especially in 0%–20% centrality. It should be noted that the and contain the particle emission duration in addition to the geometrical information, and they are also dominated by the anisotropy in the expansion velocity.
The data are compared with the blast-wave calculation using the Fit A parameters in Fig. 13. The dependency on of the oscillation amplitudes is not described well, although the dependence of the mean radii is reproduced well. The large of HBT in Fit A in Table 3 is mainly caused by such a discrepancy. The calculations from the event-by-event 3+1-D viscous-hydrodynamic model P. Boz̀ek (2014) with a Glauber initial condition and shear viscosity /s=0.08 (and also nonzero bulk viscosity) are compared to the same data in Fig. 13. The model employs the equation of state with a crossover transition, but does not include a hadron cascade. The model quantitatively agrees with the data of and but overestimates in 20%–60% although the trend (not the magnitude) of dependency on is reproduced in contrast with the blast-wave model.
When data points of kaons are compared to those of pions in the 0%–20% centrality sample, they mostly agree within the systematic uncertainties, but in the 20%–60% sample the () of kaons is slightly larger(smaller) than that of pions. More precise measurement is needed to confirm the difference.
V Summary and Conclusion
We have presented results from the PHENIX experiment on charged pion and kaon femtoscopy measurements in AuAu collisions at = 200 GeV. In the azimuthal-integrated analysis, we have measured the HBT radii of both species with fine and centrality bins. scaling holds well for , but there are visible differences for and between charged pions and kaons at the same , and the differences become larger in more central collisions. scaling breaks for those radii, but scaling works well for all radii. It is observed that the ratio of kaons is larger than that of pions, which may imply different emission durations. The hydrokinetic model was compared with our data. It reproduces most aspects of the data of both charged pions and kaons, but it fails to accurately describe the difference in .
In the azimuthal-dependent analysis, a first measurement of the HBT radii of charged kaons with respect to the second-order event plane has been performed and compared with pion measurements with finer bins. Oscillation with respect to the event plane of kaon HBT radii has been clearly observed, and is similar to that of pions. The data were compared with the blast-wave model and the 3+1-D viscous-hydrodynamic model. The blast-wave model provides a good description of the overall trend of the spectra, the elliptic flow, and the mean HBT radii, but fails to describe the details of femtoscopy measurements, such as the dependent oscillation amplitude of the source radii. While the 3+1-D viscous-hydrodynamic model does qualitatively reproduce the data, it overestimates the oscillation of . We note that the viscous hydrodynamic model also reproduces well the other observables such as the spectra and elliptic flow P. Boz̀ek (2012).
Both the hydrokinetic model and viscous-hydrodynamic model surprisingly describe all aspects of the femtoscopic data, even though these models lack the shear viscosity of plasma and the microscopic transport phase. Including these effects may improve the description of the measured and . More precise measurements and systematic model comparison for both azimuthal-dependent and azimuthal-integrated HBT measurements are needed. The particle-species dependence, in addition to the differential femtoscopy measurements may help to elucidate the expansion dynamics of heavy ion collisions.
ACKNOWLEDGMENTS
We thank the staff of the Collider-Accelerator and Physics Departments at Brookhaven National Laboratory and the staff of the other PHENIX participating institutions for their vital contributions. We acknowledge support from the Office of Nuclear Physics in the Office of Science of the Department of Energy, the National Science Foundation, Abilene Christian University Research Council, Research Foundation of SUNY, and Dean of the College of Arts and Sciences, Vanderbilt University (U.S.A), Ministry of Education, Culture, Sports, Science, and Technology and the Japan Society for the Promotion of Science (Japan), Conselho Nacional de Desenvolvimento Científico e Tecnológico and Fundação de Amparo à Pesquisa do Estado de São Paulo (Brazil), Natural Science Foundation of China (P. R. China), Ministry of Science, Education, and Sports (Croatia), Ministry of Education, Youth and Sports (Czech Republic), Centre National de la Recherche Scientifique, Commissariat à l’Énergie Atomique, and Institut National de Physique Nucléaire et de Physique des Particules (France), Bundesministerium für Bildung und Forschung, Deutscher Akademischer Austausch Dienst, and Alexander von Humboldt Stiftung (Germany), National Science Fund, OTKA, Károly Róbert University College, and the Ch. Simonyi Fund (Hungary), Department of Atomic Energy and Department of Science and Technology (India), Israel Science Foundation (Israel), Basic Science Research Program through NRF of the Ministry of Education (Korea), Physics Department, Lahore University of Management Sciences (Pakistan), Ministry of Education and Science, Russian Academy of Sciences, Federal Agency of Atomic Energy (Russia), VR and Wallenberg Foundation (Sweden), the U.S. Civilian Research and Development Foundation for the Independent States of the Former Soviet Union, the Hungarian American Enterprise Scholarship Fund, and the US-Israel Binational Science Foundation.
Appendix A Blast-wave model
An emission function in the blast-wave parameterization for bosons Retière and Lisa (2004) is given by
| (14) |
where is the transverse mass, is rapidity, is azimuthal angle of particle momentum, and and are defined as
| (15) | |||||
| (16) |
The transverse rapidity is defined as:
| (17) |
where and are space coordinate of particles, is azimuthal angle of the spatial positions, and is a boost direction. It is assumed that particles are boosted to the direction perpendicular to the elliptical subshell of the particle-emitting source, which satisfies the relation below:
| (18) |
The distribution of the source elements is given by
| (19) |
where denotes a surface diffuseness and gives a box profile and gives approximately a Gaussian profile. Observables, such as spectra, , and HBT radii, are obtained by performing the integral of the emission function Eq. (14) over phase space weighted with certain quantity :
Azimuthally integrated spectra can be obtained by integrating over and in Eq. (A) setting =1. If we assume Boltzmann distribution for all particles, only the first term in the summation in Eq. (14) is used. Also, in case of analyzing particles in midrapidity region, Eq. (14) can be simplified by setting =0. Then Eq. (A) can be rewritten as the following:
| (21) | |||||
where is the modified Bessel function of the second kind, which is defined as
| (22) |
Here we replace as , and the range of the integral over is from to . Then the range can be replaced from 0 to because the integrand is the periodic function with . Finally, Eq. (21) is rewritten as
| (23) | |||||
where is the modified Bessel function of the first kind given by
| (24) |
The elliptic flow is calculated as
| (25) |
The denominator is the same expression with Eq. (23). The numerator can be calculated by a similar way to derive the spectra.
| (26) | |||||
Finally, the elliptic flow can be expressed as
| (27) |
The HBT radii are related to space-time variance as Retière and Lisa (2004)
| (28) | |||||
| (29) | |||||
| (30) | |||||
| (31) | |||||
where
| (32) | |||||
| (33) |
and vanishes in the LCMS frame and the terms including and depend on the proper time and emission duration of particles . As shown in above equations, depends on only the spatial extent of the source and azimuthal angle , while and are also sensitive to and as well as the spatial extent.
Appendix B Data tables
The extracted HBT radii and the oscillation amplitudes for charged pion and kaons in AuAu collisions at =200 GeV are summarized in Table 4-11.
| Centrality | |||||
|---|---|---|---|---|---|
| [GeV/c] | [fm] | [fm] | [fm] | ||
| 0%–10% | 0.3 | 0.292 0.003 11.1 | 5.11 0.03 0.5 | 5.55 0.04 2.9 | 6.3 0.04 2.3 |
| 0.36 | 0.358 0.004 8.7 | 4.76 0.03 0.6 | 5.22 0.03 3 | 5.41 0.04 2.8 | |
| 0.41 | 0.392 0.004 6.1 | 4.52 0.03 0.8 | 4.91 0.03 2.8 | 4.8 0.04 3.7 | |
| 0.47 | 0.402 0.005 11 | 4.28 0.03 1.3 | 4.51 0.03 4.7 | 4.31 0.03 5.2 | |
| 0.53 | 0.45 0.006 7.3 | 4.17 0.03 0.7 | 4.21 0.04 4.2 | 4.08 0.04 4.2 | |
| 0.59 | 0.454 0.007 5.9 | 3.98 0.03 1.4 | 3.97 0.04 5.7 | 3.8 0.04 3.2 | |
| 0.66 | 0.458 0.007 4.7 | 3.77 0.03 1.1 | 3.62 0.04 4.8 | 3.45 0.04 4.8 | |
| 0.79 | 0.462 0.008 6.1 | 3.47 0.03 1.2 | 3.27 0.04 4.9 | 3.01 0.04 5.2 | |
| 0.96 | 0.447 0.016 12 | 3.16 0.06 3.1 | 2.91 0.07 10.9 | 2.49 0.06 6.1 | |
| 1.16 | 0.448 0.034 18.5 | 2.93 0.11 8.3 | 2.4 0.12 14.4 | 2.13 0.11 9.4 | |
| 10%–20% | 0.3 | 0.313 0.003 9 | 4.63 0.03 0.6 | 5.01 0.03 2.4 | 5.77 0.04 1.9 |
| 0.36 | 0.379 0.004 7.2 | 4.3 0.03 0.5 | 4.74 0.03 2.6 | 4.95 0.04 2.8 | |
| 0.41 | 0.41 0.004 7.3 | 4.1 0.03 1.3 | 4.41 0.03 3.1 | 4.44 0.03 3.5 | |
| 0.47 | 0.441 0.005 7.5 | 3.94 0.03 1 | 4.12 0.03 3.6 | 4.07 0.03 4.2 | |
| 0.53 | 0.487 0.006 6.6 | 3.83 0.03 0.8 | 3.88 0.03 2.9 | 3.83 0.03 3.7 | |
| 0.59 | 0.501 0.008 5.5 | 3.67 0.03 0.9 | 3.68 0.04 3.7 | 3.56 0.04 2.3 | |
| 0.66 | 0.501 0.008 4.2 | 3.5 0.03 1.5 | 3.38 0.03 3.7 | 3.24 0.03 3.5 | |
| 0.79 | 0.501 0.008 4.3 | 3.21 0.03 0.9 | 2.99 0.03 4.9 | 2.78 0.03 3.1 | |
| 0.96 | 0.515 0.016 8.2 | 2.94 0.05 1.4 | 2.78 0.06 4.1 | 2.34 0.05 6.3 | |
| 1.16 | 0.52 0.035 11.2 | 2.76 0.1 9 | 2.23 0.1 2.8 | 2.09 0.1 9.7 | |
| 20%–40% | 0.3 | 0.339 0.003 7.2 | 4.09 0.02 0.6 | 4.34 0.02 2.5 | 5.01 0.03 1.5 |
| 0.36 | 0.401 0.003 5.8 | 3.81 0.02 0.9 | 4.09 0.02 2 | 4.35 0.03 2.1 | |
| 0.41 | 0.433 0.004 5.4 | 3.63 0.02 0.7 | 3.87 0.02 2.3 | 3.88 0.03 2.2 | |
| 0.47 | 0.46 0.005 6.9 | 3.5 0.02 0.9 | 3.59 0.02 3.2 | 3.55 0.03 3.7 | |
| 0.53 | 0.493 0.005 5.8 | 3.39 0.02 0.8 | 3.38 0.02 2.9 | 3.3 0.03 3 | |
| 0.59 | 0.519 0.007 3.7 | 3.26 0.02 0.3 | 3.2 0.03 2.7 | 3.11 0.03 2.1 | |
| 0.66 | 0.505 0.006 3.2 | 3.07 0.02 0.4 | 2.91 0.02 2.7 | 2.77 0.03 1.9 | |
| 0.79 | 0.532 0.007 3.5 | 2.89 0.02 1.1 | 2.66 0.02 3.7 | 2.45 0.02 3.1 | |
| 0.96 | 0.54 0.014 7.7 | 2.63 0.04 4.3 | 2.34 0.04 3.5 | 2.07 0.04 3.2 | |
| 1.16 | 0.554 0.027 4.3 | 2.35 0.08 2.9 | 2.09 0.08 5.5 | 1.76 0.07 5.6 | |
| 40%–70% | 0.3 | 0.363 0.004 5.8 | 3.27 0.02 0.9 | 3.39 0.03 2.6 | 3.94 0.03 1.1 |
| 0.36 | 0.426 0.005 2.8 | 3.05 0.03 0.6 | 3.29 0.03 1.7 | 3.42 0.03 1.1 | |
| 0.41 | 0.455 0.006 4.2 | 2.92 0.03 0.7 | 3.16 0.03 3 | 3.09 0.03 1.5 | |
| 0.47 | 0.493 0.007 3.6 | 2.87 0.03 1.2 | 2.94 0.03 1.7 | 2.89 0.03 2.1 | |
| 0.53 | 0.509 0.008 3.9 | 2.73 0.03 0.9 | 2.81 0.03 1.8 | 2.63 0.03 2 | |
| 0.59 | 0.54 0.01 3.4 | 2.7 0.03 1.2 | 2.67 0.04 1.7 | 2.46 0.04 1.6 | |
| 0.66 | 0.569 0.01 1.2 | 2.61 0.03 2.1 | 2.48 0.03 1.9 | 2.31 0.03 1 | |
| 0.79 | 0.551 0.01 4.6 | 2.36 0.03 1.6 | 2.1 0.03 2.1 | 1.93 0.03 2.1 | |
| 0.96 | 0.619 0.024 5.7 | 2.35 0.06 1 | 1.99 0.06 4.4 | 1.82 0.06 1.6 | |
| 1.16 | 0.592 0.041 3.8 | 2.02 0.13 2.8 | 1.64 0.13 11.1 | 1.45 0.11 3.5 |
| Centrality | |||||
|---|---|---|---|---|---|
| [GeV/c] | [fm] | [fm] | [fm] | ||
| 0%–10% | 0.3 | 0.275 0.003 10.5 | 5.11 0.03 0.6 | 5.49 0.04 3 | 6.28 0.05 2.9 |
| 0.36 | 0.353 0.004 7.3 | 4.74 0.03 0.7 | 5.25 0.04 2.1 | 5.44 0.05 3.4 | |
| 0.41 | 0.387 0.005 7.9 | 4.5 0.03 0.4 | 4.91 0.04 3.6 | 4.82 0.04 3.9 | |
| 0.47 | 0.399 0.005 9.1 | 4.31 0.03 0.9 | 4.38 0.04 4.3 | 4.29 0.04 5.4 | |
| 0.53 | 0.444 0.007 4.7 | 4.17 0.03 1.2 | 4.19 0.04 3.6 | 4.11 0.04 3 | |
| 0.59 | 0.45 0.008 7.4 | 3.95 0.04 1.2 | 3.91 0.04 5.7 | 3.82 0.04 3.8 | |
| 0.66 | 0.451 0.008 7.3 | 3.77 0.03 0.2 | 3.61 0.04 5.3 | 3.47 0.04 3.3 | |
| 0.79 | 0.442 0.008 6.2 | 3.49 0.03 1 | 3.16 0.04 6 | 2.96 0.04 5.5 | |
| 0.96 | 0.437 0.017 5 | 3.22 0.07 2.4 | 2.78 0.07 4.5 | 2.46 0.06 6.9 | |
| 1.15 | 0.526 0.046 13.3 | 3.1 0.13 3.1 | 2.27 0.13 8.1 | 2.43 0.13 11.1 | |
| 10%–20% | 0.3 | 0.295 0.003 9.4 | 4.63 0.03 0.4 | 4.93 0.04 3.4 | 5.74 0.04 2.3 |
| 0.36 | 0.363 0.004 6.4 | 4.3 0.03 0.3 | 4.71 0.04 3.1 | 4.88 0.04 2.6 | |
| 0.41 | 0.404 0.005 6.9 | 4.13 0.03 0.5 | 4.42 0.04 2.8 | 4.46 0.04 3.6 | |
| 0.47 | 0.443 0.006 7.2 | 3.95 0.03 1 | 4.13 0.03 2.9 | 4.05 0.04 4.1 | |
| 0.53 | 0.462 0.007 5.9 | 3.8 0.03 0.2 | 3.91 0.04 3.4 | 3.77 0.04 2.8 | |
| 0.59 | 0.492 0.008 4.1 | 3.68 0.03 0.4 | 3.64 0.04 3.7 | 3.53 0.04 3.5 | |
| 0.66 | 0.48 0.008 4.7 | 3.47 0.03 1.2 | 3.33 0.03 4.3 | 3.15 0.03 3.8 | |
| 0.79 | 0.497 0.009 5.1 | 3.25 0.03 0.5 | 3.01 0.03 4 | 2.75 0.03 3.7 | |
| 0.96 | 0.482 0.016 3.6 | 2.89 0.05 1.2 | 2.68 0.06 4.5 | 2.27 0.05 5.2 | |
| 1.15 | 0.579 0.043 16.5 | 2.67 0.12 8.6 | 2.29 0.11 5.7 | 2.11 0.1 6.7 | |
| 20%–40% | 0.3 | 0.32 0.003 6.8 | 4.11 0.02 0.5 | 4.28 0.03 2.3 | 5.05 0.03 2 |
| 0.36 | 0.385 0.004 7.3 | 3.83 0.03 1.4 | 4.03 0.03 2.8 | 4.32 0.03 2.1 | |
| 0.41 | 0.429 0.005 5 | 3.65 0.02 0.5 | 3.89 0.03 1.3 | 3.93 0.03 2.5 | |
| 0.47 | 0.458 0.005 6.6 | 3.5 0.02 0.5 | 3.59 0.03 3.1 | 3.54 0.03 3.5 | |
| 0.53 | 0.487 0.006 4.5 | 3.4 0.03 0.7 | 3.38 0.03 1.8 | 3.32 0.03 2.7 | |
| 0.59 | 0.509 0.007 3.5 | 3.26 0.03 0.9 | 3.18 0.03 2.7 | 3.1 0.03 2.9 | |
| 0.66 | 0.521 0.007 2.5 | 3.11 0.02 0.6 | 2.96 0.03 2.6 | 2.86 0.03 2.2 | |
| 0.79 | 0.521 0.007 4.8 | 2.87 0.02 0.7 | 2.62 0.03 3 | 2.4 0.02 3 | |
| 0.96 | 0.536 0.015 2.2 | 2.66 0.04 1.1 | 2.31 0.04 3 | 2.05 0.04 3.3 | |
| 1.16 | 0.565 0.034 8.6 | 2.45 0.1 3.4 | 1.97 0.09 1.7 | 1.81 0.09 3.3 | |
| 40%–70% | 0.3 | 0.344 0.004 5.2 | 3.25 0.03 0.9 | 3.31 0.03 1.5 | 3.96 0.04 0.7 |
| 0.36 | 0.409 0.006 4.3 | 3.05 0.03 0.9 | 3.27 0.03 1.9 | 3.41 0.04 1.8 | |
| 0.41 | 0.452 0.007 3.1 | 2.92 0.03 1 | 3.15 0.03 2.3 | 3.1 0.04 1.3 | |
| 0.47 | 0.489 0.008 4.8 | 2.83 0.03 1.4 | 2.95 0.03 2.6 | 2.86 0.04 1.8 | |
| 0.53 | 0.528 0.009 2.5 | 2.8 0.03 1.1 | 2.77 0.03 2 | 2.67 0.04 2.2 | |
| 0.59 | 0.539 0.011 2.9 | 2.65 0.04 2.3 | 2.62 0.04 3.2 | 2.47 0.04 1.3 | |
| 0.66 | 0.532 0.01 4.6 | 2.5 0.03 2 | 2.4 0.03 2.6 | 2.25 0.03 3.7 | |
| 0.79 | 0.565 0.012 3.5 | 2.41 0.03 1.4 | 2.19 0.04 1.7 | 1.99 0.03 2.5 | |
| 0.96 | 0.582 0.023 7.7 | 2.26 0.07 2.2 | 1.91 0.07 3.9 | 1.7 0.06 3.5 | |
| 1.15 | 0.641 0.063 3.5 | 2.18 0.17 9 | 1.72 0.14 10.9 | 1.67 0.15 17.3 |
| Centrality | |||||
|---|---|---|---|---|---|
| [GeV/c] | [fm] | [fm] | [fm] | ||
| 0%–10% | 0.76 | 0.507 0.044 12.9 | 3.8 0.15 2.7 | 4.07 0.15 5 | 4.09 0.17 2.9 |
| 0.91 | 0.46 0.043 12.7 | 3.32 0.13 4.9 | 3.49 0.15 5.3 | 3.25 0.17 4.1 | |
| 1.1 | 0.404 0.043 4.3 | 2.86 0.14 3.4 | 3.1 0.18 5.4 | 2.36 0.15 7.7 | |
| 10%–20% | 0.76 | 0.539 0.044 11.3 | 3.37 0.13 2.6 | 3.56 0.13 4 | 3.55 0.16 4.5 |
| 0.91 | 0.515 0.044 15.3 | 3.03 0.12 2.7 | 3.2 0.13 1.2 | 2.98 0.14 12.5 | |
| 1.1 | 0.457 0.052 14.7 | 2.75 0.14 1.5 | 2.48 0.14 2.6 | 2.34 0.17 10.8 | |
| 20%–40% | 0.76 | 0.64 0.044 11.4 | 3.18 0.11 2 | 3.28 0.1 4 | 3.15 0.12 4.7 |
| 0.91 | 0.489 0.034 7.6 | 2.69 0.1 2.8 | 2.73 0.1 3 | 2.29 0.11 3.8 | |
| 1.09 | 0.501 0.046 13.9 | 2.56 0.13 3.8 | 2.31 0.12 3.2 | 2.05 0.13 7.4 | |
| 40%–70% | 0.76 | 0.624 0.062 5.1 | 2.73 0.16 5.3 | 2.67 0.16 2.5 | 2.35 0.15 8.3 |
| 0.91 | 0.565 0.065 14.6 | 2.33 0.17 9.8 | 2.44 0.16 5.5 | 1.97 0.17 15.4 | |
| 1.09 | 0.575 0.068 19.5 | 2.08 0.17 5.8 | 2.03 0.19 5.3 | 1.54 0.16 8 |
| meson | / | ||||
|---|---|---|---|---|---|
| pair | [GeV/c] | 0%–10% | 10%–20% | 20%–40% | 40%–70% |
| 0.3 | 1.09 0.01 3.3 | 1.08 0.01 2.3 | 1.06 0.01 2.1 | 1.04 0.01 1.9 | |
| 0.36 | 1.10 0.01 3.5 | 1.10 0.01 3.0 | 1.07 0.01 1.6 | 1.08 0.01 1.7 | |
| 0.41 | 1.09 0.01 3.5 | 1.08 0.01 3.0 | 1.07 0.01 2.1 | 1.08 0.01 2.4 | |
| 0.47 | 1.05 0.01 4.3 | 1.04 0.01 3.6 | 1.03 0.01 2.5 | 1.03 0.01 0.9 | |
| 0.53 | 1.01 0.01 3.8 | 1.01 0.01 2.3 | 1.00 0.01 2.2 | 1.03 0.02 1.1 | |
| 0.59 | 1.00 0.01 5.6 | 1.00 0.01 3.7 | 0.98 0.01 2.6 | 0.99 0.02 1.4 | |
| 0.66 | 0.96 0.01 5.6 | 0.96 0.01 4.7 | 0.95 0.01 2.9 | 0.95 0.02 3.2 | |
| 0.79 | 0.94 0.01 5.4 | 0.93 0.01 5.5 | 0.92 0.01 4.7 | 0.89 0.02 1.5 | |
| 0.96 | 0.92 0.03 10.7 | 0.94 0.03 5.0 | 0.89 0.02 4.5 | 0.85 0.03 3.7 | |
| 1.16 | 0.82 0.05 7.8 | 0.81 0.05 11.9 | 0.89 0.04 2.9 | 0.81 0.08 10.5 | |
| 0.3 | 1.07 0.01 3.3 | 1.07 0.01 3.2 | 1.04 0.01 2.1 | 1.02 0.01 1.5 | |
| 0.36 | 1.11 0.01 2.5 | 1.10 0.01 3.2 | 1.05 0.01 1.9 | 1.07 0.02 2.4 | |
| 0.41 | 1.09 0.01 3.9 | 1.07 0.01 3.1 | 1.07 0.01 1.2 | 1.08 0.02 1.6 | |
| 0.47 | 1.02 0.01 4.3 | 1.04 0.01 3.2 | 1.03 0.01 2.7 | 1.04 0.02 2.1 | |
| 0.53 | 1.01 0.01 4.3 | 1.03 0.01 3.4 | 0.99 0.01 1.3 | 0.99 0.02 1.6 | |
| 0.59 | 0.99 0.01 5.4 | 0.99 0.01 3.9 | 0.98 0.01 3.0 | 0.99 0.02 4.4 | |
| 0.66 | 0.96 0.01 5.5 | 0.96 0.01 4.9 | 0.95 0.01 3.2 | 0.96 0.02 1.9 | |
| 0.79 | 0.91 0.01 6.7 | 0.92 0.01 4.3 | 0.91 0.01 2.9 | 0.91 0.02 2.0 | |
| 0.96 | 0.86 0.03 5.0 | 0.93 0.03 4.3 | 0.87 0.02 3.8 | 0.85 0.04 3.3 | |
| 1.15 | 0.73 0.05 8.7 | 0.86 0.06 7.6 | 0.8 0.05 4.8 | 0.79 0.09 6.7 | |
| 0.76 | 1.07 0.06 5.3 | 1.06 0.06 4.5 | 1.03 0.05 5.3 | 0.98 0.08 7.1 | |
| 0.91 | 1.05 0.06 8.9 | 1.06 0.06 2.9 | 1.01 0.05 3.6 | 1.05 0.10 6.1 | |
| 1.1 | 1.08 0.08 5.2 | 0.90 0.07 3.8 | 0.90 0.07 3.1 | 0.98 0.12 2.3 | |
| Centrality | ||||||
|---|---|---|---|---|---|---|
| [GeV/c] | [rad] | [fm2] | [fm2] | [fm2] | [fm2] | |
| 0%–20% | 0.2–0.3 | 23.68 0.27 0.56 | 25.25 0.34 1.54 | 34.72 0.48 1.97 | 0.21 0.2 0.11 | |
| 22.88 0.27 0.56 | 27.33 0.37 1.79 | 35.05 0.49 1.63 | 2.53 0.21 0.25 | |||
| 22.46 0.27 0.56 | 30.65 0.42 1.8 | 35.34 0.51 0.98 | 0.26 0.23 0.27 | |||
| 23.4 0.28 0.51 | 28.06 0.39 1.31 | 35.46 0.51 1.41 | -2.01 0.22 0.24 | |||
| 0.3–0.4 | 20.5 0.2 0.67 | 21.87 0.24 1.38 | 24.44 0.29 1.64 | 0.22 0.14 0.13 | ||
| 19.82 0.21 0.4 | 24.09 0.27 1.2 | 24.03 0.3 1.52 | 2.38 0.15 0.26 | |||
| 18.38 0.2 0.67 | 26.93 0.31 2.02 | 24.28 0.31 1.38 | 0.59 0.16 0.34 | |||
| 19.16 0.2 0.35 | 23.96 0.27 1.78 | 24.35 0.3 1.3 | -2.01 0.15 0.31 | |||
| 0.4–0.5 | 17.36 0.18 0.5 | 16.61 0.2 1.15 | 16.81 0.21 1.31 | 0.06 0.12 0.2 | ||
| 17.01 0.19 0.42 | 18.58 0.23 1.41 | 17.42 0.23 1.59 | 2.11 0.13 0.18 | |||
| 15.76 0.19 0.32 | 20.46 0.27 1.55 | 17.73 0.25 1.16 | 0.31 0.14 0.19 | |||
| 16.55 0.19 0.23 | 18.51 0.23 1.25 | 17.26 0.23 1.29 | -1.79 0.13 0.17 | |||
| 0.5–0.6 | 15.78 0.19 0.45 | 13.22 0.19 1.05 | 13.85 0.21 0.68 | 0.1 0.12 0.25 | ||
| 15.32 0.2 0.42 | 15.34 0.23 1.42 | 14.25 0.23 0.88 | 1.82 0.13 0.28 | |||
| 13.75 0.2 0.39 | 17.22 0.28 1.31 | 14.18 0.25 0.74 | 0.16 0.14 0.25 | |||
| 14.84 0.19 0.43 | 14.32 0.22 1.4 | 13.85 0.22 0.72 | -1.36 0.12 0.24 | |||
| 0.6–0.8 | 13.87 0.18 0.4 | 10.11 0.16 1.04 | 9.81 0.16 0.49 | 0.04 0.1 0.1 | ||
| 12.33 0.17 0.35 | 11.16 0.18 0.94 | 9.88 0.17 1.06 | 1.44 0.11 0.26 | |||
| 11.28 0.17 0.2 | 12.01 0.21 1.26 | 10.51 0.19 1.24 | 0.18 0.11 0.2 | |||
| 12.35 0.17 0.28 | 10.59 0.18 0.78 | 9.99 0.17 0.61 | -1.23 0.1 0.17 | |||
| 0.8–1.5 | 11.04 0.24 0.36 | 6.85 0.19 0.88 | 6.37 0.17 0.74 | -0.07 0.12 0.19 | ||
| 9.83 0.23 0.31 | 7.57 0.23 0.68 | 6.05 0.18 0.73 | 1.19 0.13 0.15 | |||
| 7.92 0.21 0.52 | 8.61 0.28 0.74 | 5.64 0.19 0.44 | 0.06 0.13 0.23 | |||
| 9.74 0.25 0.37 | 7.04 0.21 0.78 | 6.2 0.18 0.48 | -1.28 0.13 0.18 | |||
| 20%–60% | 0.2–0.3 | 16.24 0.19 0.29 | 14.53 0.21 0.84 | 22.44 0.32 0.97 | 0.27 0.13 0.25 | |
| 15.18 0.19 0.28 | 16.97 0.24 0.85 | 22.64 0.33 0.7 | 2.3 0.14 0.3 | |||
| 12.81 0.17 0.24 | 18.97 0.28 0.88 | 21.85 0.34 0.76 | 0.3 0.14 0.34 | |||
| 14.79 0.18 0.33 | 16.34 0.24 0.95 | 22.47 0.33 0.52 | -1.8 0.13 0.35 | |||
| 0.3–0.4 | 13.98 0.15 0.27 | 12.92 0.14 0.62 | 15.9 0.2 0.59 | 0.09 0.09 0.15 | ||
| 13.15 0.15 0.22 | 15.38 0.18 0.79 | 15.77 0.21 0.46 | 2.82 0.1 0.12 | |||
| 11.04 0.13 0.26 | 17.49 0.22 0.74 | 15.11 0.21 0.52 | 0.31 0.11 0.15 | |||
| 12.56 0.14 0.18 | 15.03 0.17 0.74 | 15.19 0.2 0.63 | -2.4 0.1 0.16 | |||
| 0.4–0.5 | 12.58 0.14 0.17 | 10.22 0.12 0.58 | 11.31 0.15 0.45 | 0.17 0.08 0.18 | ||
| 11.55 0.14 0.22 | 12.12 0.15 0.64 | 11.31 0.16 0.51 | 2.49 0.09 0.14 | |||
| 9.32 0.13 0.28 | 14.99 0.21 0.82 | 11.39 0.18 0.63 | 0.17 0.1 0.13 | |||
| 11.05 0.13 0.26 | 12.25 0.16 0.58 | 11.72 0.17 0.59 | -2.04 0.09 0.19 | |||
| 0.5–0.6 | 11.28 0.14 0.17 | 8.22 0.12 0.47 | 9.08 0.14 0.29 | 0.09 0.09 0.1 | ||
| 10.15 0.14 0.29 | 9.83 0.15 0.48 | 9.38 0.16 0.39 | 2.21 0.09 0.18 | |||
| 8.12 0.14 0.27 | 12.04 0.21 0.56 | 8.96 0.18 0.49 | -0.03 0.1 0.16 | |||
| 10.09 0.14 0.24 | 10.2 0.16 0.64 | 9.07 0.16 0.41 | -2.05 0.09 0.13 | |||
| 0.6–0.8 | 9.57 0.12 0.21 | 6.08 0.09 0.4 | 6.53 0.1 0.31 | 0 0.06 0.06 | ||
| 8.55 0.13 0.12 | 7.68 0.13 0.41 | 6.46 0.12 0.25 | 1.82 0.07 0.12 | |||
| 6.71 0.12 0.31 | 9.47 0.18 0.47 | 6.61 0.14 0.27 | 0.16 0.08 0.14 | |||
| 8.62 0.13 0.26 | 7.56 0.13 0.45 | 6.57 0.12 0.44 | -1.82 0.07 0.16 | |||
| 0.8–1.5 | 7.81 0.16 0.27 | 4.2 0.1 0.29 | 4 0.1 0.2 | 0 0.07 0.1 | ||
| 7.18 0.18 0.33 | 5.06 0.15 0.27 | 4.3 0.13 0.24 | 1.47 0.09 0.12 | |||
| 4.74 0.16 0.22 | 6.72 0.26 0.68 | 3.84 0.15 0.65 | 0.34 0.1 0.2 | |||
| 6.58 0.17 0.36 | 5.36 0.16 0.25 | 3.94 0.12 0.45 | -1.32 0.09 0.09 |
| Centrality | |||||
|---|---|---|---|---|---|
| [rad] | [fm2] | [fm2] | [fm2] | [fm2] | |
| 0%–20% | 11.86 0.68 0.42 | 10.77 0.79 1.14 | 10.43 0.72 1.34 | 1.22 0.58 0.77 | |
| 10.02 0.57 1.04 | 11.89 0.82 1.22 | 8.74 0.61 1.70 | 2.43 0.52 0.65 | ||
| 7.98 0.47 0.92 | 13.29 0.97 1.96 | 9.25 0.64 1.47 | -1.31 0.52 0.42 | ||
| 10.67 0.61 0.66 | 12.45 0.90 0.86 | 9.44 0.65 1.09 | -2.15 0.61 -0.69 | ||
| 20%–60% | 10 0.58 0.69 | 7.49 0.54 0.69 | 5.71 0.40 0.6 | 0.28 0.44 0.22 | |
| 7.52 0.46 0.56 | 8.03 0.58 0.69 | 6.07 0.43 0.71 | 2.05 0.40 0.29 | ||
| 4.69 0.31 0.68 | 8.56 0.59 0.99 | 5.61 0.42 0.81 | 0.41 0.34 0.25 | ||
| 8.03 0.49 0.65 | 8.51 0.62 0.77 | 5.27 0.40 0.83 | -1.52 0.43 -0.24 |
| Centrality | |||||
|---|---|---|---|---|---|
| [GeV/] | [fm2] | [fm2] | [fm2] | [fm2] | |
| 0%–20% | 0.30 | 0.026 0.007 0.015 | 0.095 0.008 0.024 | 0.114 0.010 0.029 | 0.099 0.007 0.009 |
| 0.38 | 0.054 0.006 0.032 | 0.101 0.007 0.018 | 0.125 0.008 0.025 | 0.113 0.005 0.013 | |
| 0.47 | 0.046 0.007 0.018 | 0.104 0.008 0.025 | 0.116 0.008 0.030 | 0.117 0.006 0.010 | |
| 0.57 | 0.065 0.008 0.027 | 0.125 0.009 0.020 | 0.126 0.009 0.024 | 0.107 0.006 0.016 | |
| 0.70 | 0.106 0.008 0.015 | 0.082 0.010 0.032 | 0.072 0.009 0.028 | 0.107 0.006 0.016 | |
| 0.93 | 0.160 0.014 0.040 | 0.098 0.019 0.040 | 0.077 0.015 0.022 | 0.129 0.010 0.013 | |
| 20%–60% | 0.30 | 0.114 0.007 0.009 | 0.131 0.009 0.024 | 0.149 0.010 0.027 | 0.140 0.007 0.022 |
| 0.38 | 0.113 0.007 0.019 | 0.150 0.007 0.015 | 0.181 0.008 0.020 | 0.207 0.006 0.010 | |
| 0.47 | 0.144 0.007 0.017 | 0.180 0.008 0.015 | 0.201 0.009 0.019 | 0.205 0.006 0.012 | |
| 0.57 | 0.155 0.008 0.022 | 0.185 0.010 0.011 | 0.189 0.010 0.011 | 0.216 0.007 0.014 | |
| 0.70 | 0.165 0.009 0.029 | 0.212 0.010 0.021 | 0.196 0.010 0.018 | 0.220 0.007 0.017 | |
| 0.93 | 0.226 0.015 0.026 | 0.211 0.019 0.027 | 0.172 0.016 0.021 | 0.216 0.010 0.012 |
. Centrality [GeV/] [fm2] [fm2] [fm2] [fm2] 0%–20% 0.91 0.193 0.034 0.078 0.106 0.044 0.033 0.128 0.052 0.044 0.227 0.040 0.067 20%–60% 0.91 0.360 0.035 0.080 0.070 0.042 0.035 0.076 0.045 0.038 0.238 0.040 0.030
References
- Adcox et al. (2005) K. Adcox et al. (PHENIX Collaboration), “Formation of dense partonic matter in relativistic nucleus-nucleus collisions at RHIC: Experimental evaluation by the PHENIX collaboration,” Nucl. Phys. A 757, 184 (2005).
- Adams et al. (2005a) J. Adams et al. (STAR Collaboration), “Experimental and Theoretical Challenges in the Search for the Quark Gluon Plasma: The STAR Collaboration’s Critical Assessment of the Evidence from RHIC Collisions,” Nucl. Phys. A 757, 102 (2005a).
- Back et al. (2005) B. B. Back et al. (PHOBOS Collaboration), “The PHOBOS Perspective on Discoveries at RHIC,” Nucl. Phys. A 757, 28 (2005).
- Arsene et al. (2005) L. Arsene et al. (BRAHMS Collaboration), “Quark Gluon Plasma and Color Glass Condensate at RHIC? The perspective from the BRAHMS experiment,” Nucl. Phys. A 757, 1 (2005).
- Aamodt et al. (2011) K. Aamodt et al. (ALICE Collaboration), “Suppression of charged particle production at large transverse momentum in central Pb+Pb collisions at = 2.76 TeV,” Phys. Lett. B 696, 30 (2011).
- Chatrchyan et al. (2011) S. Chatrchyan et al. (CMS Collaboration), “Observation and studies of jet quenching in PbPb collisions at = 2.76 TeV,” Phys. Rev. C 84, 024906 (2011).
- Aad et al. (2010) G. Aad et al. (ATLAS Collaboration), “Observation of a centrality-dependent dijet asymmetry in lead-lead collisions at = 2.76 TeV with the ATLAS detector,” Phys. Rev. Lett. 105, 252303 (2010).
- Zajc et al. (1984) W. A. Zajc et al., “Two-pion correlations in heavy ion collisions,” Phys. Rev. C 29, 2173 (1984).
- Lisa et al. (2005) M. Lisa, S. Pratt, R. Soltz, and U. Wiedemann, “Femtoscopy in Relativistic Heavy Ion Collisions: Two Decades of Progress,” Ann. Rev. Nucl. Part. Sci. 55, 357 (2005).
- Brown and Twiss (1956) R. Hanbury Brown and R. Q. Twiss, “A test of a new type of stellar interferometer on Sirius,” Nature 178, 1046 (1956).
- Goldhaber et al. (1960) G. Goldhaber, S. Goldhaber, W. Lee, and A. Pais, “Influence of Bose-Einstein Statistics on the Antiproton-Proton Annihilation Process,” Phys. Rev. 120, 300 (1960).
- Adler et al. (2004a) S. S. Adler et al. (PHENIX Collaboration), “Bose-Einstein Correlations of Charged Pion Pairs in Au+Au Collisions at =200 GeV,” Phys. Rev. Lett. 93, 152302 (2004a).
- Pratt (2009) S. Pratt, “Resolving the Hanbury Brown Twiss Puzzle in Relativistic Heavy Ion Collisions,” Phys. Rev. Lett. 102, 232301 (2009).
- Afanasiev et al. (2009a) S. Afanasiev et al. (PHENIX Collaboration), “Charged Kaon Interfrometrci Probes of Space-Time Evolution in Au+Au collisions at =200 GeV,” Phys. Rev. Lett. 103, 142301 (2009a).
- Adamczyk et al. (2013) L. Adamczyk et al. (STAR Collaboration), “Freeze-out dynamics via charged kaon femtoscopy in =200 GeV central Au+Au collisions,” Phys. Rev. C 88, 034906 (2013).
- Szymanski et al. (2013) M. P. Szymanski et al. (ALICE Collaboration), “Mesonand baryon femtoscopy in heavy-ion collisions at ALICE,” Nucl. Phys. A 904-905, 447c–450c (2013).
- Sullivan et al. (1994) J. P. Sullivan, M. Berenguer, D. E. Fields, B. V. Jacak, M. Sarabura, J. Simon-Gillo, H. Sorge, H. van Hecke, and S. Pratt, “Calculations of Bose-Einstein Correlations from Relativistic Quantum Molecular Dynamics,” Nucl. Phys. A 566, 531c–534c (1994).
- Sullivan et al. (1993) J. P. Sullivan, M. Berenguer, B. V. Jacak, , S. Pratt, M. Sarabura, J. Simon-Gillo, H. Sorge, and H. van Hecke, “Bose-Einstein Correlations of Pion Pairs and Kaon Pairs from Relativistic Quantum Molecular Dynamics,” Phys. Rev. Lett. 70, 3000 (1993).
- Lisa et al. (2000) M. A. Lisa et al. (E895 Collaboration), “Azimuthal dependnece of pion interferometry at th AGS,” Phys. Lett. B 496, 1 (2000).
- Adamov’a et al. (2008) D. Adamov’a et al. (CERES Collaboration), “Azimuthal dependence of pion source radii in Pb+Au collisions at 158 A GeV/,” Phys. Rev. C 78, 064901 (2008).
- Adams et al. (2004) J. Adams et al. (STAR Collaboration), “Azimuthally Sensitive Hanbury Brown-Twiss Interferometry in Au+Au Collisions at =200 GeV,” Phys. Rev. Lett. 93, 012301 (2004).
- Adare et al. (2014) A. Adare et al. (PHENIX Collaboration), “Azimuthal-angle dependence of charged-pion-interferometry measurements with respect to 2nd- and 3rd- event planes in Au+Au collisions at =200 GeV,” Phys. Rev. Lett. 112, 222301 (2014).
- Adcox et al. (2003) K. Adcox et al. (PHENIX Collaboration), “PHENIX detector overview,” Nucl. Instrum. Methods Phys. Res., Sect. A 499, 469 (2003).
- Allen et al. (2003) M. Allen et al. (PHENIX Collaboration), “PHENIX inner detectors,” Nucl. Instrum. Methods Phys. Res., Sect. A 499, 549 (2003).
- Richardson et al. (2011) E. Richardson et al. (PHENIX Collaboration), “A reaction plane detector for PHENIX at RHIC,” Nucl. Instrum. Methods Phys. Res., Sect. A 636, 99 (2011).
- Adare et al. (2012) A. Adare et al. (PHENIX Collaboration), “Deviation from quark number scaling of the anisotropy parameter v2 of pions, kaons, and protons in Au+Au collisions at =200 GeV,” Phys. Rev. C 85, 064914 (2012).
- Aphecetche et al. (2003) L. Aphecetche et al. (PHENIX Collaboration), “PHENIX calorimeter,” Nucl. Instrum. Methods Phys. Res., Sect. A 499, 521 (2003).
- Adare et al. (2013) A. Adare et al., “Spectra and ratios of identified particles in Au+Au and +Au collisions at GeV,” Phys. Rev. C 88, 024906 (2013).
- Pratt (1986) S. Pratt, “Coherence and Coulomb effects on pion interferometry,” Phys. Rev. D 33, 72 (1986).
- Bertsch et al. (1988) G. Bertsch, M. Gong, and M. Tohyama, “Pion interferometry in ultra relativistic heavy-ion collisions,” Phys. Rev. C 37, 1896 (1988).
- Bowler (1991) M. G. Bowler, “Coulomb corrections to Bose-Einstein corrections have been greatly exaggerated,” Phys. Lett. B 270, 69 (1991).
- Sinyukov et al. (1998) Y. M. Sinyukov, R. Lednickya, S. V. Akkelinb, J. Plutaa, and B. Erazmus, “Coulomb corrections for interferometry analysis of expanding hadron systems,” Phys. Lett. B 432, 248 (1998).
- Afanasiev et al. (2009b) S. Afanasiev et al. (PHENIX Collaboration), “Systematic studies of elliptic flow measurements in Au+Au collisions at =200 GeV,” Phys. Rev. C 80, 024909 (2009b).
- Poskanzer and Voloshin (1998) A. M. Poskanzer and S. A. Voloshin, “Methods for analyzing anisotropic flow in relativistic nuclear collisions,” Phys. Rev. C 58, 1671 (1998).
- Retière and Lisa (2004) F. Retière and M. A. Lisa, “Observable implications of geometrical and dynamical aspects of freeze-out in heavy ion collisions,” Phys. Rev. C 70, 044907 (2004).
- Alt et al. (2008) C. Alt et al. (NA49 Collaboration), “Bose-Einstein correlations of pairs in central Pb+Pb collisions at 20, 30, 40, 80, and 158 GeV,” Phys. Rev. C 77, 064908 (2008).
- Adams et al. (2005b) J. Adams et al. (STAR Collaboration), “Pion Interferometry in Au+Au Collisions at =200 GeV,” Phys. Rev. C 71, 044906 (2005b).
- Y. M. Sinyukov, V. M. Shapoval, private communication; I. A. Karpenko and Y. M. Sinyukov and and K. Werner (2013) Y. M. Sinyukov, V. M. Shapoval, private communication; I. A. Karpenko and Y. M. Sinyukov and and K. Werner, “Uniform description of bulk observables in the hydrokinetic model of A+A collisions at the BNL Relativistic Heavy Ion Collider and the CERN Large Hadron Collider,” Phys. Rev. C 87, 024914 (2013).
- P. Boz̀ek (2014) P. Boz̀ek, “Azimuthally sensitive femtoscopy in event-by-event hydrodynamics,” Phys. Rev. C 89, 044904 (2014).
- M. Csanád and T. Csörgő (2008) M. Csanád and T. Csörgő, “Kaon HBT radii from perfect fluid dynamics using the Buda-Lund model,” Acta Phys. Polon. Supp. 1, 521–524 (2008).
- I. A. Karpenko and Y. M. Sinyukov (2010) I. A. Karpenko and Y. M. Sinyukov, “Kaon and pion femtoscopy at the highest energies available at the BNL Relativistic Heavy Ion Collider (RHIC) in a hydrokinetic model,” Phys. Rev. C 81, 054903 (2010).
- Shapoval et al. (2014) V. M. Shapoval, P. Braun-Munzinger, I. A. Karpenko, and Y. M. Sinyukov, “Femtoscopy correlations of kaons in Pb+Pb collisions at LHC within hydrokinetic model,” Nucl. Phys. A 929, 1 (2014).
- Akkelin and Sinyukov (1996) S. V. Akkelin and Y. M. Sinyukov, “The HBT-interferometry of expanding inhomogeneous sources,” Z. Phys. C 72, 501 (1996).
- Beringer et al. (2012) J. Beringer et al. (Particle Data Group Collaboration), “Review of Particle Physics (RPP),” Phys. Rev. D 86, 010001 (2012).
- Frodermann et al. (2007) E. Frodermann, R. Chatterjee, and U. Heinz, “Evolution of pion HBT radii from RHIC to LHC: Predictions from ideal hydrodynamics,” J. Phys. G: Nucl. Part. Phys. 34, 2249 (2007).
- Heinz et al. (2002) U. Heinz, A. Hummel, M. A. Lisa, and U. A. Wiedemann, “Symmetry constraints for the emission angle dependence of Hanbury-Brown-Twiss radii,” Phys. Rev. C 66, 044903 (2002).
- E. Schnedermann and J. Sollfrank and U. Heinz (1993) E. Schnedermann and J. Sollfrank and U. Heinz, “Thermal phenomenology of hadrons from 200A GeV S+S collisions,” Phys. Rev. C 48, 2462 (1993).
- Adler et al. (2004b) S. S. Adler et al. (PHENIX Collaboration), “Identified charged particle spectra and yields in Au+Au collisions at =200 GeV,” Phys. Rev. C 69, 034909 (2004b).
- (49) A. Adare et al. (PHENIX Collaboration), “Systematic Study of Azimuthal Anisotropy in Cu+Cu and Au+Au Collisions at =62.4 and 200 GeV,” ArXiv:1412.1043; submitted to Phys. Rev. C.
- Adler et al. (2005) S. S. Adler et al. (PHENIX Collaboration), “Production of mesons at mid rapidity in =200 GeV Au+Au collisions at relativistic energies,” Phys. Rev. C 72, 014903 (2005).
- P. Boz̀ek (2012) P. Boz̀ek, “Flow and interferometry in (3+1)-dimensional viscous hydrodynamics,” Phys. Rev. C 85, 034901 (2012).