pulsars: individual (GX 3041) — stars: neutron — X-rays: binaries
Luminosity and spin-period evolution of GX 3041 during outbursts from 2009 to 2013 observed with the MAXI/GSC, RXTE/PCA, and Fermi/GBM
Abstract
A report is made on the luminosity and pulse-period evolution of the Be binary X-ray pulsar, GX 3041, during a series of outbursts from 2009 to 2013 observed by MAXI/GSC, RXTE/PCA, and Fermi/GBM. In total, twelve outbursts repeated by 132.2 days were observed, which is consistent with the X-ray periodicity of this object observed in the 1970s. These 12 outbursts, together with those in the 1970s, were found to all recur with a well defined period of 132.1890.02 d, which can be identified with the orbital period. The pulse period at s, obtained from the RXTE/PCA and Fermi/GBM data, apparently exhibited a periodic modulation synchronized with the outburst period, suggesting the pulsar orbital motion, which is superposed on a secular spin-up trend throughout the entire active phase. The observed pulse-period changes were successfully represented by a model composed of the binary orbital modulation and pulsar spin up caused by mass accretion through an accretion disk. The orbital elements obtained from the best-fit model, including the projected orbital semi-major axis light-s and an eccentricity , are typical of Be binary X-ray pulsars.
1 Introduction
X-ray binary pulsars (XBPs) are systems consisting of magnetized neutron stars and mass-donating stellar companions. According to the type of the companion, they are classified into several subgroups, including Super Giant XBPs and Be XBPs as major members (e.g. [Reig (2011)]). Since these neutron stars are strongly magnetized, the matter flows from the companion are dominated by the magnetic pressure inside the Alfven radius, and are then funneled onto the magnetic poles along the magnetic field lines. Since the accreting matter transfers its angular momentum at the Alfven radius to the neutron star, the spin-up rate and the mass accretion rate (i.e. the X-ray luminosity) of an XBP are thought to be closely correlated (e.g. [Ghosh & Lamb (1979)]). The issue is relevant to the evolution scenario of XBPs and their magnetic fields, and thus very important. Although several observational results to examine the relation have been reported so far (e.g. [Finger et al. (1996), Reynolds et al. (1996), Bildsten et al. (1997)]), the question is still unsettled because we need to select an object with a well-determined magnetic-field strength and large luminosity swings. Furthermore, we need to disentangle intrinsic period changes from orbital Doppler effects.
GX 3041 is a Be XBP discovered by X-ray balloon observations in 1967 (e.g. [McClintock et al. (1971)]). The source shows X-ray properties typical of Be/X-ray binaries; large flux variations ([Ricker et al. (1973)]), the -s coherent pulsation ([Huckle et al. (1977)]; [McClintock et al. (1977)]), a hard X-ray spectrum represented by a power-law with an absorption column density cm-2 and a photon index 2 up to 40 keV (White et al., 1983), and periodic flaring events, namely outbursts, separated by days presumably attributed to the binary orbital period (Priedhorsky & Terrell, 1983). The optical counterpart was identified with a Be star (Mason et al., 1978), which is characterized by double-peak Hα emission, strong HeI and OI absorptions (Thomas et al., 1979; Parkes et al., 1980), and photometric variability (Menzies et al., 1981). Based on these line features, Corbet et al. (1986) suggested that the circumstellar disk is edge-on (). From the visual extension ( mag.), the source distance is estimated to be kpc (Parkes et al., 1980). However, the binary orbital elements have not been determined, yet.
Since the last outburst was observed in the 1980s (Pietsch et al., 1986), the source had been in a quiescent state with no significant X-ray emission for 28 years. Its long absence was broken by the hard X-ray detection with INTEGRAL in 2008 June (Manousakis et al., 2008). Since then, continuous X-ray monitoring with the MAXI GSC and the Swift BAT has detected nine outbursts every d, from 2009 November to 2012 November (Yamamoto et al., 2009; Krimm et al., 2010; Mihara et al., 2010a; Nakajima et al., 2010; Kühnel et al., 2010; Yamamoto et al., 2011a, b; Nakajima et al., 2012). Across these multiple outbursts, the 2–20 keV MAXI GSC intensity varied nearly by two orders of magnitude. Suzaku, RXTE and INTEGRAL observations, performed at a bright outburst phase, revealed a cyclotron resonance scattering feature (CRSF) at around 54 keV (Yamamoto et al., 2011c; Klochkov et al., 2012b). The estimated surface magnetic field, G where represents the gravitational redshift, is almost the highest among those of XBPs of which the CRSF signature is significantly detected. In the 2010 August outburst, the barycentric pulsation period was 275.37-275.46 s, which suggests that the pulsar was spun down by s during the 28 years of quiescence (Devasia et al., 2011; Yamamoto et al., 2011c). The timing analysis of RXTE data revealed the complex pulse-profile dependence on the energy band as well as the luminosity, and the quasi-periodic oscillation at Hz (Devasia et al., 2011). The period and pulsed flux have also been monitored by the Fermi GBM pulsar project (Finger & Jenke, 2013). All these data thus provide us with a valuable opportunity to study the relation between the luminosity and spin period of the XBP.
In this paper, we analyze the X-ray outburst light curve of GX 3041 during the active period from 2009 to 2013 obtained with the MAXI GSC, and the pulse period variations derived from the RXTE/PCA and Fermi/GBM data. Our goal is to separate the orbital doppler effects and the intrinsic pulse-period change. The observation and data reduction are described in section 2, while the data analysis and results in section 3. We discuss the results in section 4.
2 Observation
2.1 MAXI monitoring
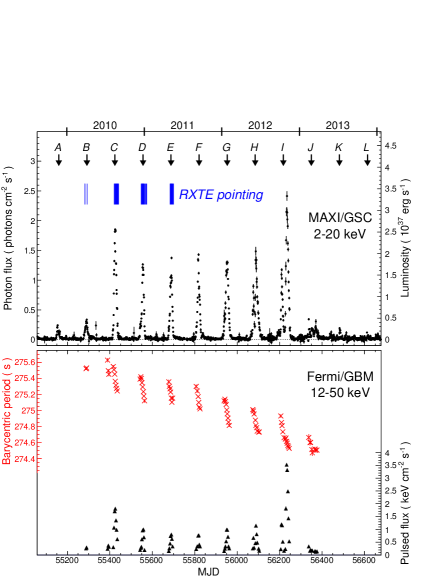
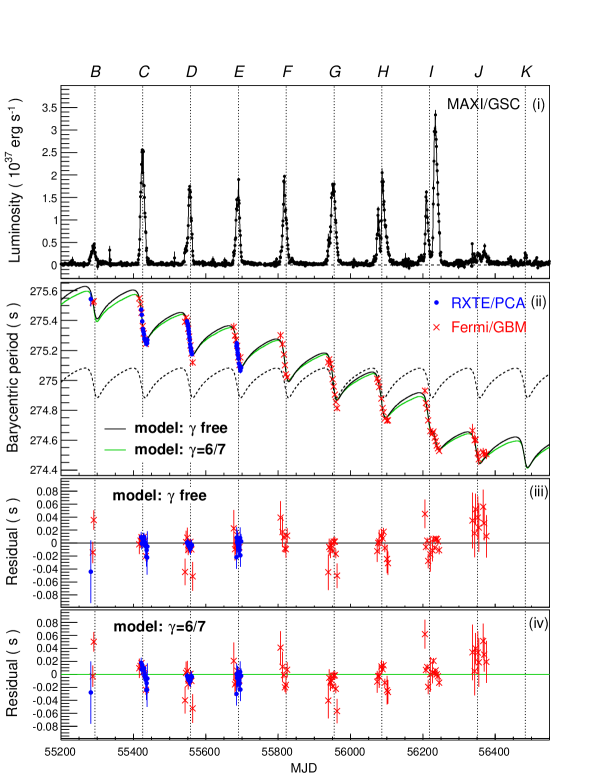
Since the MAXI (Monitor of All-sky X-ray Image; Matsuoka et al. (2009)) experiment onboard the ISS (International Space Station) started its operation in 2009 August, the GSC (Gas Slit Camera; Mihara et al. (2011)), one of the two MAXI detectors, has been scanning almost the whole sky every 92-minute orbital cycle in the 2–30 keV band. We utilized archived GSC light-curve data for GX 3041 in 2–4 keV, 4–10 keV and 10–20 keV bands, which are processed with a standard procedure (Sugizaki et al., 2011) by the MAXI team and available from the MAXI web site111http://maxi.riken.jp. Figure 1 top shows the 2–20 keV MAXI/GSC light curve from 2009 August to 2013 December in 1-d time bin. It clearly reveals the recurrent outburst activity by a d interval, which is consistent with the d periodicity found in the 1971–1972 outbursts with Vela 5B (Priedhorsky & Terrell, 1983). Figure 1 covers 12 epochs of the outbursts predicted from the 132.2-d period cycle, which we consecutively name A, B, C, …, and L. The outburst I in 2012 August reached photons cm2 s-1 ( Crab) in the 2–20 keV band, which is the highest among the flaring events that have ever been observed from this source.
If the source distance of kpc, the energy spectrum of a cutoff power-law with a photon index and an e-fold energy keV (Yamamoto et al., 2011c) are employed, the observed flux of 1 photon cm-2 s-1 in the 2–20 keV band corresponds to the bolometric luminosity of erg s-1 in an isotropic emission source. We use the conversion factor to estimate the luminosity form the MAXI/GSC data, hereafter. The scale of the estimated luminosity is shown at the right-hand ordinate of the light-curve (figure 1 top).
2.2 Fermi GBM data
The GBM (Gamma-ray Burst Monitor; Meegan et al. (2009)) onboard the Fermi Gamma-Ray Space Telescope is an all-sky instrument, sensitive to X-rays and gamma-rays with energies between 8 keV and 40 MeV. The Fermi GBM pulsar project222http://gammaray.nsstc.nasa.gov/gbm/science/pulsars/ provides results of timing analysis of a number of positively detected X-ray pulsars, including their pulse periods and pulsed fluxes (Finger et al., 2009; Camero-Arranz et al., 2010). We utilized the archived results of GX 3041 to systematically investigate the long-term variations of the pulse timing from 2010 to 2013.
Figure 1 (bottom) shows time variations of the barycentric pulse period and the pulsed photon flux in the 25–50 keV band of GX 3041, as made publicly available by the project. The pulsed emission was detected over bright phases of the nine consecutive outbursts from B to J. The period range of 275.2–275.6 s during the outburst C is consistent with the results of 275.37 s from the RXTE data (Devasia et al., 2011) and 275.46 s from the Suzaku data (Yamamoto et al., 2011c), both obtained in the same outbursts.
2.3 RXTE observations and data reduction
The RXTE observations of GX 3041 were performed on the outbursts B, C, D, and E, using the Proportional Counter Array (PCA: Jahoda et al. (2006)) operating in 3–60 keV and the High-Energy X-ray Timing Experiment (HEXTE: Rothschild et al. (1998)) providing 20–250 keV data. As indicated in figure 1 (top), total 71 observations covered the outbursts C, D, and E with a high frequency of almost once per day, each with an exposure of 0.5–18 ks. We analyzed the PCA data to study the pulse timing properties with photon statistics and time resolution better than those available with other instruments.
Data reduction and analysis were performed using the standard RXTE analysis tools released as a part of HEASOFT 6.14, and the CALDB files of version 20111205 provided by NASA/GSFC. All the data were first screened with the standard selection criteria, that the spacecraft pointing offset should be smaller than 0.02, the earth-limb elevation angle be larger than 10∘, and the time since the last SAA passage be longer than 30 minutes. We used data only from the top layer of the PCU-2 unit, which is the best calibrated among all PCUs. In the timing analysis, we used the reduced data with Good-Xenon data mode, Generic event-data mode (E_125us_64M_0_1s), or Generic binned-data mode (B_250ms_128M_0_254), which has a time resolution better than 0.25 s.
3 Analysis
3.1 Outburst intervals and orbital period
To quantify the outburst periodicity, we determined their peak epochs by fitting each profile with a Gaussian function. Since some of the peaks have asymmetric profiles and hence cannot be approximated by a single Gaussian function, the fit was performed within a narrow span of d around each peak so that the fit is reasonably accepted. If outburst has multiple peaks, their peak epochs were determined separately. Table 3.1 summarizes the obtained epochs, fluxes, and the luminosities estimated from the typical energy spectrum at the peaks.
X-ray outbursts of Be X-ray binaries are known to be largely classified into normal-type (type-I) and giant-type (type-II) ones (e.g. review by Reig (2011)). The normal outbursts emerge near the pulsar periastron passage and their peak luminosity reaches erg s-1, while the giant ones may appear at any orbital phase and can be more significantly luminous than the other type of events. The regular periodicity of the observed outbursts suggests that they are mostly categorized into the normal type. Actually, the first seven outbursts from A to G, with a single-peak profile, satisfy all the normal-type conditions. Similarly, the outbursts observed in 1971–1972 with Vela 5B also exhibited the same periodicity and their peak fluxes were in the same level (Priedhorsky & Terrell, 1983). Therefore, they should be categorized into the normal type, too.
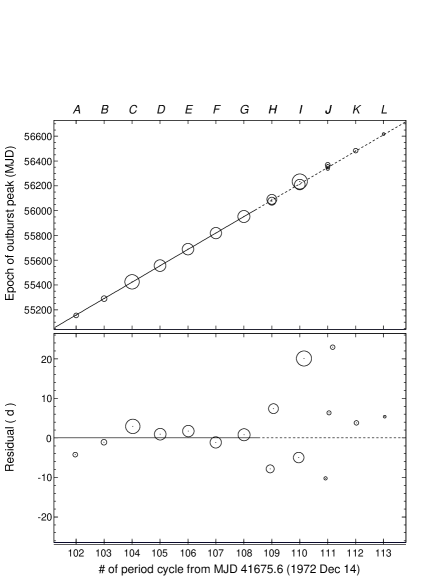
To refine the orbital period, we extrapolated the periodicity of the 2009–2012 outbursts (A to G) to that in 1971–1972 assuming that they are at the same orbital phase. The top panel of figure 2 shows a plot of the peak epochs in 2009–2013 against the number of 132.2-d cycles from the initial epoch of MJD 41675.6 (1972 December 14) in Vela 5B era. Thus, the epochs of (MJD 41675.6) and 102–108 (outbursts A to G) line up linearly, around which the data of 102–108 scatter by 2.1 d in the standard deviation. We employed this deviation as the uncertainty in each data, and fitted the epochs with a linear function to obtained the best period estimate of and the initial peak epoch of MJD with 1- error. The best-fit function,
| (1) |
is drawn together on the data at the top panel of figure 2, and the bottom panel shows the data-to-model residuals. Their values are listed in table 3.1.
As presented in figure 2 and table 3.1, we also extended the best-fit linear function to (outburst L). The residuals suggest that the outburst periodicity changed after (outburst H), as investigated below.
ccrccc
Outburst peaks of the GX 3041 active period in 2009–2013 observed with MAXI GSC
OutID† Epoch Residual‡ Peak flux§ Luminosity#
(MJD) ( d ) ( photons cm2 s-1 ) ( erg s-1 )
\endfirstheadOutID† Epoch Residual‡ Peak flux§ Luminosity#
(MJD) ( d ) ( photons cm2 s-1 ) ( erg s-1 )
\endhead∗: Second or third highest peak in a outburst cycle
†: Outburst ID designated by the number of period cycles (figure 1)
‡: Residual of peak epoch from the best-fit period cycle of equation (1)
§: Peak photon flux in 2–20 keV band in units of photons cm-2 s-1
#: Bolometric luminosity estimated from the 2–20 keV photon flux
\endfoot∗: Second or third highest peak in a outburst cycle
†: Outburst ID designated by the number of period cycles (figure 1)
‡: Residual of peak epoch from the best-fit period cycle of equation (1)
§: Peak photon flux in 2–20 keV band in units of photons cm-2 s-1
#: Bolometric luminosity estimated from the 2–20 keV photon flux
\endlastfootA 0.27
B 0.38
C 2.51
D 1.63
E 1.57
F 1.57
G 1.75
H∗ 0.78
H 1.19
I∗ 1.35
I 2.76
J∗ 0.13
J∗ 0.21
J 0.26
K 0.24
L 0.06
3.2 Evolution of outburst orbital profile
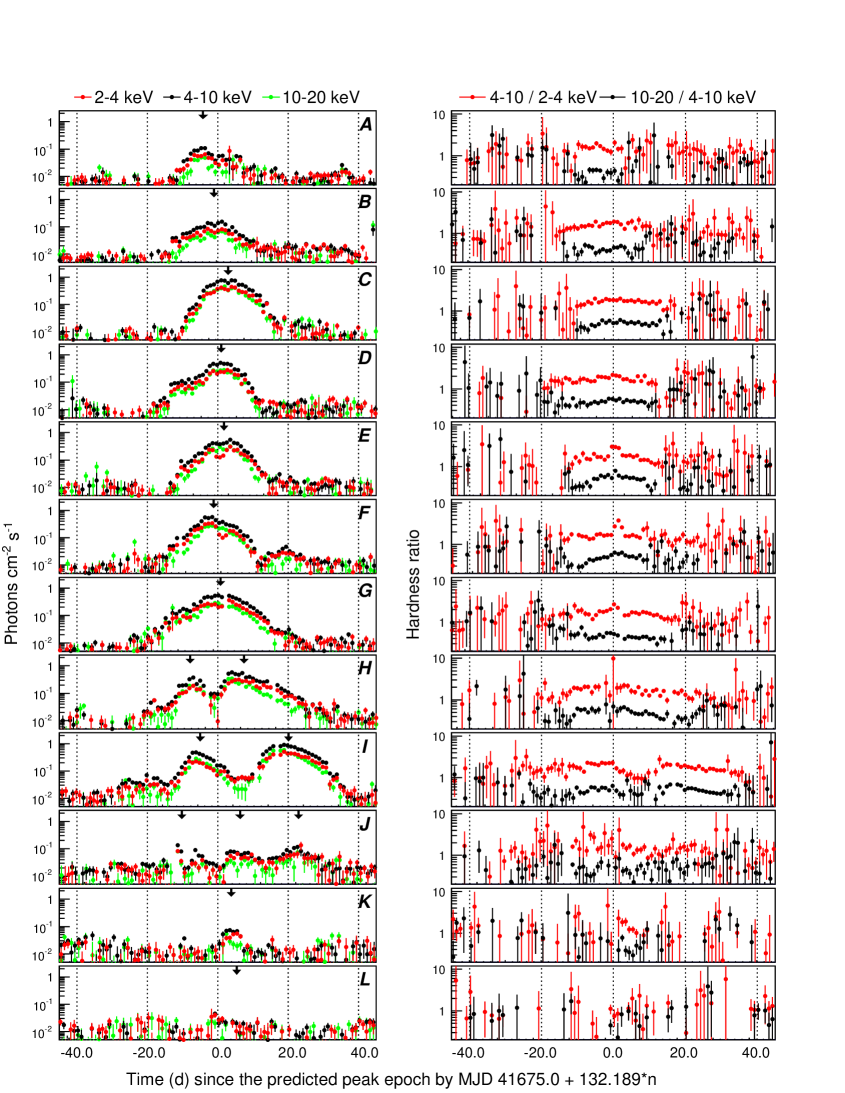
Figure 3 left shows expanded three-color MAXI/GSC light curves of the individual outbursts, as a function of time from the peak predicted by equation (1). The hardness ratios are presented in the right panels.
The light curves of the outbursts A to G in figure 3 (left) reconfirm that their peak epoch agrees, within a scatter of 2.1 d with the prediction of the best-fit cycle. However, these profiles vary considerably from cycle to cycle. While the outburst D has a slight enhancement over the symmetrical profile prior to the peak, the outbursts F and G have a subsequent small peak after the main peak.
As expected from figure 1, the outbursts H and I, the latter being the brightest, clearly deviate in figure 2 and figure 3 form equation (1), because they both show a double-peaked profiles. This suggests that these two, or at least outburst I, are possibly the giant outbursts. In the outburst J, no distinct main peak is seen and a low-level activity continued for 40 days.
During bright outburst phases, the two hardness ratios in figure 3 (right) slightly change with a positive correlation to the flux. In addition, the (4–10 keV / 2–4 keV) hardness ratio exhibits sharp increases at the peak in the outbursts E, F, and G. They correspond to dips in the softest light curve (red), and thus can be attributed to an increase of the absorption column density.
3.3 Pulse period changes
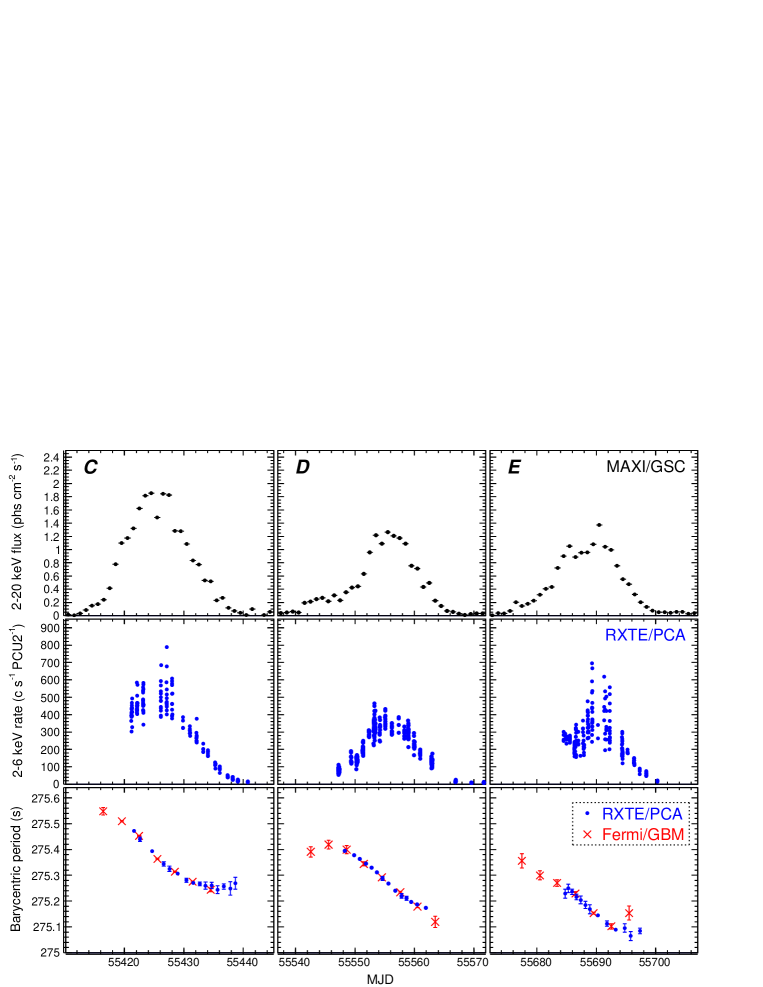
To investigate the change in the pulse period with a better precision and sensitivity than those available with the Fermi GBM shown in red in figure 1 (bottom), we analyzed the RXTE PCA data, which samples the outbursts C, D, and E on the almost daily basis. The data for the outburst C has been already analyzed by Devasia et al. (2011) and the results revealed a complex pulse profile that depends on the energy and the luminosity. We performed the timing analysis taking account of these properties as follows. Figure 4 top and middle panels show the MAXI/GSC 2–20 keV light curves in 1-d time bin, and those of the 2–6 keV RXTE/PCA count rates per 272 s, approximately equal to the pulse period. The large variability in the PCA count rate around the outburst peaks represent the variation component other than the 275-s pulsation, as Devasia et al. (2011) reported in the outburst C.
We performed the pulse period search by the folding method using efsearch in XRONOS, for the PCA data after the barycentric correction was applied with faxbary in FTOOL. To optimize the period determination accuracy, the folding analysis was carried out by combining data taken within each interval up to 2 days. The energy band was limited to 2–6 keV because the sharp dip structure in the pulse profile below 8 keV (Devasia et al., 2011). The errors on the obtained pulse period was estimated by the method of Larsson (1996) using the folded pulse profile with 64 phase bins.
Figure 4 (bottom) show the obtained pulse period against the observation epochs, where the results of the Fermi GBM pulsar project, the same as in figure 1, are plotted together. The RXTE/PCA and the Fermi/GBM results are consistent with each other.
3.4 Determining the binary orbital elements
The pulse-period evolution in figures 1 and 4 is characterized by two distinct effects. One is cyclic modulation synchronized with the 132.2 d outburst period, considered as due to the orbital Doppler effects. The other is a secular spin-up trend over the 3 years, obviously due to the accretion torque. Thus, the observed pulse-period evolution is considered to be a complex composite of these two effects. Since both of them are supposed to depend on the orbital phase, it is not straightforward to separate them. Hence, we construct a semi-empirical model representing the two effects, and then fit it to the data, in an attempt to simultaneously determine the orbital elements and the luminosity-dependent intrinsic pulse period change.
Be XBPs are known to exhibit spin-up episodes during bright outburst phases (e.g. Bildsten et al. (1997)). This is naturally explained by an increase in the accretion rate, and the associated transfer of the angular momentum to the neutron star via disc-magnetosphare interactions. In the classical theoretical model by Ghosh & Lamb (1979), the pulsar spin-up rate (s yr-1) is given by
| (2) |
where , , , , , and are the magnetic dipole moment of the neutron star in units of G cm3, radius in cm, mass in , moment of inertia in g cm2, spin period in s, and the luminosity in erg s-1, respectively, while is a dimensionless torque that depends on the fastness parameter , defined by the ratio of the angular velocity of the pulsar spin to that of the Kepler rotation of accreting matter at around the Alfven radius.
In the application of equation (2), GX 3041 is particularly suited for several reasons. First, the value of can be accurately estimated from the CRSF detection at 54 keV, which implies the surface magnetic field, G (Yamamoto et al., 2011c). If the canonical neutron-star mass and radius cm are assumed, the gravitational redshift is 0.3, and then is calculated as
| (3) |
(Wasserman & Shapiro, 1983). Second, a continuous record of is available from the MAXI GSC light curve; we calculate it with the conversion factor as described in section 2.1. Furthermore, can be regarded approximately as a constant from the long spin period, s, such that (Ghosh & Lamb, 1979). We also employ calculated from its approximate equation with and given by Ravenhall & Pethick (1994) as
| (4) |
Combining these pieces of information, equation (2) yields
| (5) |
Equation (2) implies that the spin-up rate follows the luminosity as . The relation has been calibrated with actual X-ray data (Reynolds et al., 1996; Bildsten et al., 1997). Besides this, the comparison of absolute spin-up rates with equation (2) has been hampered by a large uncertainty in the bolometric luminosity correction, which is in turn due to beaming effects (e.g. Bildsten et al. (1997); Wilson et al. (2002)). We hence employ a spin-up model expressed by in which the power-law index and the constant coefficient are treated as free parameters.
XBPs are also known to spin down during the quiescence due to the propeller effects. In fact, GX 3041 exhibited a spin down by s for the 28 years of quiescence from 1980 to 2008, with an average period derivative of s s-1. The rate, though much smaller than the spin-up rate during bright phases ( s s-1), may not be negligible. We accounted its contribution with a constant spin-down parameter, , added to as an offset.
By using the spin-up and spin-down models discussed above, the intrinsic pulsar-spin period is expressed as
| (6) | |||||
| (7) |
where we set the time origin at the periastron passage in the outburst C and denote the pulse period at as .
The period modulation due to the binary motion, can be calculated using the binary orbital elements, which consists of the orbital period , the eccentricity , the projected semi-major axis , the argument of the periastron , and the epoch of periastron passage which we identified with defined above. The pulsar orbital velocity along the line of sight is given as
| (8) |
where is a parameter called “true anomaly” describing the motion on the elliptical orbit, and calculated from the Kepler’s equation. The observed barycentric period, , is then expressed by
| (9) | |||||
We applied the model consisting of equations (7)-(9) to the observed barycentric periods obtained from the RXTE/PCA timing analysis in section 3.3 and Fermi/GBM archival products. The model involves nine free parameters; , , , and in equation (7), and orbital elements in equation (8). We utilized the luminosity calculated from the MAXI/GSC 2–20 keV light curve in 1-d time bin, as described in section 2.1. The errors associated with the determinations propagate into those of equation (7), but this gives 1- uncertainties only by s, which is smaller than those in the individual pulse-period measurements, s. We fixed the orbital period at 132.189 d derived from the outburst cycle over 28 years in section 3.1, and examine the fit with fixted at the theoretical value of 6/7 or free.
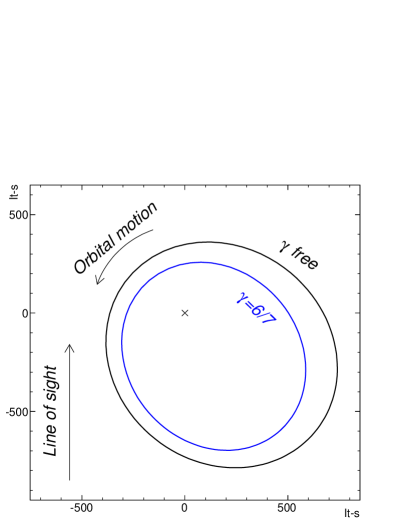
The model has been found to represent the data well. Figure 5 shows the results of those model fits (with and free), and table 3.4 summarizes the obtained best-fit parameters. The obtained epoch of the periastron of the outburst C, (MJD), agrees with that at the outburst flux peak (table 3.1) within the uncertainty of the peak-epoch periodicity, d. Comparing the two fit results, the fit with free has a lower by for a decrease of only by one in the degree of freedom (dof). In figure 6, pulsar binary orbits suggested in the two fitting models, are illustrated.
Best-fit orbital parameters Model Parameter : free ( d ) 132.189 (fix) ( lt-s ) ( MJD ) ( s ) ( degree ) ( s s-1 ) (fix) ( ) / dof 276.3 / 103 168.0 / 102 {tabnote} All errors represent 1- confidence limit of the statistical uncertainty.
4 Discussion
4.1 Lumonosity - spin-up relation
As a result of the model fit to the pulse-period evolution, we successfully calibrate the relation between the the luminosity and the spin-up rate, , which is considered to reflect the accretion manner. According to the model of Ghosh & Lamb (1979), the power-law index becomes 6/7 in a disk accretion and 1 in a wind accretion. The best-fit obtained from the model of free was , which is significantly larger than in the disk accretion. Meanwhile, the present result agrees with those of other typical Be XBPs, A 053526 (Finger et al., 1996; Camero-Arranz et al., 2012), EXO 2030375 (Reynolds et al., 1996; Wilson et al., 2002), and 2S 1417-624 (Finger et al., 1996; İnam et al., 2004). As Wilson et al. (2002) suggested, the result of may imply the effect of either the spin down or the wind accretion during the low luminosity periods. In fact, the fit with yielded the significant spin-down of s s-1 during the outburst intermissions. The rate is consistent with the average period derivative of s s-1 during the 1980-2008 quiescence.
Comparing the two model-fit results ( and free), goodness of fits ( / dof) certainly prefers the one with free. However, neither is acceptable statistically, As seen in figure 5, the difference between the two models is mostly in the outburst intermission in which the period data are not available. Therefore, it is hard to conclude which model better represents the real situation, from the present result. The problem will be solved if the pulse period throughout the entire orbital phase is obtained.
From the best-fit parameters, we also obtained the normalization factor of the absolute spin-up rate, , compared to that predicted in the model of Ghosh & Lamb (1979), which is s d-1 as derived in equation (5) in this source. The ratio, in both the two model ( free and ), is significantly smaller than unity, like in some other Be XBPs (Wilson et al., 2002). This discrepancy is reasonably explained by the uncertainty in the luminosity estimate. We calculate the luminosity from the observed fluxes sampled by MAXI/GSC scan survey in 1-d time bin assuming that the source emission is isotropic, as described in section 2.1. Because the observed flux is pulsating, the source emission is not completely isotropic. The obtained result corresponds to the beaming effect by a factor .
4.2 Binary properties as Be/X-ray binary pulsars
From the obtained orbital elements, the mass function is calculated as
| (10) |
where is the gravitational constant, and is the mass of the companion star. Table 3.4 yields if , and if is left free. Assuming the mass of the pulsar to be , the condition of constrains the companion mass as for and for . This agrees with the typical Be-star mass. The system is actually suggested to be edge-on () from the emission and absorption lines in the optical spectra (Corbet et al., 1986).
4.3 Evolution of outburst light-curve profiles and Be disk
The outburst orbital profile is considered to reflect the spatial extent of the circumstellar disk around the Be star on the pulsar orbit. During the 3.5 years of active period from 2009 October to 2012 November, the profile changed through a series of normal outbursts (A to G), giant outbursts with a large peak luminosity (H and I), and decay phase (J to L). This evolution behavior vary much resembles those of other Be X-ray binaries, including A 053526 (Camero-Arranz et al., 2012; Nakajima et al., 2014), and GRO J1008-57 (Kühnel et al., 2013; Yamamoto et al., 2014). Therefore, the same physical mechanism is considered to be working in those systems. To explain this, a couple of scenarios, including the global one-armed oscillation and the precession of the Be disk, have been proposed (Nakajima et al. (2014) and references therein). The detailed modeling is out of the scope of the present paper.
We thank all the ISS/MAXI team members for their dedicated work to enable the science mission operation. We also thank the Fermi/GBM pulsar project for providing the useful results to the public. This research has made use of RXTE data obtained from the High Energy Astrophysics Science Archive Research Center (HEASARC) provided by NASA/GSFC; The present work is partially supported by the Ministry of Education, Culture, Sports, Science and Technology (MEXT), Grant-in-Aid No. 24340041 and 25400239.
References
- Bildsten et al. (1997) Bildsten, L., et al. 1997, ApJS, 113, 367
- Camero-Arranz et al. (2010) Camero-Arranz, A., Finger, M. H., Ikhsanov, N. R., Wilson-Hodge, C. A., & Beklen, E. 2010, ApJ, 708, 1500
- Camero-Arranz et al. (2012) Camero-Arranz, A., et al. 2012, ApJ, 754, 20
- Corbet et al. (1986) Corbet, R. H. D., et al. 1986, MNRAS, 221, 961
- Devasia et al. (2011) Devasia, J., James, M., Paul, B., & Indulekha, K. 2011, MNRAS, 417, 348
- Finger et al. (2009) Finger, M. H., et al. 2009, arXiv:0912.3847
- Finger et al. (1996) Finger, M. H., Wilson, R. B., & Chakrabarty, D. 1996, A&AS, 120, 209
- Finger et al. (1996) Finger, M. H., Wilson, R. B., & Harmon, B. A. 1996, ApJ, 459, 288
- Finger & Jenke (2013) Finger, M. H., & Jenke, P. A. 2013, The Astron. Telegram, 4812, 1
- Ghosh & Lamb (1979) Ghosh, P., & Lamb, F. K. 1979, ApJ, 234, 296
- İnam et al. (2004) İnam, S. Ç., Baykal, A., Matthew Scott, D., Finger, M., & Swank, J. 2004, MNRAS, 349, 173
- Huckle et al. (1977) Huckle, H. E., Mason, K. O., White, N. E., Sanford, P. W., Maraschi, L., Tarenghi, M., Tapia, S., 1977, MNRAS, 180, 21P
- Jahoda et al. (2006) Jahoda, K., Markwardt, C. B., Radeva, Y., Rots, A. H., Stark, M. J., Swank, J. H., Strohmayer, T. E., & Zhang, W. 2006, ApJS, 163, 401
- Klochkov et al. (2012b) Klochkov, D., et al. 2012, A&A, 542, L28
- Knigge et al. (2011) Knigge, C., Coe, M. J., & Podsiadlowski, P. 2011, Nature, 479, 372
- Krimm et al. (2010) Krimm, H. A., et al. 2010, The Astron. Telegram, 2538, 1
- Kühnel et al. (2010) Kühnel, M., et al. 2010, The Astron. Telegram, 3087, 1
- Kühnel et al. (2013) Kühnel, M., Müller, S., Kreykenbohm, I., et al. 2013, A&A, 555, A95
- Larsson (1996) Larsson, S. 1996, A&AS, 117, 197
- Manousakis et al. (2008) Manousakis et al., 2008, Astron. Telegram, 1613
- Mason et al. (1978) Mason, K. O., Murdin, P. G., Parkes, G. E. Visvanathan, N., 1978, MNRAS, 184, 45P
- Matsuoka et al. (2009) Matsuoka, M., et al. 2009, PASJ, 61, 999
- Meegan et al. (2009) Meegan, C., et al. 2009, ApJ, 702, 791
- McClintock et al. (1971) McClintock, J. E., Ricker, G. R., Lewin, W. H. G., 1971, ApJ, 166, L73
- McClintock et al. (1977) McClintock, J. E., Rappaport, S. A. Nugent, J. J., Li, F. K., 1977, ApJ, 216, L15
- Menzies et al. (1981) Menzies, J., 1981, MNRAS, 195, 67P
- Mihara et al. (2004) Mihara, T., Makishima, K., & Nagase, F. 2004, ApJ, 610, 390
- Mihara et al. (2010a) Mihara, T., et al. 2010a, The Astron. Telegram., 2779, 1
- Mihara et al. (2010b) Mihara, T., et al. 2010b, The Astron. Telegram., 2796, 1
- Mihara et al. (2011) Mihara, T., et al. 2011, PASJ, 63, 623
- Nakajima et al. (2010) Nakajima, M., et al. 2010, The Astron. Telegram, 3075, 1
- Nakajima et al. (2012) Nakajima, M., et al. 2012, The Astron. Telegram, 4420, 1
- Nakajima et al. (2014) Nakajima, M., et al. 2014, PASJ, 66, 9
- Parkes et al. (1980) Parkes, G.E., Murdin, P.G., Mason, K.O., 1980, MNRAS, 190, 537
- Pietsch et al. (1986) Pietsch, E., Collmar, W., Gottwald, M., Kahabka, P., Ögelman, H., 1986, A&A, 163, 93
- Priedhorsky & Terrell (1983) Priedhorsky, W. C., Terrell, J., 1983, ApJ, 273, 709
- Reig (2011) Reig, P. 2011, Ap&SS, 332, 1
- Ravenhall & Pethick (1994) Ravenhall, D. G., & Pethick, C. J. 1994, ApJ, 424, 846
- Reynolds et al. (1996) Reynolds, A. P., et al. 1996, A&A, 312, 872
- Ricker et al. (1973) Ricker, G. R., McClintock, J. E., Gerassimenko, M., & Lewin, W. H. G. 1973, ApJ, 184, 237
- Rothschild et al. (1998) Rothschild, R. E., et al. 1998, ApJ, 496, 538
- Sugizaki et al. (2011) Sugizaki, M. et al. 2011, PASJ, 63, 635
- Thomas et al. (1979) Thomas, R.M., Morton, D.C., Murdin, P.G., 1979, MNRAS, 188, 19
- Wasserman & Shapiro (1983) Wasserman, I., & Shapiro, S. L. 1983, ApJ, 265, 1036
- White et al. (1983) White, N., Swank, J., & Holt, S. S., 1983, ApJ, 270, 711
- Wilson et al. (2002) Wilson, C. A., Finger, M. H., Coe, M. J., Laycock, S., & Fabregat, J. 2002, ApJ, 570, 287
- Yamamoto et al. (2009) Yamamoto, T., et al. 2009, The Astron. Telegram, 2297, 1
- Yamamoto et al. (2011a) Yamamoto, T., et al. 2011, The Astron. Telegram, 3309, 1
- Yamamoto et al. (2011b) Yamamoto, T., et al. 2011, The Astron. Telegram, 3624, 1
- Yamamoto et al. (2011c) Yamamoto, T., et al. 2011, PASJ, 63, 751
- Yamamoto et al. (2012) Yamamoto, T., et al. 2012, The Astron. Telegram, 3856, 1
- Yamamoto et al. (2014) Yamamoto, T., et al. 2014, PASJ, 66, 59