Rodovia Jorge Amado, km 16, Ilhéus/BA, 45662-900, Brazil 11email: mjvasc@uesc.br 22institutetext: Univ. Grenoble Alpes, IPAG, F-38000 Grenoble, France
CNRS, IPAG, F-38000 Grenoble, France
Investigating the rotational evolution of young, low mass stars using Monte Carlo simulations
Abstract
Context. Young stars rotate well below break-up velocity, which is thought to result from the magnetic coupling with their accretion disk.
Aims. We investigate the rotational evolution of young stars under the disk locking hypothesis through Monte Carlo simulations.
Methods. Our simulations include 280,000 stars, each of which is initially assigned a mass, a rotational period, and a mass accretion rate. The mass accretion rate depends on both mass and time, following power-laws indices 1.4 and -1.5, respectively. A mass-dependent accretion threshold is defined below which a star is considered as diskless, which results in a distribution of disk lifetimes that matches observations. Stars are evolved at constant angular spin rate while accreting and at constant angular momentum when they become diskless.
Results. Starting with a bimodal distribution of periods for disk and diskless stars, we recover the bimodal period distribution seen in several young clusters. The short period peak consists mostly of diskless stars and the long period one is mainly populated by accreting stars. Both distributions, however, present a long tail towards long periods and a population of slowly rotating diskless stars is observed at all ages. We reproduce the observed correlations between disk fraction and spin rate, as well as between IR excess and rotational period. The period-mass relation we derive from the simulations exhibits the same global trend as observed in young clusters only if we release the disk locking assumption for the lowest mass stars. Finally, we find that the time evolution of median specific angular momentum follows a power law index of -0.65 for accreting stars, as expected from disk locking, and of -0.53 for diskless stars, a shallower slope that results from a wide distribution of disk lifetimes. At the end of the accretion phase, our simulations reproduce the angular momentum distribution of the low-mass members of the 13 Myr h Per cluster.
Conclusions. Using observationally-documented distributions of disk lifetimes, mass accretion rates, and initial rotation periods, and evolving an initial population from 1 to 12 Myr, we reproduce the main characteristics of pre-main sequence angular momentum evolution, which supports the disk locking hypothesis.
Key Words.:
Methods: statistical – stars: pre-main sequence – stars: rotation1 Introduction
Several determinations of the rotational properties of young clusters have shown that the stellar period changes as a function of time (e.g., Bouvier 2013, for a review). The distribution of rotational periods of the Orion Nebula Cluster with an age of 2 Myr presents values that range from less than 1 day to days. The older cluster NGC 2547, which is 40 Myr old, shows almost the same amplitude of periods but with lower mass stars (M M⊙) rotating faster in average. Main sequence (MS) stars, like the Sun, rotate much more slowly than young stars.
According to several studies (e.g., Rebull et al. 2006; Cieza & Baliber 2007), during the first few Myr of evolution, stars showing evidence of the presence of disks like infrared excess emission, broad H lines, excess UV emission, etc., rotate slower in average than diskless stars. These observations are explained by the disk locking hypothesis: during the time the star remains attached to the disk, the stellar rotation rate remains constant. As soon as the star loses its disk, it starts to spin-up, due to the expected radius contraction on the Hayashi track. According to Gallet & Bouvier (2013), from the Zero Age Main Sequence (ZAMS) to the MS, the star does not conserve its angular momentum which can be lost via magnetic stellar winds, and eventually all stars end up on the MS with the same angular velocity.
There are, however, some open issues related to this picture. Based on the disk frequency in several young clusters, Mamajek (2009) pointed out that the disk fraction as a function of time falls off exponentially. The mean disk lifetime is expected to be around 2 - 3 Myr, although some results points to longer values (5 - 6 Myr, Bell et al. 2013). Measurements of the mass accretion rate in clusters of different ages point to a dependency with the age of the star and its mass in the form . However, there is no general agreement about the value of the exponents. According to the self-similar accretion theory (Hartmann et al. 1998), the mass accretion rate is independent of the mass and or at least . Several works provide different values for and b. For example, Manara et al. (2012) analyzing a sample of stars in the Orion Nebula Cluster found that varies with the stellar mass, reaching values lower than 1 for . They also obtained that the exponent varies with age, and goes from 1.15 for t 0.8 Myr to 2.43 for t 10 Myr. Spezzi et al. (2012) found and b = 0.82 in star forming regions of the Large Magellanic Cloud while Rigliaco et al. (2011) found b = 1.6 for the Ori region. Venuti et al. (2014) analyzing the accretion and variability of stars in NGC 2264 obtained b = 1.4 0.3. There is some controversy also related to the period - mass relation, i. e., the scarcity of slow rotators among lower mass stars (M M⊙) which is seen, for example, by Henderson & Stassun (2012) in the period - mass diagrams of several clusters. However, neither Affer et al. (2013) for NGC 2264 nor Moraux et al. (2013) for h Persei find any evidence of this relation above 0.4 M⊙.
In this work, we investigate the main variables that can influence the spin rate evolution of a cluster of stars using Monte Carlo simulations and compare the results to observations available in the literature. We randomly assign a mass, a mass accretion rate and an initial period for each star. We control the disk lifetime assuming a mass accretion rate threshold below which the star is considered to be diskless. We run our tests from 1 Myr to 12.1 Myr. In section (2), we explain the main assumptions of the simulations. In section 3, we present and discuss our results. In section 4, we draw our conclusions.
2 The Monte Carlo simulations
In order to calculate the evolution of the rotational period , we assume that a disk star has a constant period and a diskless star changes its angular velocity conserving angular momentum following the equation,
| (1) |
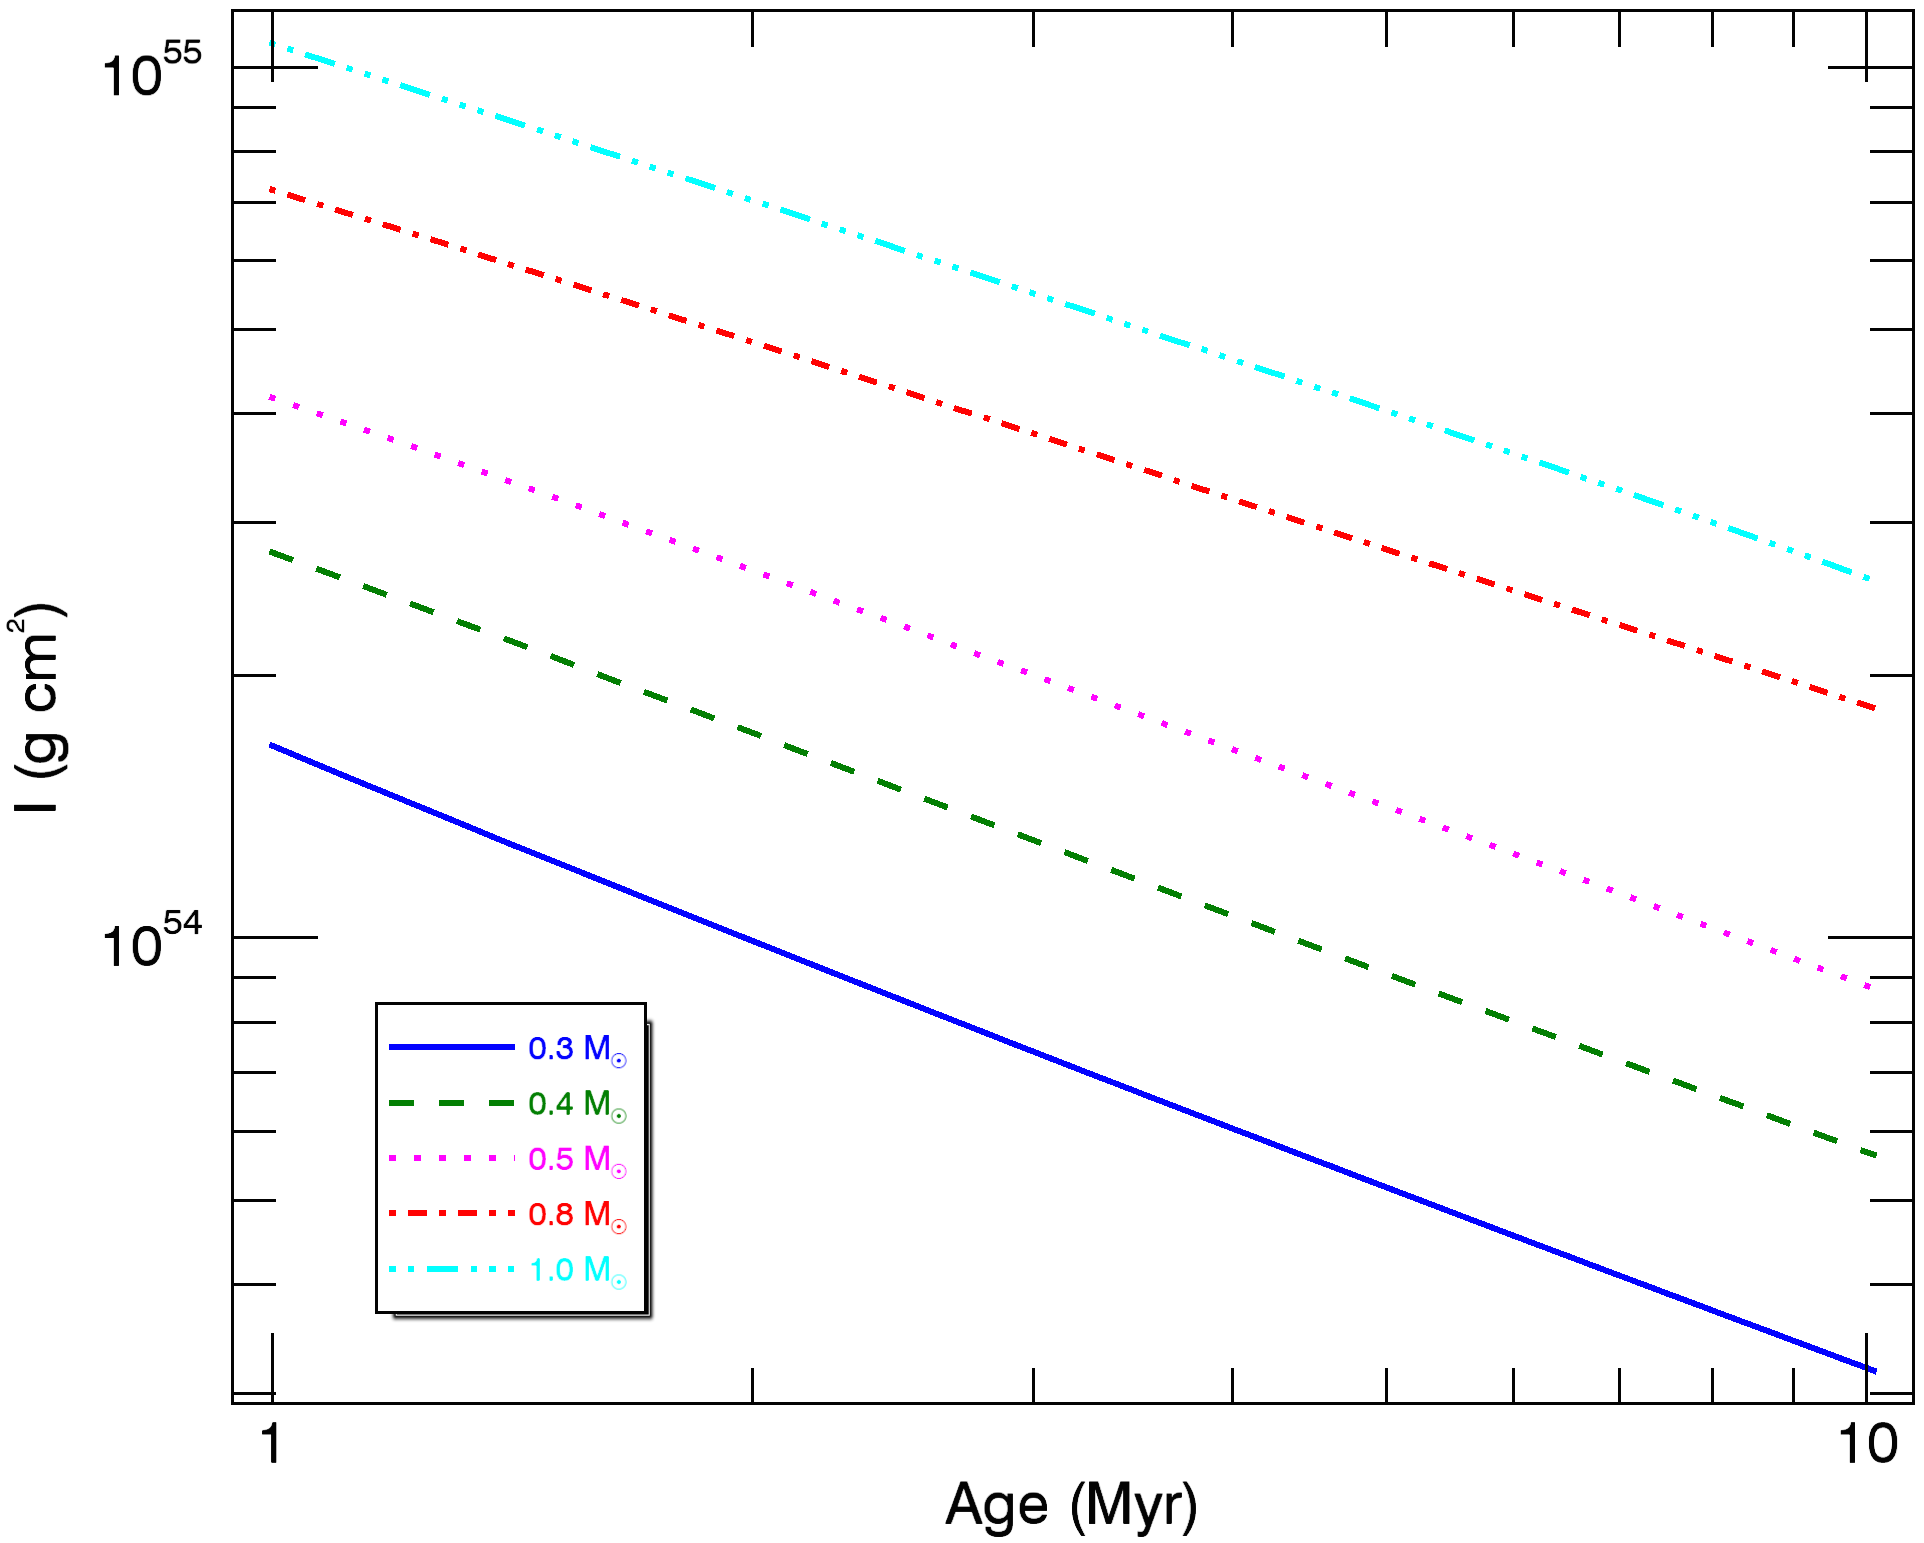
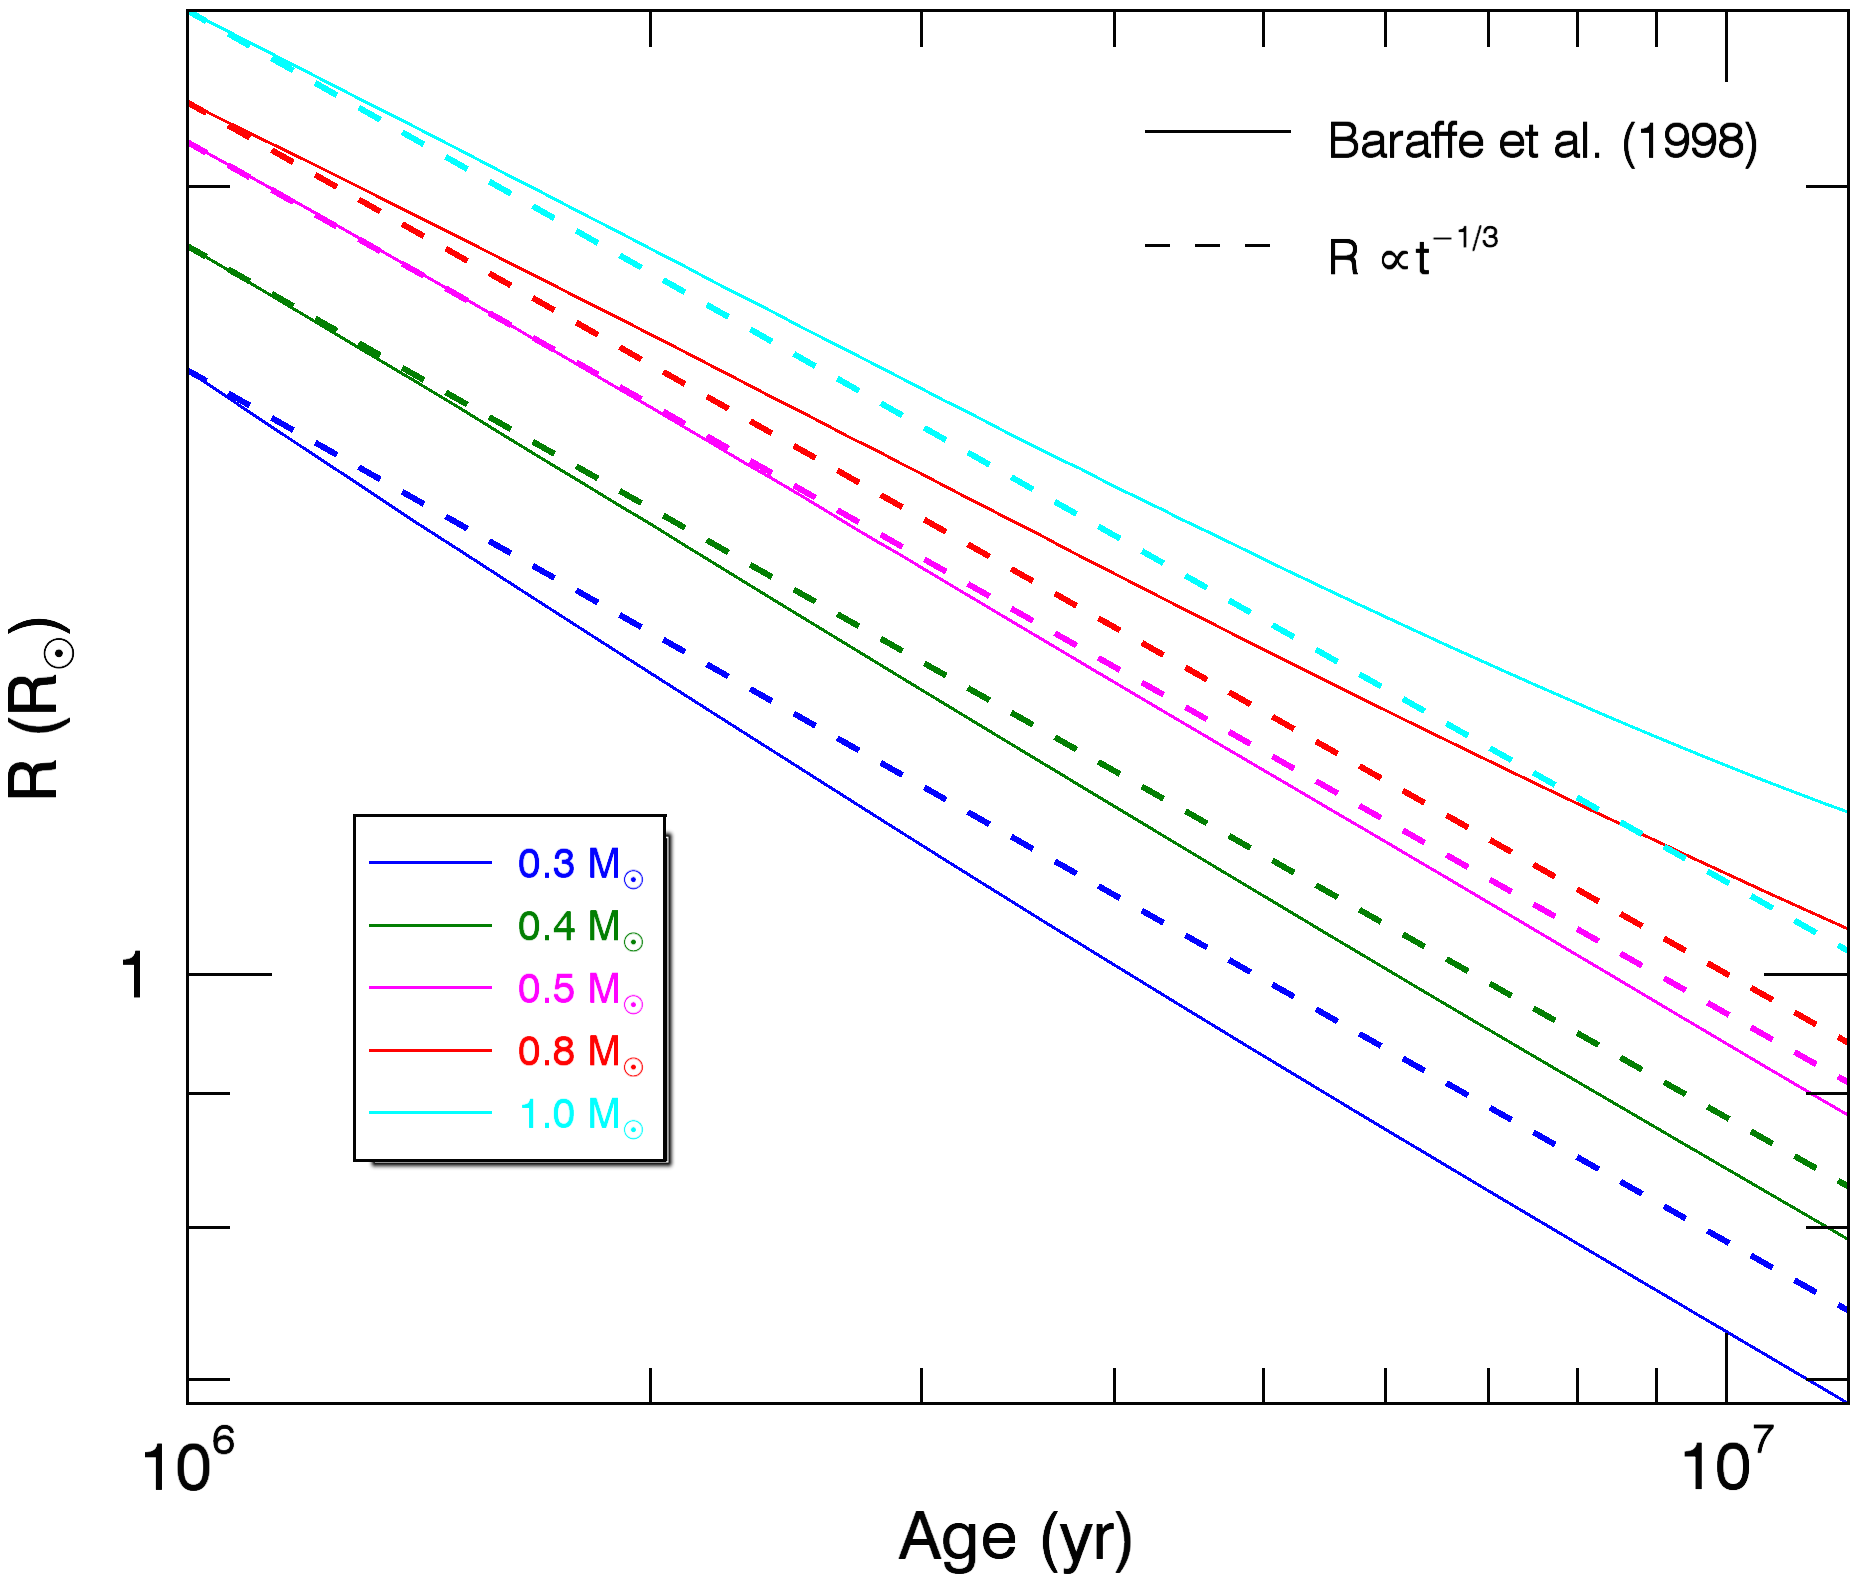
where is the angular velocity of the star at time t and is its moment of inertia at the same age. We calculate the moments of the inertia from the stellar evolutionary models of Baraffe et al. (1998) for 5 mass bins: 0.3 M⊙, 0.4 M⊙, 0.5 M⊙, 0.8 M⊙ and 1.0 M⊙. Figure 1 shows the interpolated moments of inertia for each mass bin as a function of the time interval considered in these simulations. As expected, the moment of inertia decreases with time since the star is contracting. This will increase the stellar rotation rate and decrease the period of rotation if the star is free from its disk.
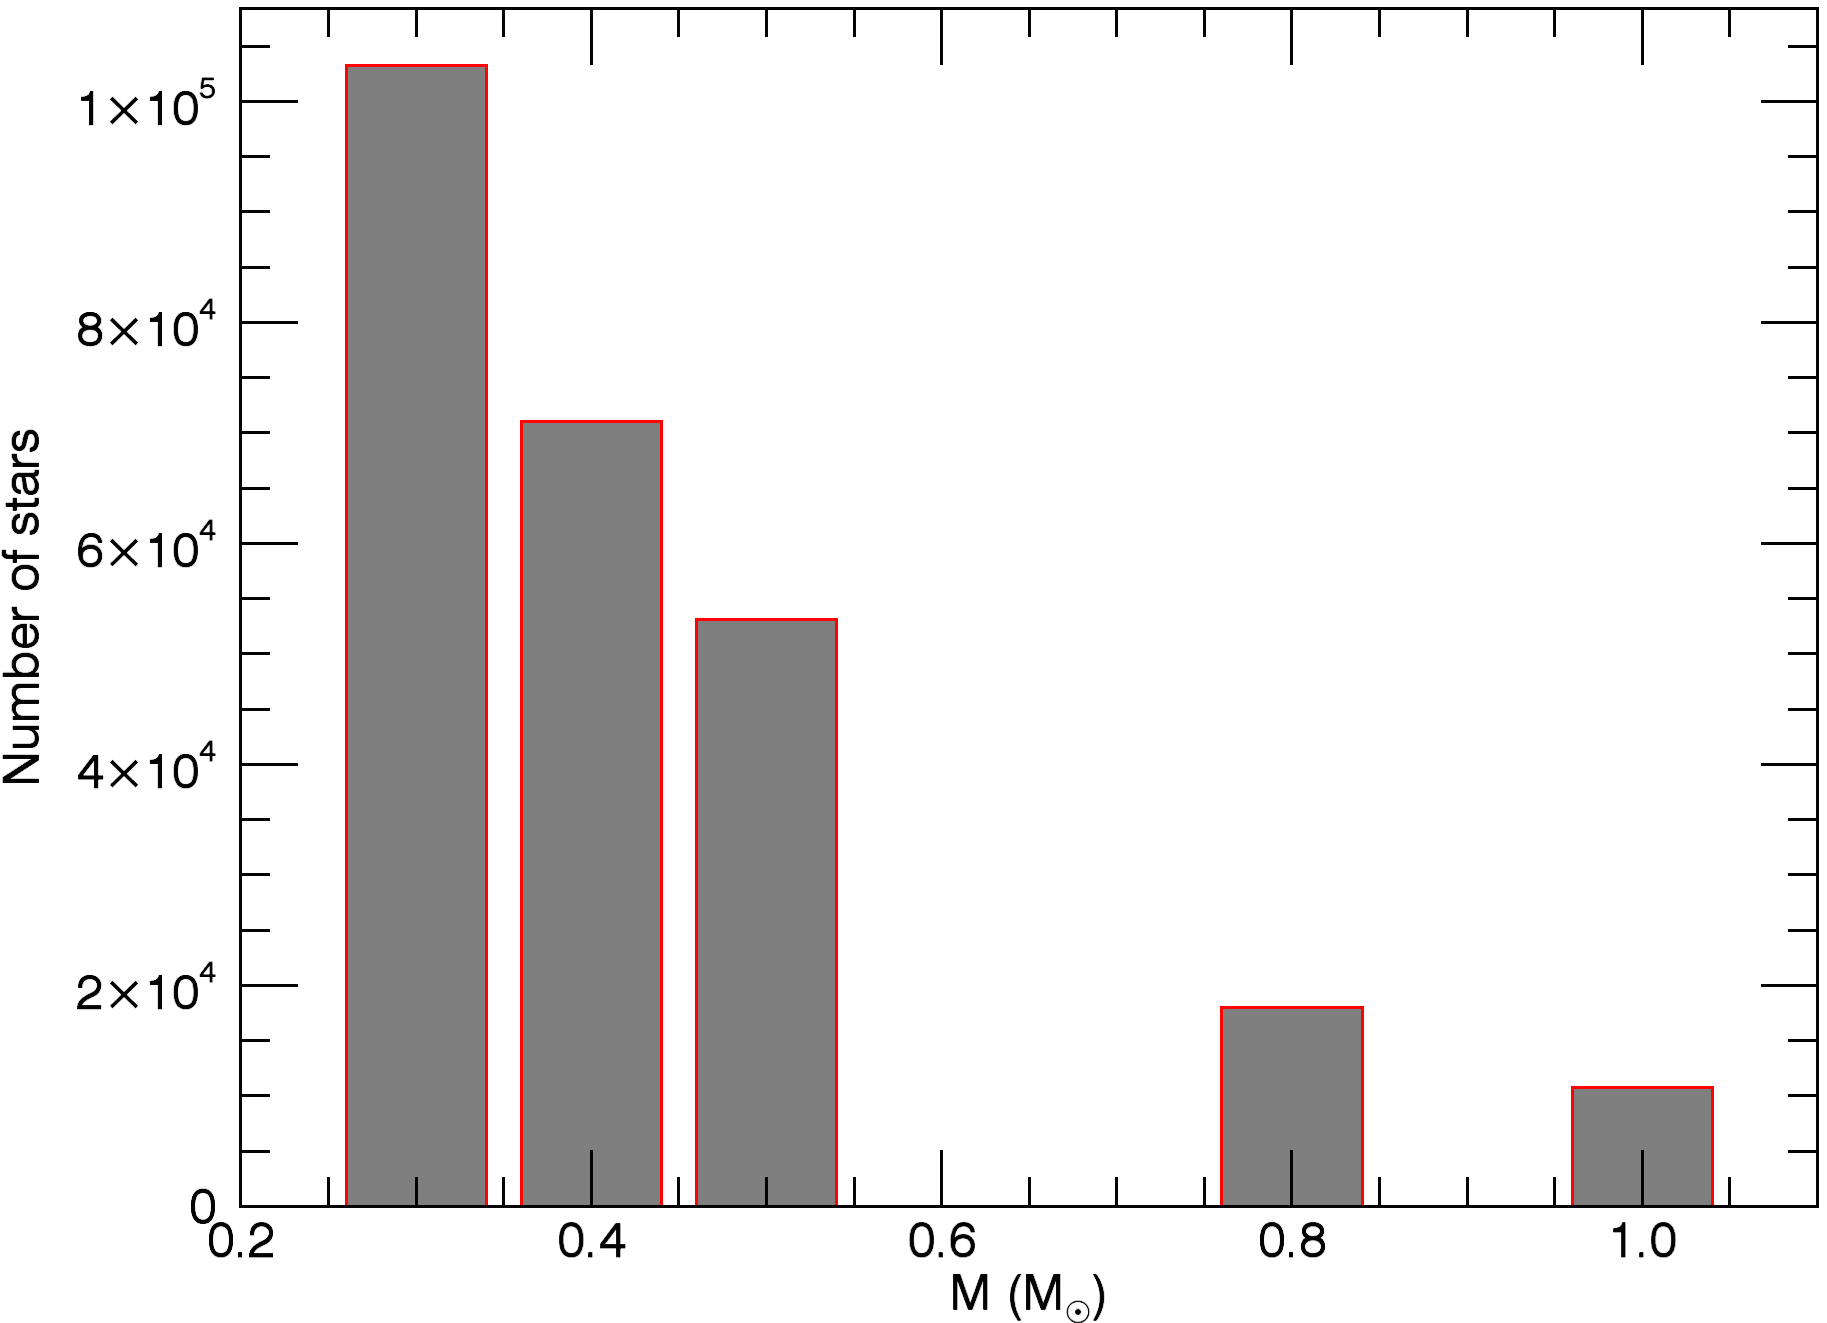
We generate period, mass and mass accretion rate distributions. Then, a population of about 280,000 stars is evolved from 1 Myr to 12.1 Myr in time steps of 0.1 Myr. The number of stars in each mass bin is obtained following the canonical IMF (Kroupa et al. 2013),
| (2) |
where is the mass in solar mass units (Figure 2). The exact shape of the IMF does not impact our results.
In order to obtain the initial mass accretion rate for each star, we calculate 5 different values, one for each mass bin, according to the equation:
| (3) |
where is the value of the stellar mass and b = 1.4 (Venuti et al. 2014). The constant c is obtained considering that a 1 M⊙ has a mass accretion rate equal to M⊙ yr-1 at t = 1.0 Myr. The values are shown in Table 1. We then create 5 random log-normal distributions with means given by (see equation 3 and Table 1) and .
| Mass | ||
| (M⊙) | M⊙ yr | |
| 0.3 | 1.8 | 0.57 |
| 0.4 | 2.8 | 0.85 |
| 0.5 | 3.8 | 1.2 |
| 0.8 | 7.3 | 2.2 |
| 1.0 | 10 | 3.1 |
With this initial setup, the mass accretion rate of each star evolves following the equation,
| (4) |
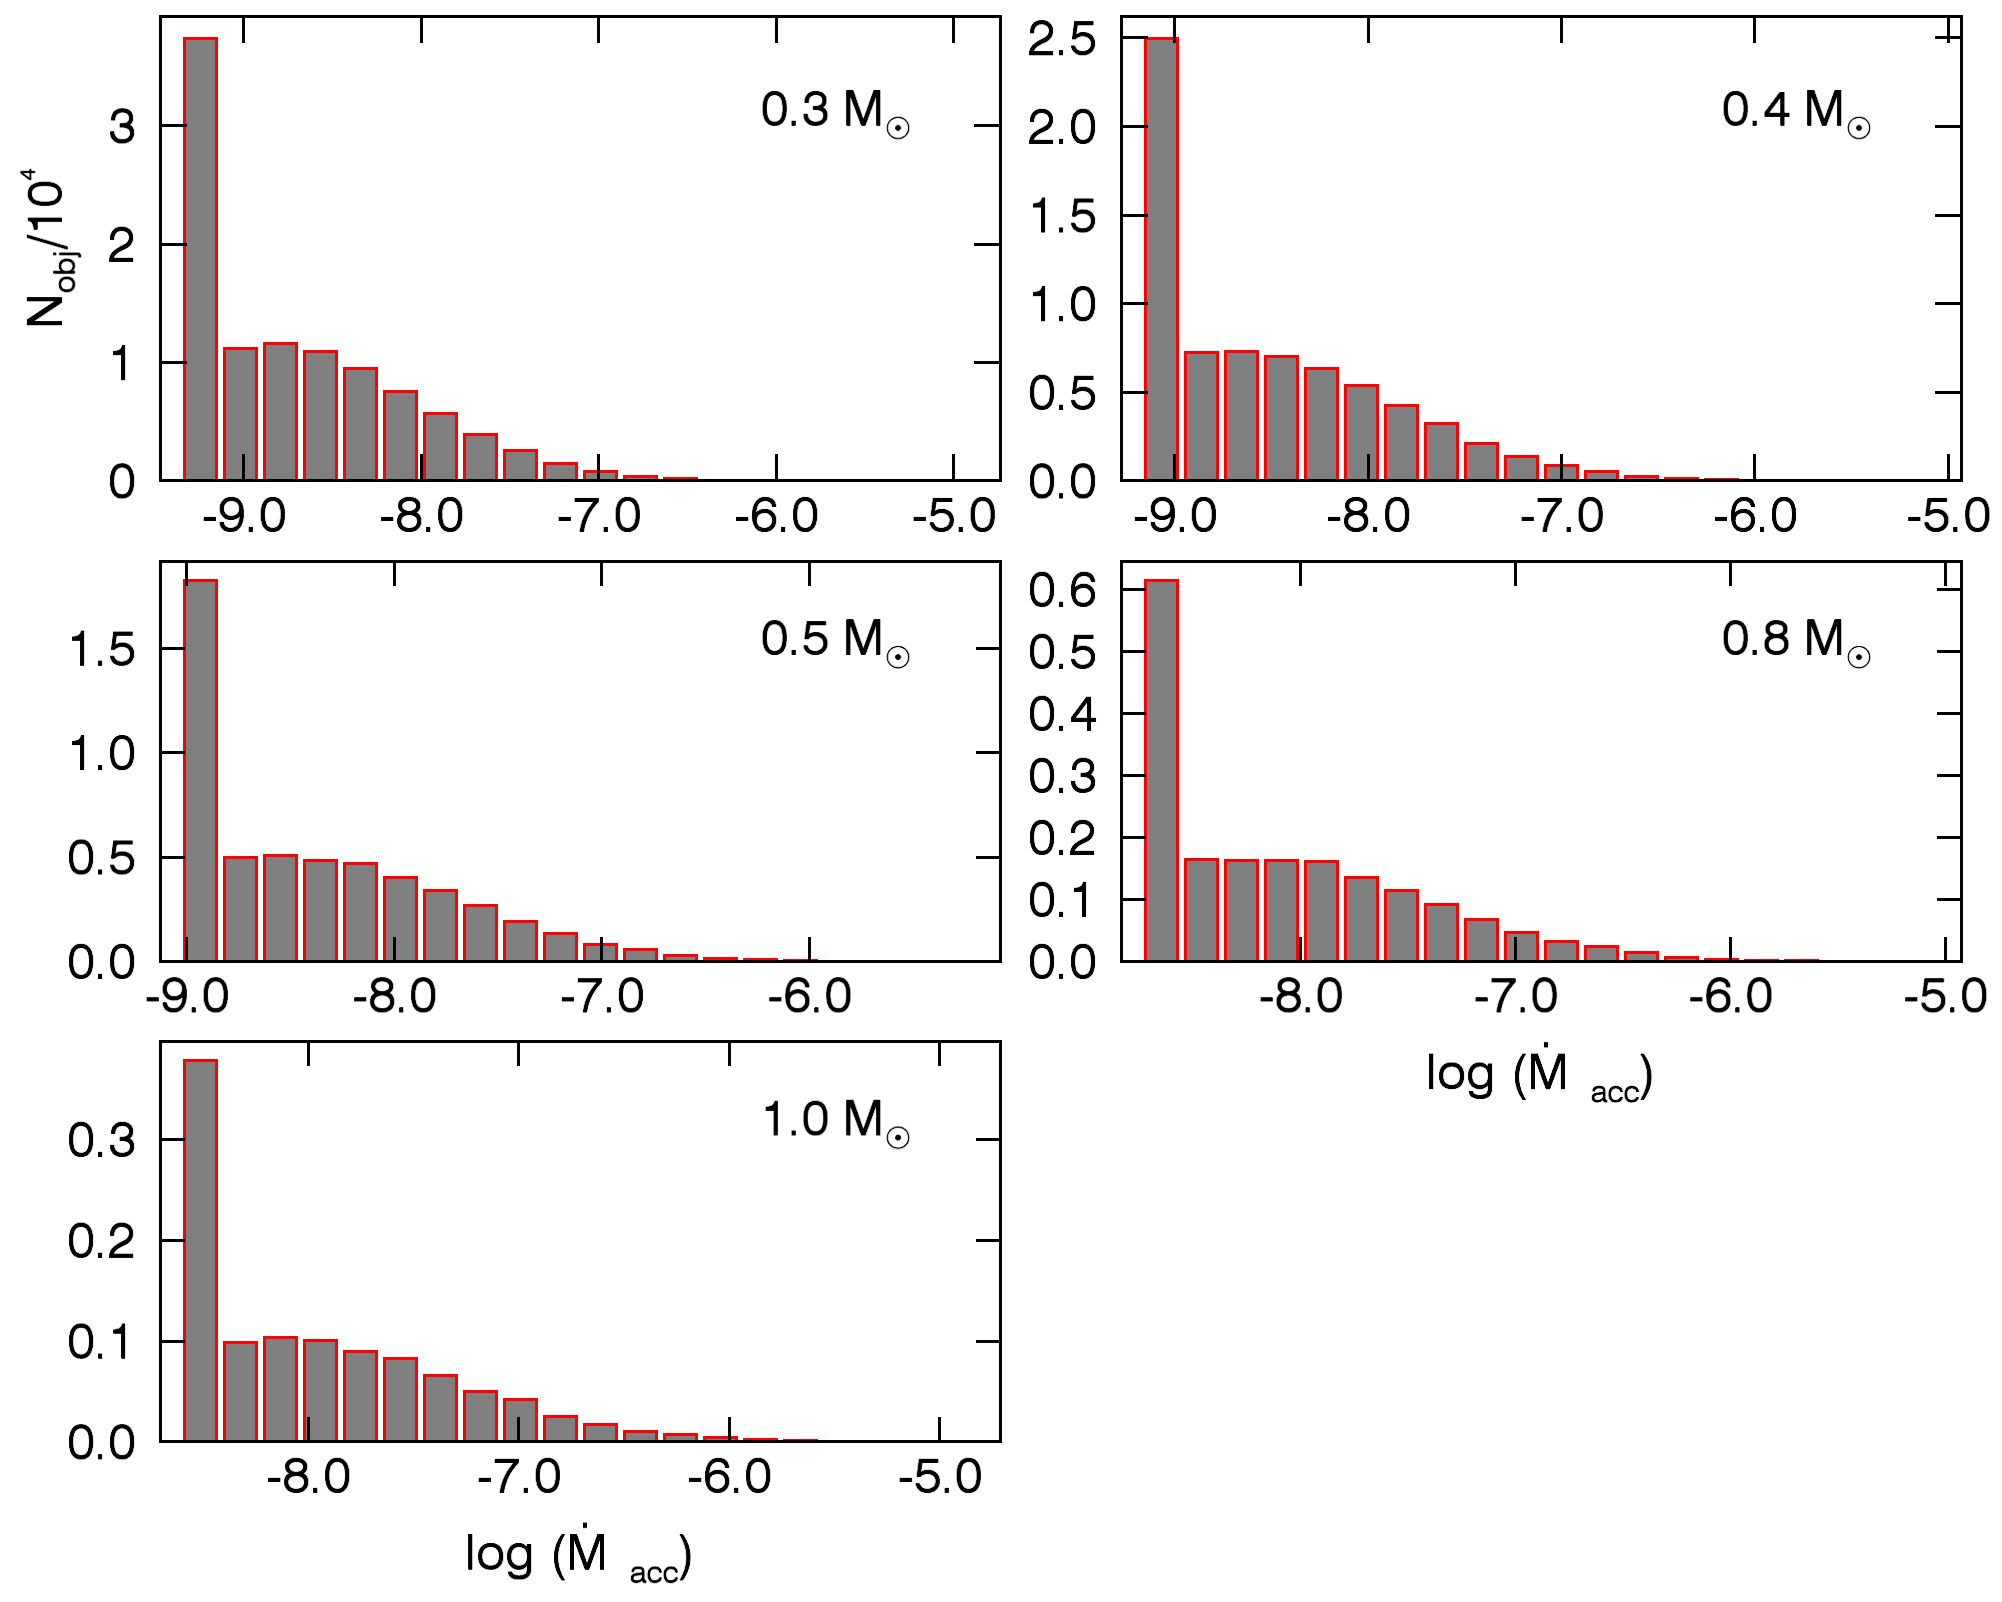
where the time is expressed in Myr and (Hartmann et al. 1998). In this equation, is the initial value of the mass accretion rate of a given star (at 1 Myr). We then choose a criterion through which the stars will loose their disks. If, for a given star at a given age, , the star will be released from its disk and will start to spin up conserving angular momentum. Otherwise it will keep its disk and its rotational period will be held constant. The threshold mass accretion rate, , is obtained taking equation (4) at , the threshold time, which is chosen in order to reproduce the observational disk fraction as a function of age (e.g., Mamajek 2009). We take tth = 2.2 Myr, which means that 50% of the stars will have lost their disk by this age. The mass accretion threshold values for each mass bin are shown in Table 1. All mass accretion rate values, including the initial ones, falling below the threshold are set equal to , which causes the appearance of a peak at this value in the initial distributions shown in Figure 3. Initially diskless stars start to spin up according to equation (1). As times goes by, different stars will reach the mass accretion rate threshold, will be released from their disks and will start to spin up according to the same equation.
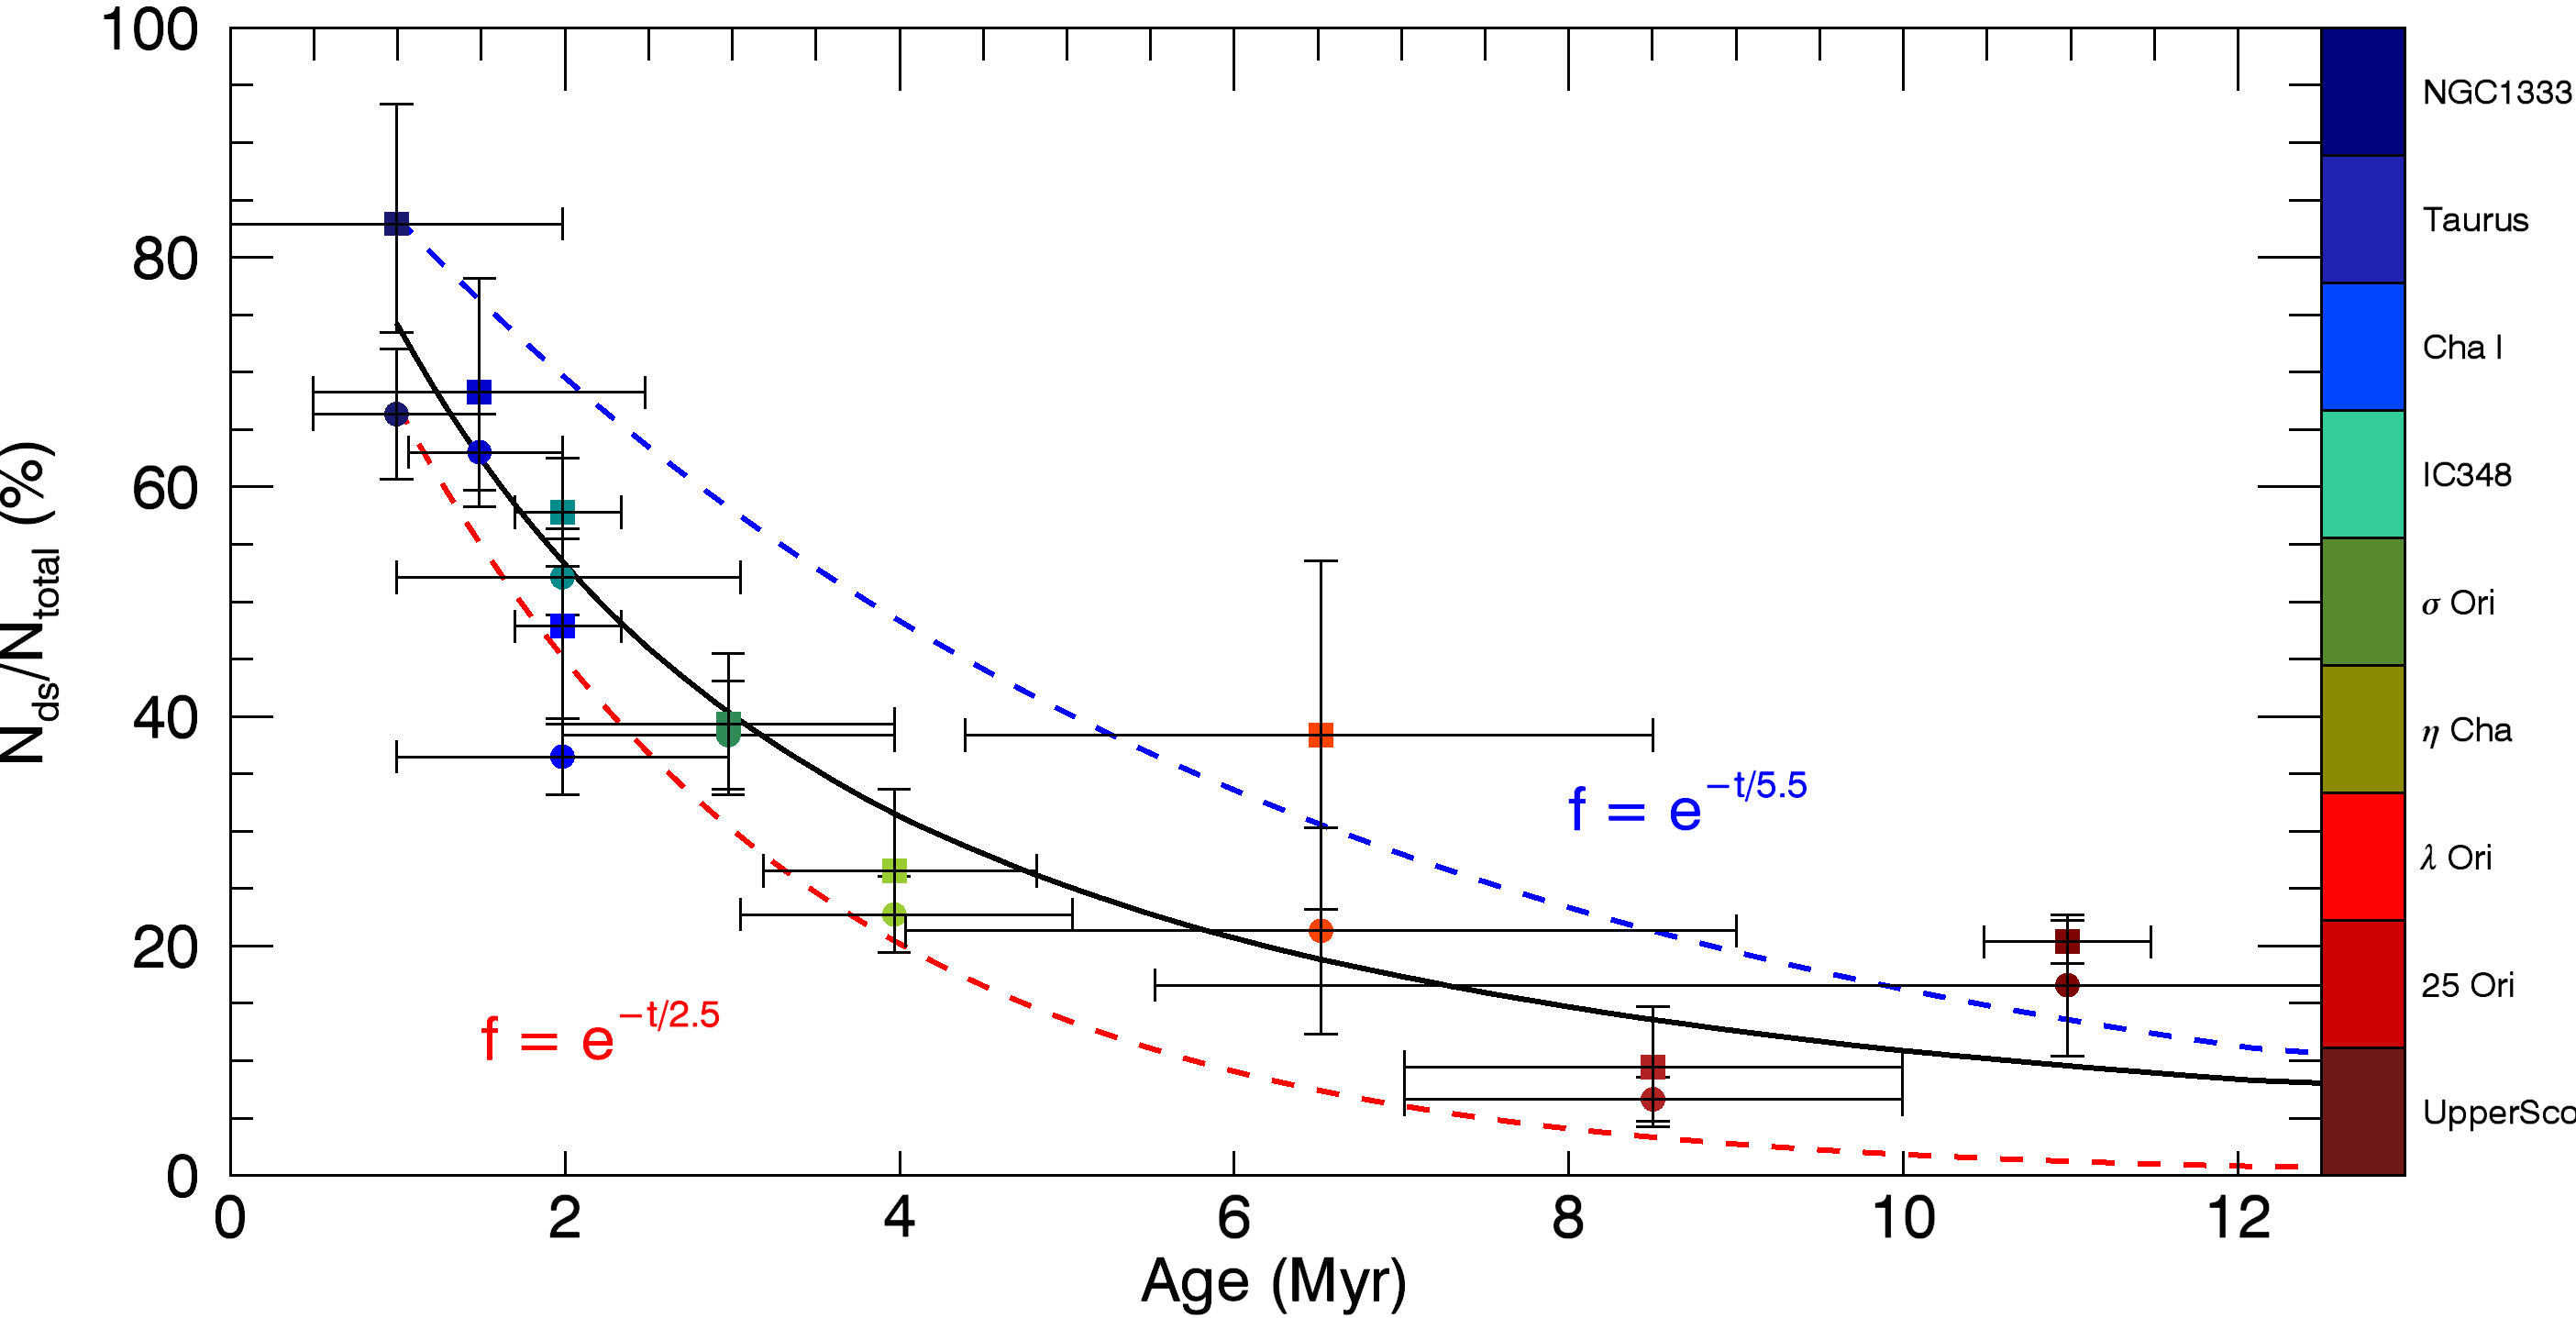
In Figure 4, we show the disk fraction as a function of age obtained from our simulations superimposed on data from Ribas et al. (2014), Hernández et al. (2007), and Hernández et al. (2008) for 9 young nearby associations. The combination of model parameters makes the number of diskless stars approximately equal to 25% initially. Our simulated disk fraction describes well the observed one and it stays between the two exponential limiting curves based on the short disk lifetimes claimed by, for example, Dahm & Hillenbrand (2007) and the longer disk lifetimes proposed by Bell et al. (2013). At 12 Myr, the disk fraction is around 8%.
3 Results and discussion
We will consider two models M1 and M2 which differ from each other by the initial distribution of periods of disk and diskless stars. Both have b = 1.4, = 1.5 (see equations 3 and 4), t Myr and the same mass and initial mass accretion rate distributions. The resulting disk fraction (shown in Figure 4) will then be the same for both models since it only depends on the choice of the threshold time, and the mass accretion rate distribution.
Changing the mass dependency of the mass accretion rate in our models does not change the main results we obtain below: the disk fraction, the period distributions, the time dependency of the median specific angular momentum remain the same. Of course, it changes the distribution of mass accretion rates. The values are higher for a model with, for example, b = 0.82, as observed by Spezzi et al. (2012) at some star forming regions of the Large Magellanic Cloud. However, the mass accretion rate as a function of time (equation 4) and the mass accretion rate threshold also depend on the mass in the same way, so all the problem in this sense is scale free. Thus, our models cannot be used to determine the mass dependency of the mass accretion rate, although they show a strong dependency on and the mass accretion rate dispersion (). If the mass accretion rate dispersion is smaller than what we have considered in this work, the time dependency must change in order to reproduce the observed disk fraction as a function of time. For example, if the mass accretion rate dispersion is less than 2 orders of magnitude, i.e, narrower than what is considered in this paper, can be as low as 0.3. This happens because there will be less stars with high mass accretion rate values, and then the disk fraction will fall off very quickly. In order to compensate this, the mass accretion rate must decrease slowly with time. To have a time dependency which is in agreement with the self-similar accretion theory (i. e. ; Hartmann et al. 1998), we should have a great amplitude of mass accretion rate values as is observed in several young clusters (Venuti et al. 2014; Manara et al. 2012).
3.1 Model M1
In model M1, we consider that the initial period distribution is the same for disk and diskless stars. It is given by a Gaussian function with a mean period equal to 8 days and a standard deviation equal to 6 days (e. g., Rebull et al. 2004; Bouvier et al. 2014). The Gaussian is truncated at both ends, at 0.5 days, and at 18.5 days. In Figure 5 we show the distributions of the rotational periods at t = 1.0, 2.1, and 12.1 Myr. At t = 1.0 Myr, our model assumptions establish an initial random distribution of periods and mass accretion rates for the whole population. According to the initial fraction of diskless stars derived from Figure 4 (equal to 26%), the number of diskless stars is smaller than the number of disk stars. This changes at t = 2.1 Myr, with the fraction of diskless stars increasing, and the distributions now peak at P days for disk stars and at P days for diskless stars. Our simulations point to a significant overlap between the rotational distributions of disk and diskless stars at all ages. Diskless stars tend to rotate faster than disk ones but exhibit a long tail towards long periods. Conversely, a fraction of fast rotators is found among disk stars.
Henderson & Stassun (2012) analyzing a sample of stars in NGC 6530 (1 - 2 Myr) find that the mean period of stars showing NIR excess is around 6.3 days and days for stars without NIR excess. Affer et al. (2013) also find days for CTTS and days for WTTS in a sample of stars in NGC 2264 (3 Myr). Cieza & Baliber (2007) found that stars with a spectral type M2 and earlier with and without disks also present different period distributions for NGC 2264 (1 - 5 days for diskless stars and a flatter distribution for disk stars) and the ONC (peak at days for diskless and at days for disk stars). Our results are in reasonable agreement with these observations. However, at 12.1 Myr, our simulation does not reproduce the bimodal rotational distribution of h Per cluster members, which exhibit one peak at day and another at 3 - 7 days (Moraux et al. 2013). Instead, in our simulation, the period distribution of diskless stars moves to smaller periods as a whole by an age of 12.1 Myr with a single peak at P days. This suggest that the initial conditions of the simulations might have to be modified.
3.2 Model M2
In order to see if we can obtain a bimodal distribution for the whole population of stars up to 13 Myr we run model M2, for which the initial period distribution is different for disk and diskless stars. For disk stars, the period distribution is the same considered in model M1 (P days and days). For the initial population of diskless stars, the period distribution is a truncated Gaussian with a peak at 3 days and a dispersion equal to 2 days. There are no stars with periods less than 0.5 days and all the stars that originally had periods less than this value are smoothly redistributed around 3 days. These parameters were chosen supposing that at 1.0 Myr the stars in a given cluster have already experienced some disk and rotational evolution. That there is some disk loss at this age is seen in very young clusters as, for example, NGC 1333 which is 1 Myr old and has a disk fraction equal to 66% 6% (Ribas et al. 2014, Figure 4). Then we suppose that at 1 Myr there is a diskless population which is spinning up. On the somewhat older ONC cluster, Cieza & Baliber (2007) find that stars without signs of the presence of dust disks rotate faster than the disk stars, with a mean period of 2 days but with a tail towards longer periods. Supposing that at 1 Myr these stars rotate slowly than at 2 Myr, we choose the mean period of the diskless population to be equal to 3 days but with a dispersion value great enough to allow the existence of diskless stars with periods as long as 10 days.
3.2.1 Evolution of the rotational distributions
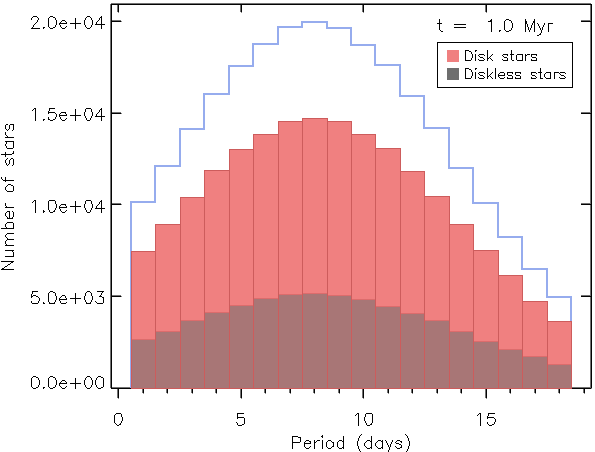
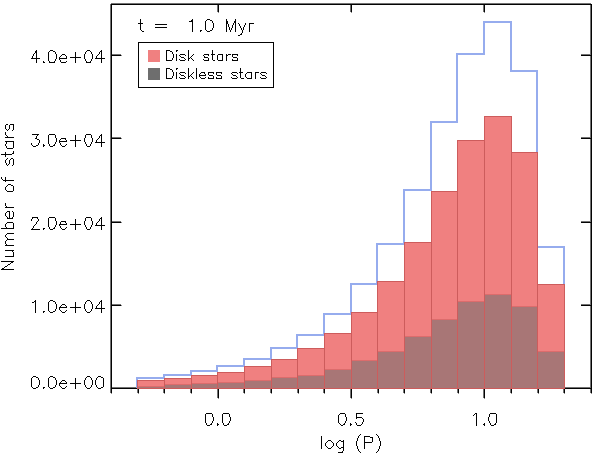
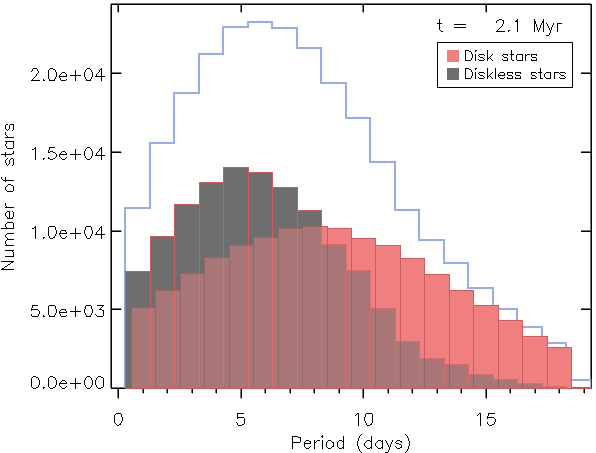
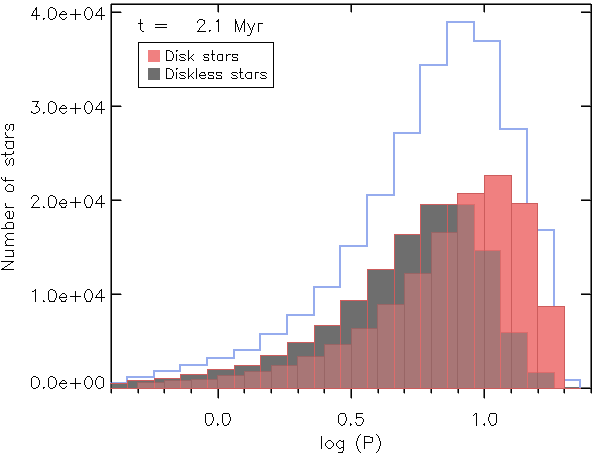
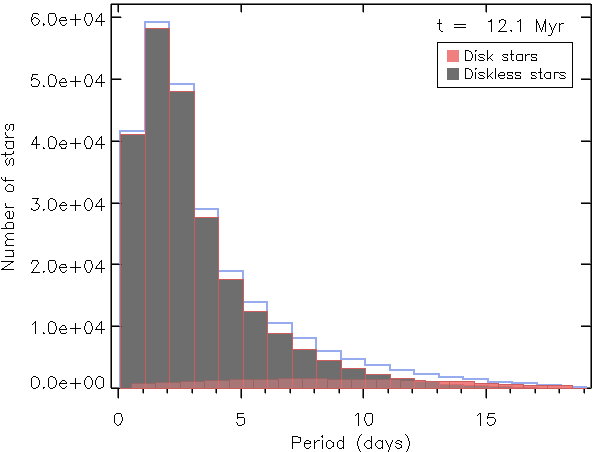
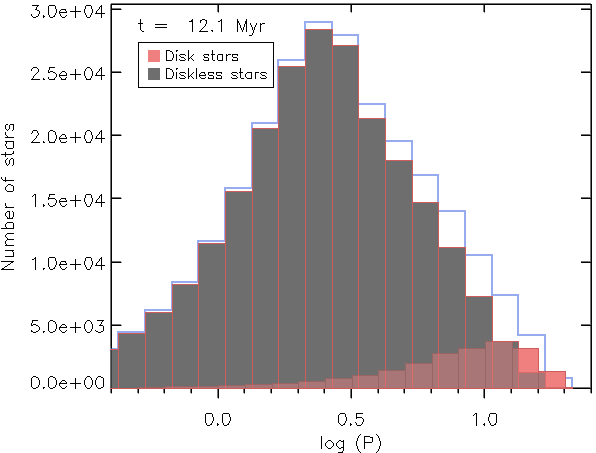
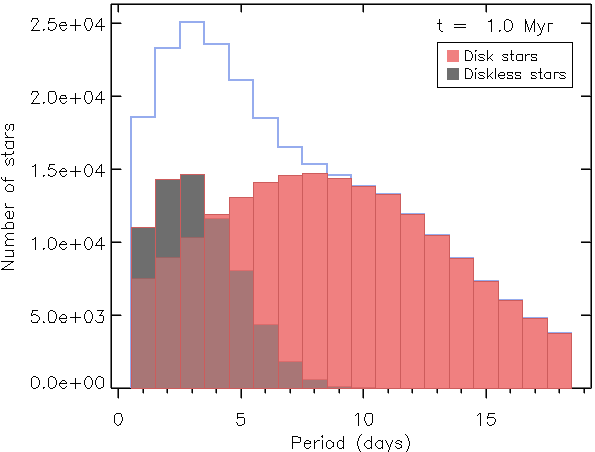
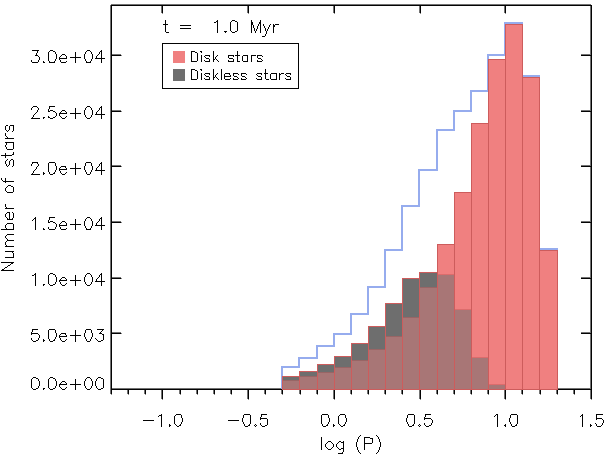
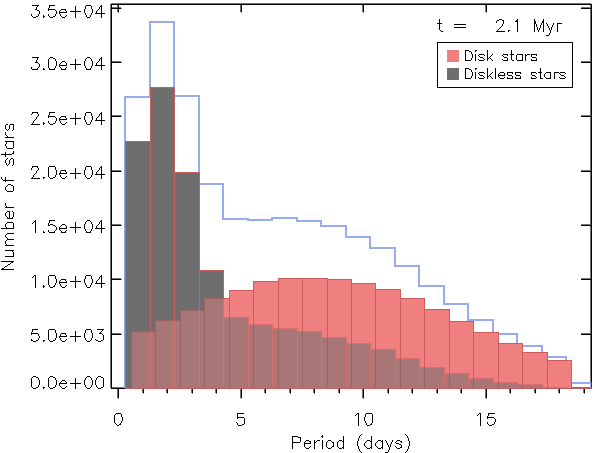
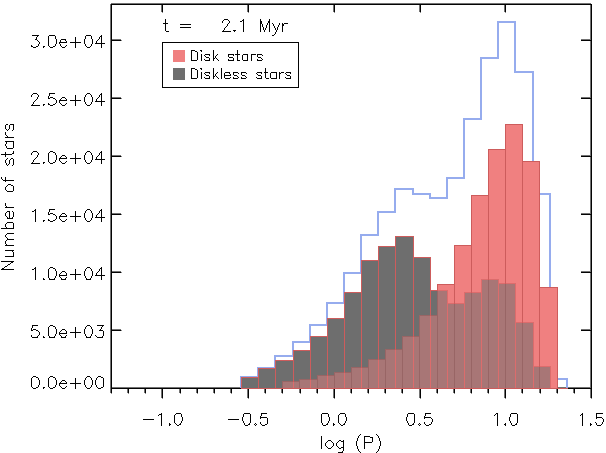
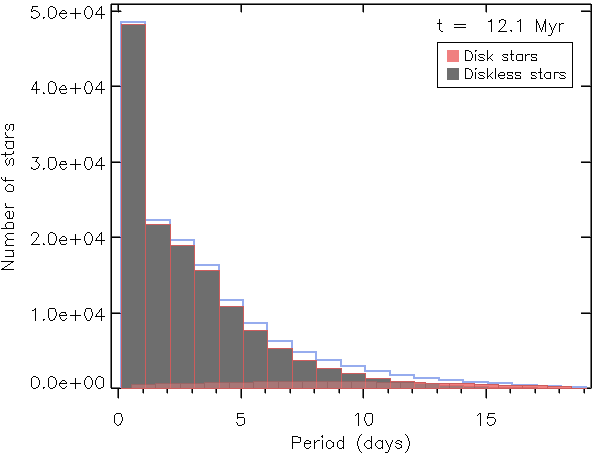
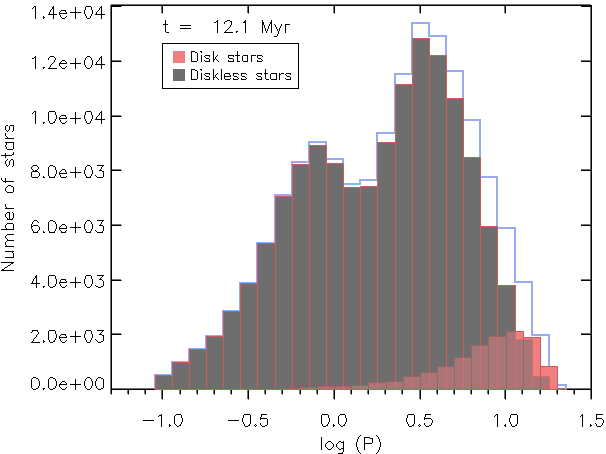
In Figure 6 we show the period distribution at 1.0, 2.1, and 12.1 Myr. The distinct initial periods distributions for disk and diskless stars are seen at 1 Myr. While there are no diskless stars with periods greater than 10 days, there are still fast rotators among disk stars. At 2.1 Myr the period distribution remains clearly bimodal. The peak of the fast rotators is around 2 days and that of the slow rotators is around 8 days as seen by Cieza & Baliber (2007) for the ONC. We also recover a bimodal distribution seen in the distribution of the logarithm of the period at 12.1 Myr for h Per stars, quite in contrast with model M1 above. At this age, the peaks of the simulated distribution lie at 0.7 and 3.2 days. While the former is in good agreement with the peak of h Per fast rotators reported by Moraux et al. (2013), the latter is located at smaller periods than observed in h Per where it lies at about 3-7 days in the mass range 0.4-1.1 M⊙.
3.2.2 Rotation - disk fraction connection
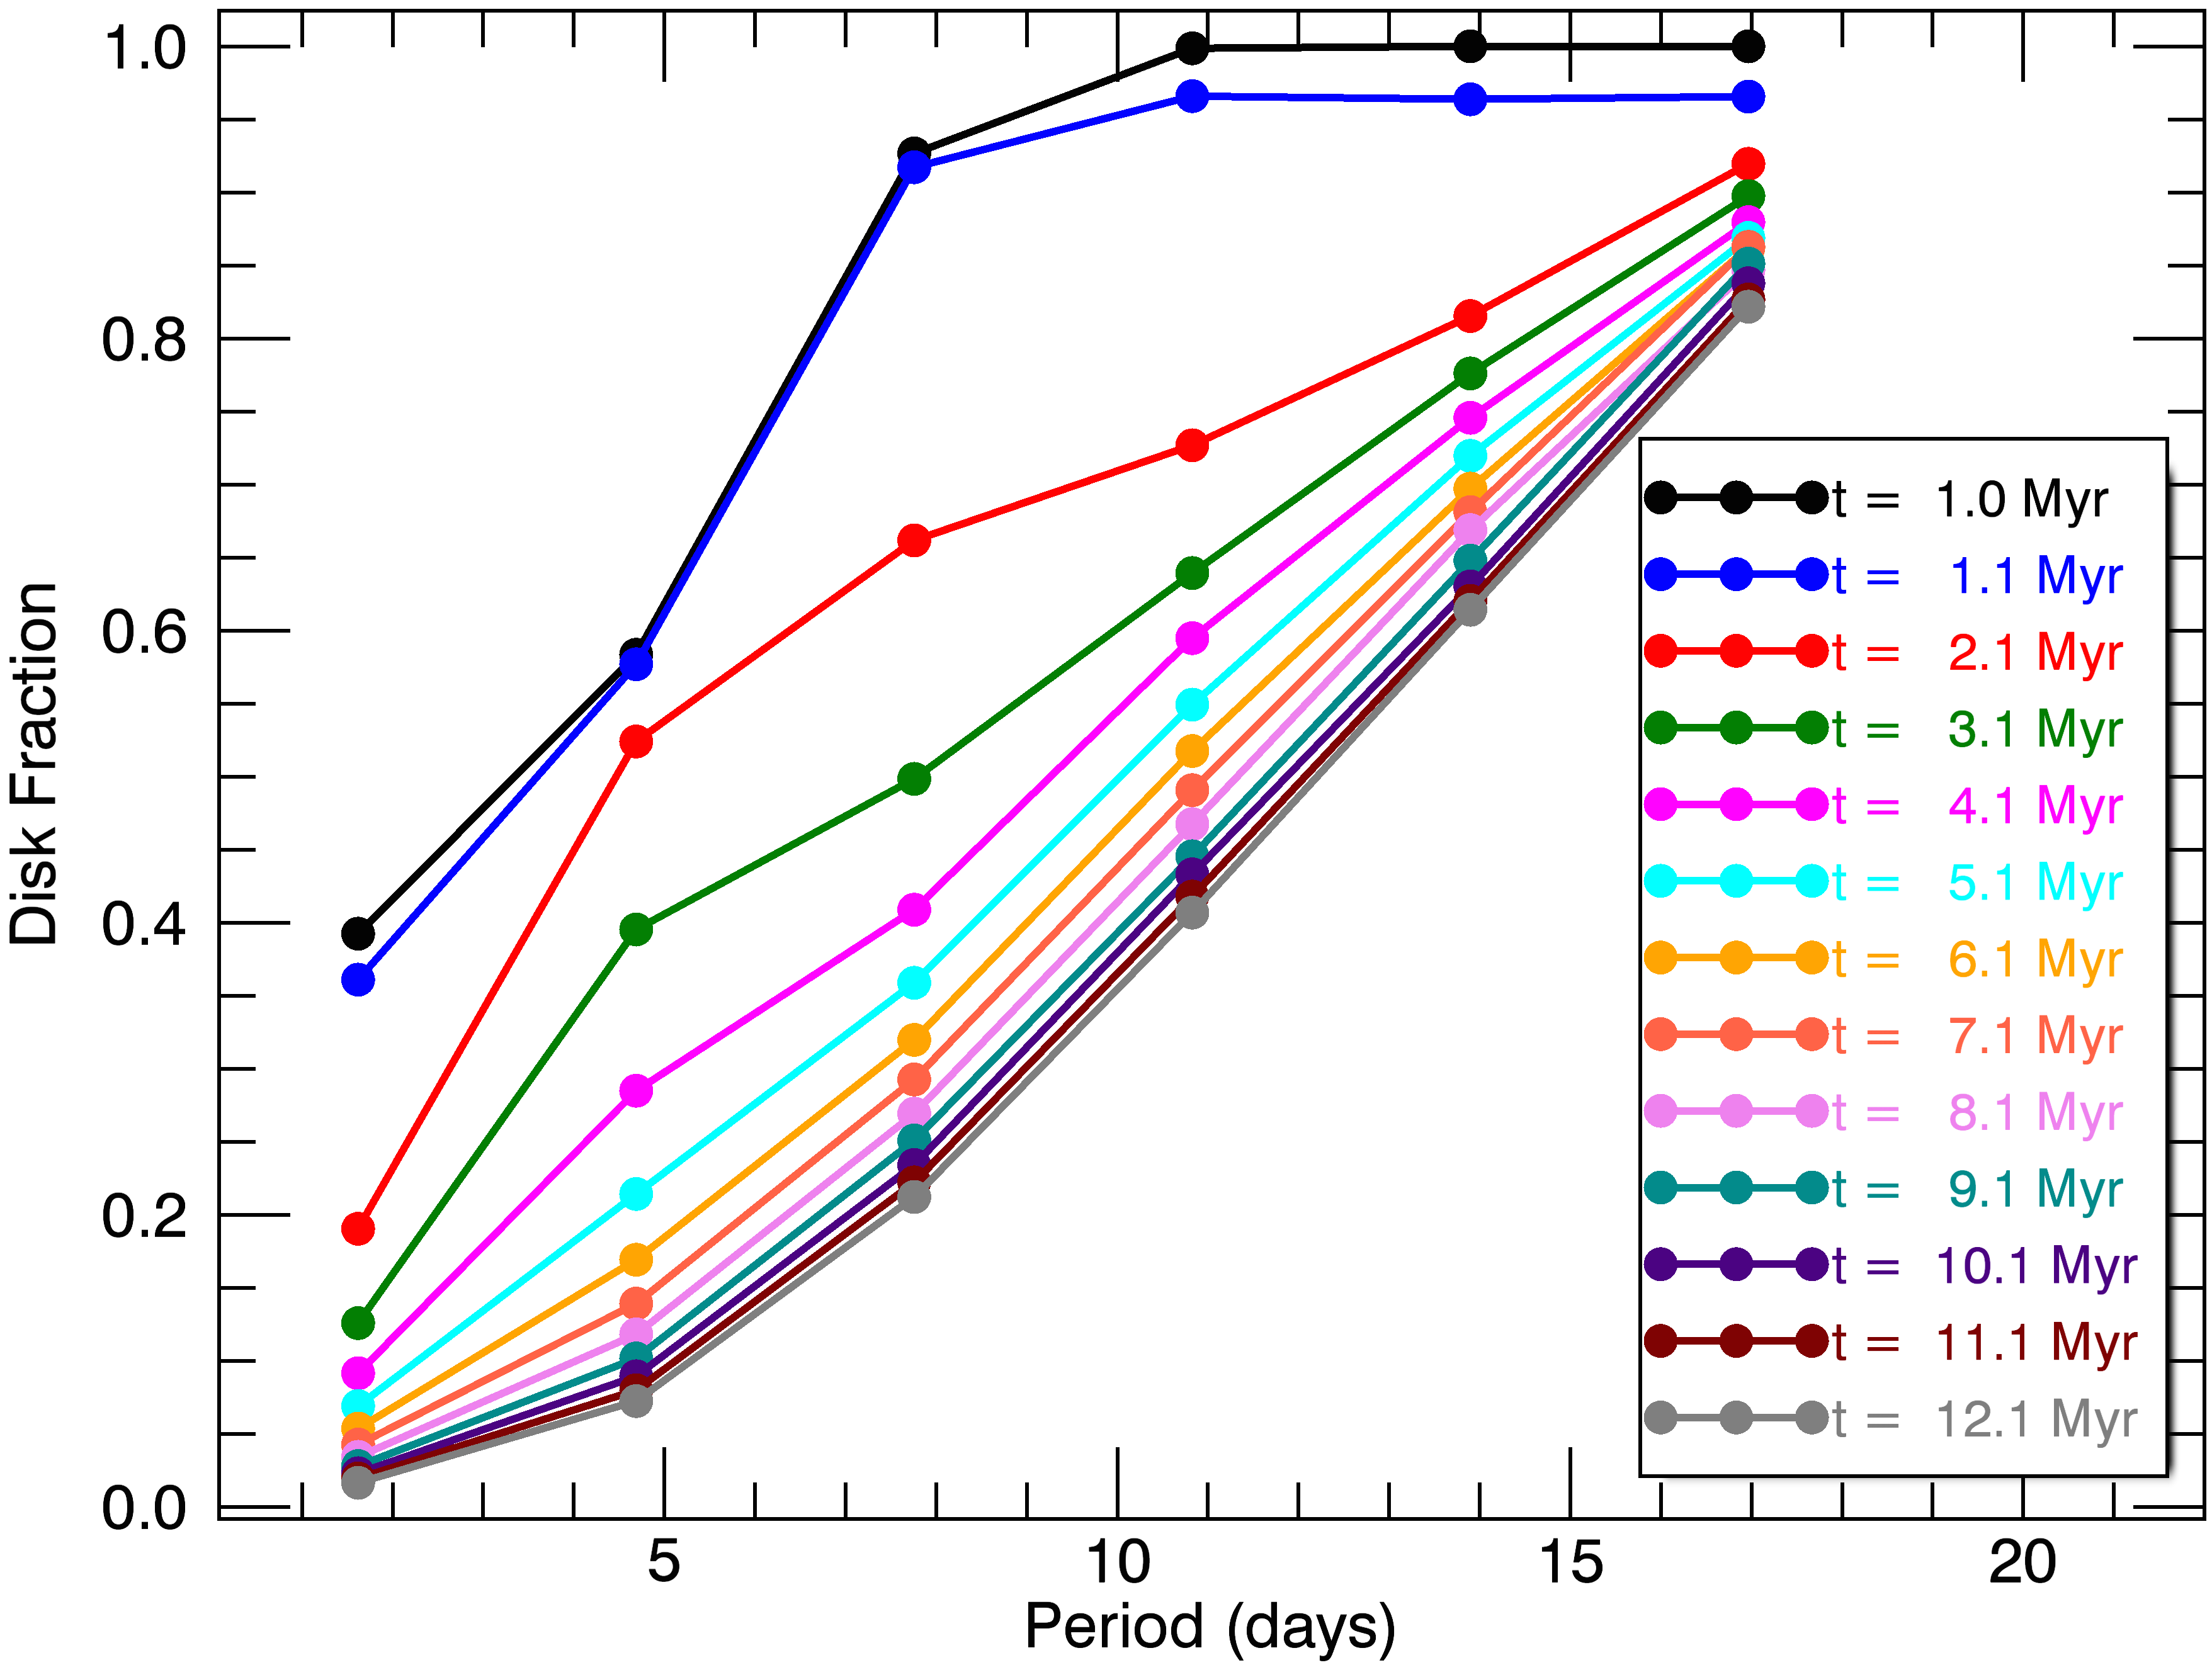
Cieza & Baliber (2007) stated in a different way that disk stars rotate more slowly on average than diskless stars. They showed that the fraction of disk stars increases with period for a sample of young stars in NGC 2264. In Figure 7 we plot the fraction of disk stars as a function of period for model M2 at different ages. There is a general trend of increasing disk fraction with increasing period. At 1 Myr, all stars with periods greater than 10 days are disk stars (i.e., disk fraction equal to 1.0), following the M2 initial period distributions. As the system evolves, the disk fraction as a whole decreases but the decrease rate is greater at smaller periods. This is due to the fact that slowly rotating stars that loose their disk start to spin-up, thus leading to an accumulation of diskless stars at shorter periods.
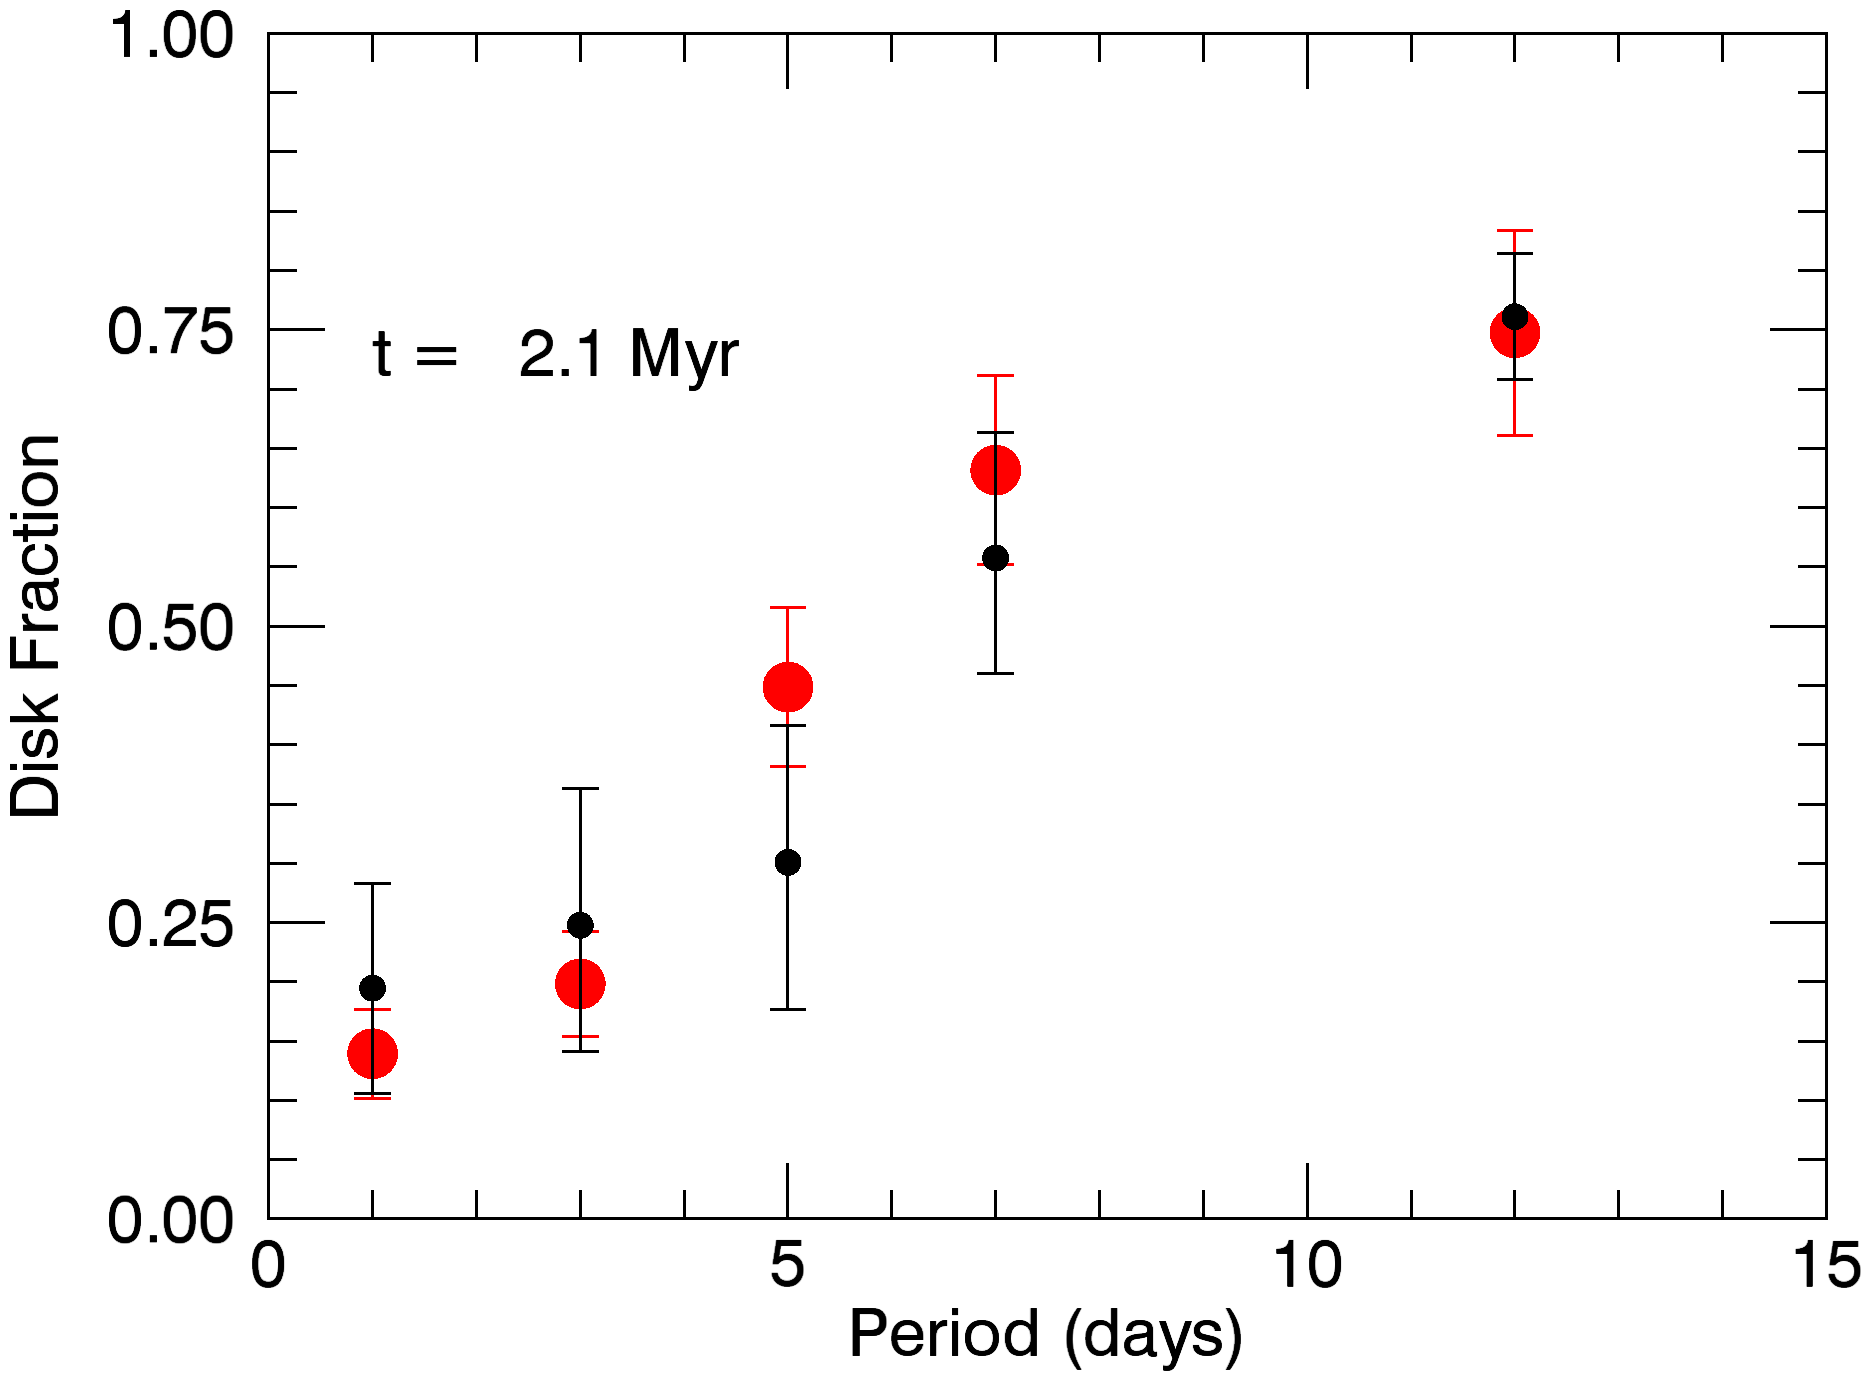
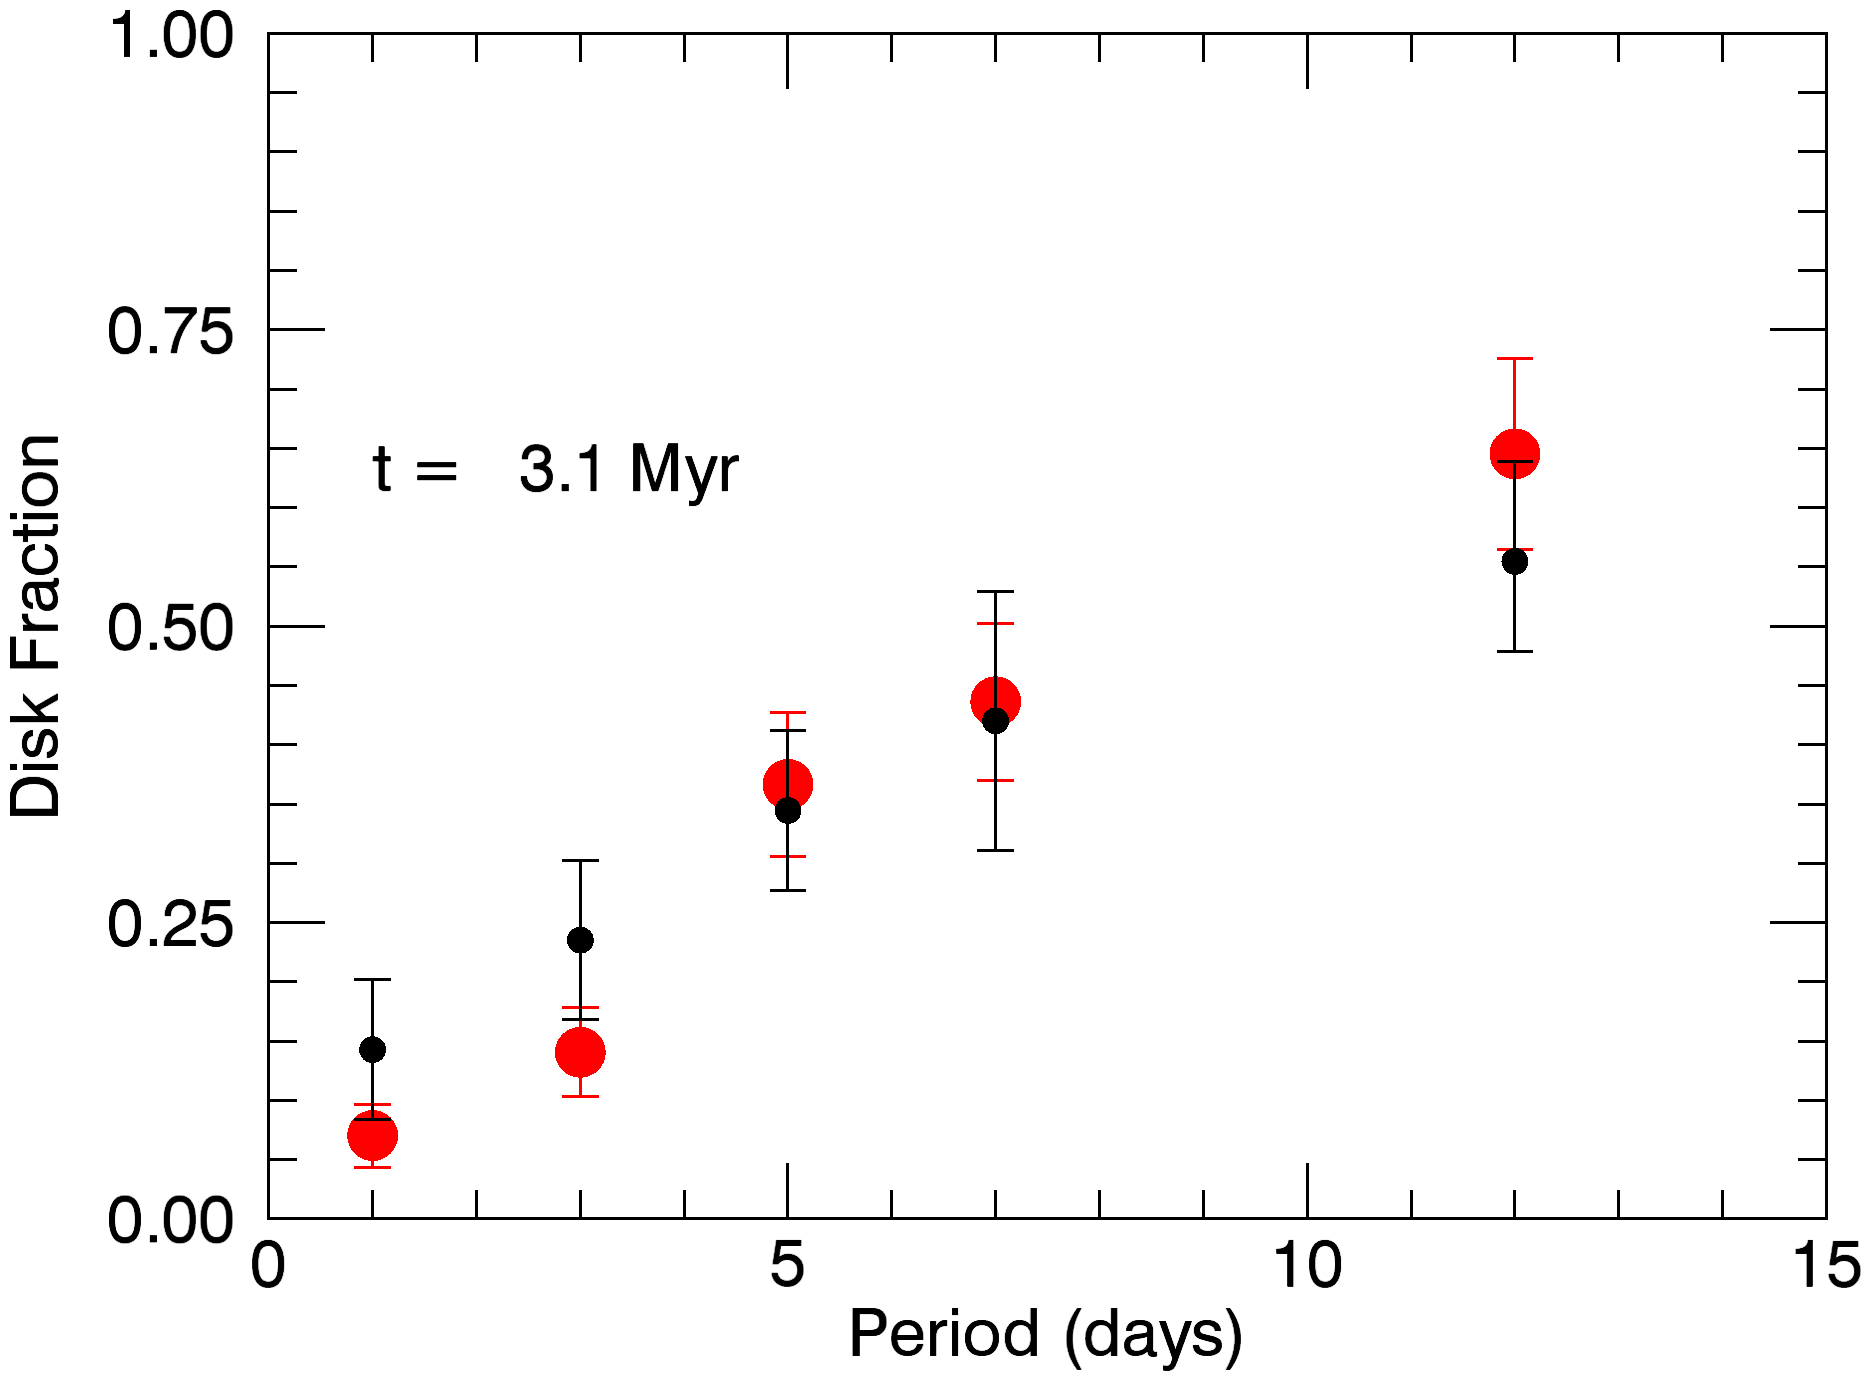
In Figure 8 we compare our results at 2.1 and 3.1 Myr with the data of Cieza & Baliber (2007) for stars of ONC and NGC 2264 with a spectral type M2 and earlier. We use the same period bins in order to facilitate the comparison. There is a good agreement between our results and Cieza & Baliber (2007)’s data taking into account the error bars which in our case are equal to the standard errors of a Poisson counting. The disk fraction is seen to smoothly increase with rotational period at 2.1 Myr and 3.1 Myr as observed, which supports the M2 model assumptions, including disk locking and an initial bimodal distribution of periods for disk and diskless stars.
3.2.3 Rotation - accretion connection
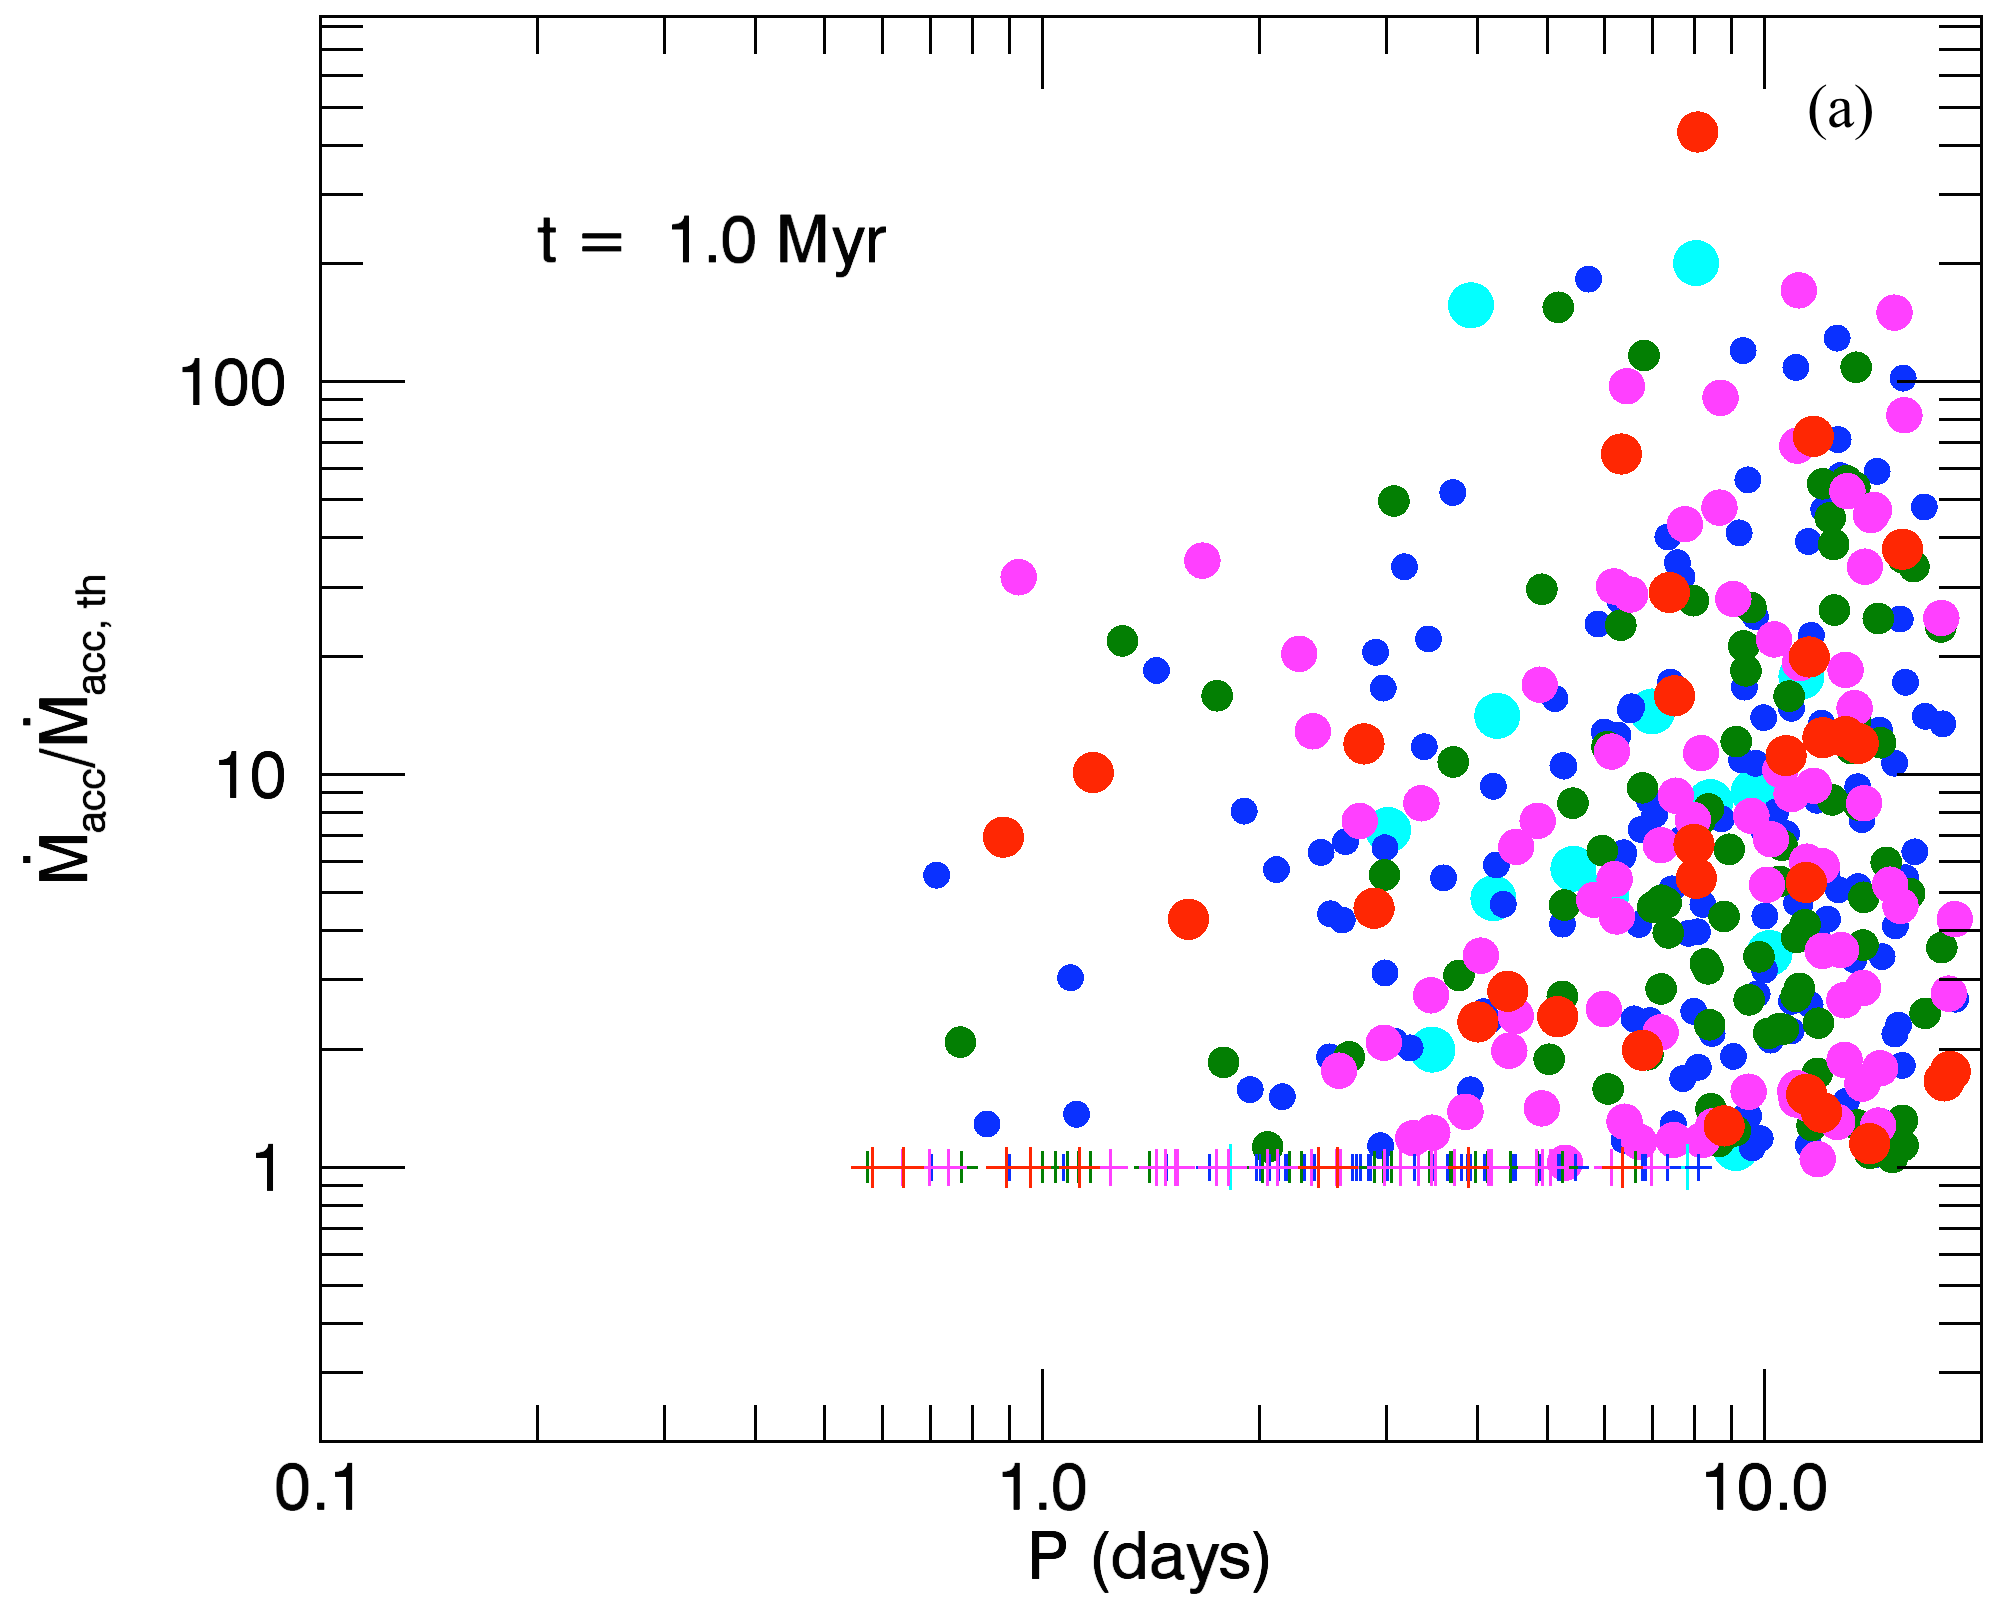
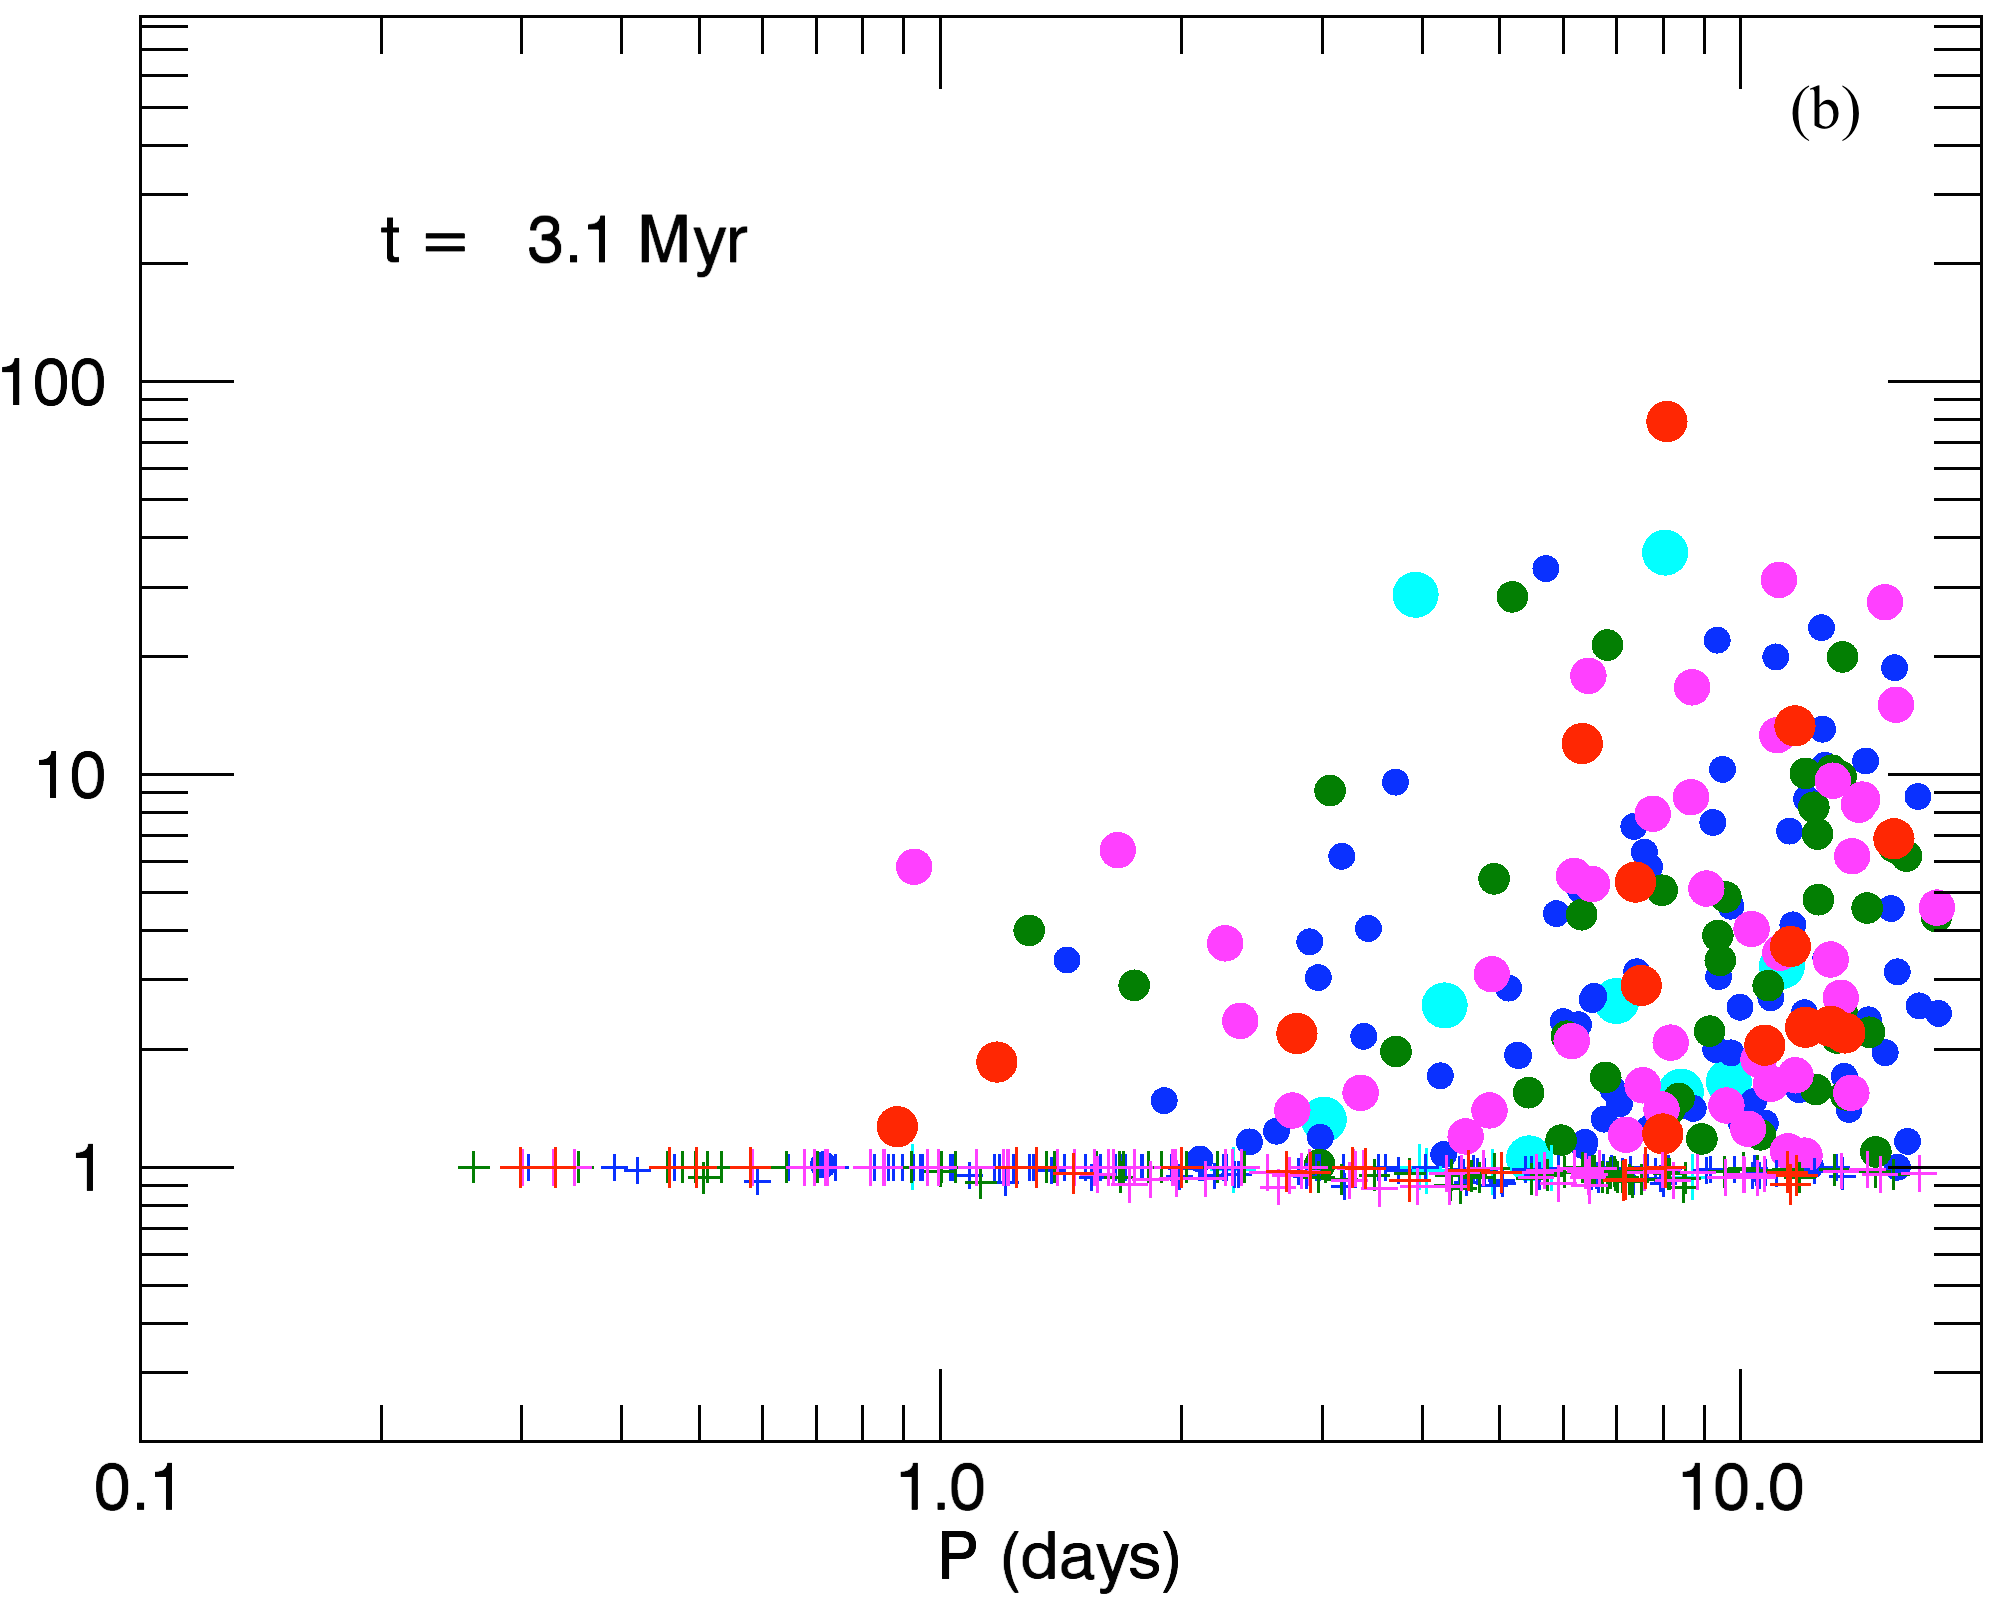
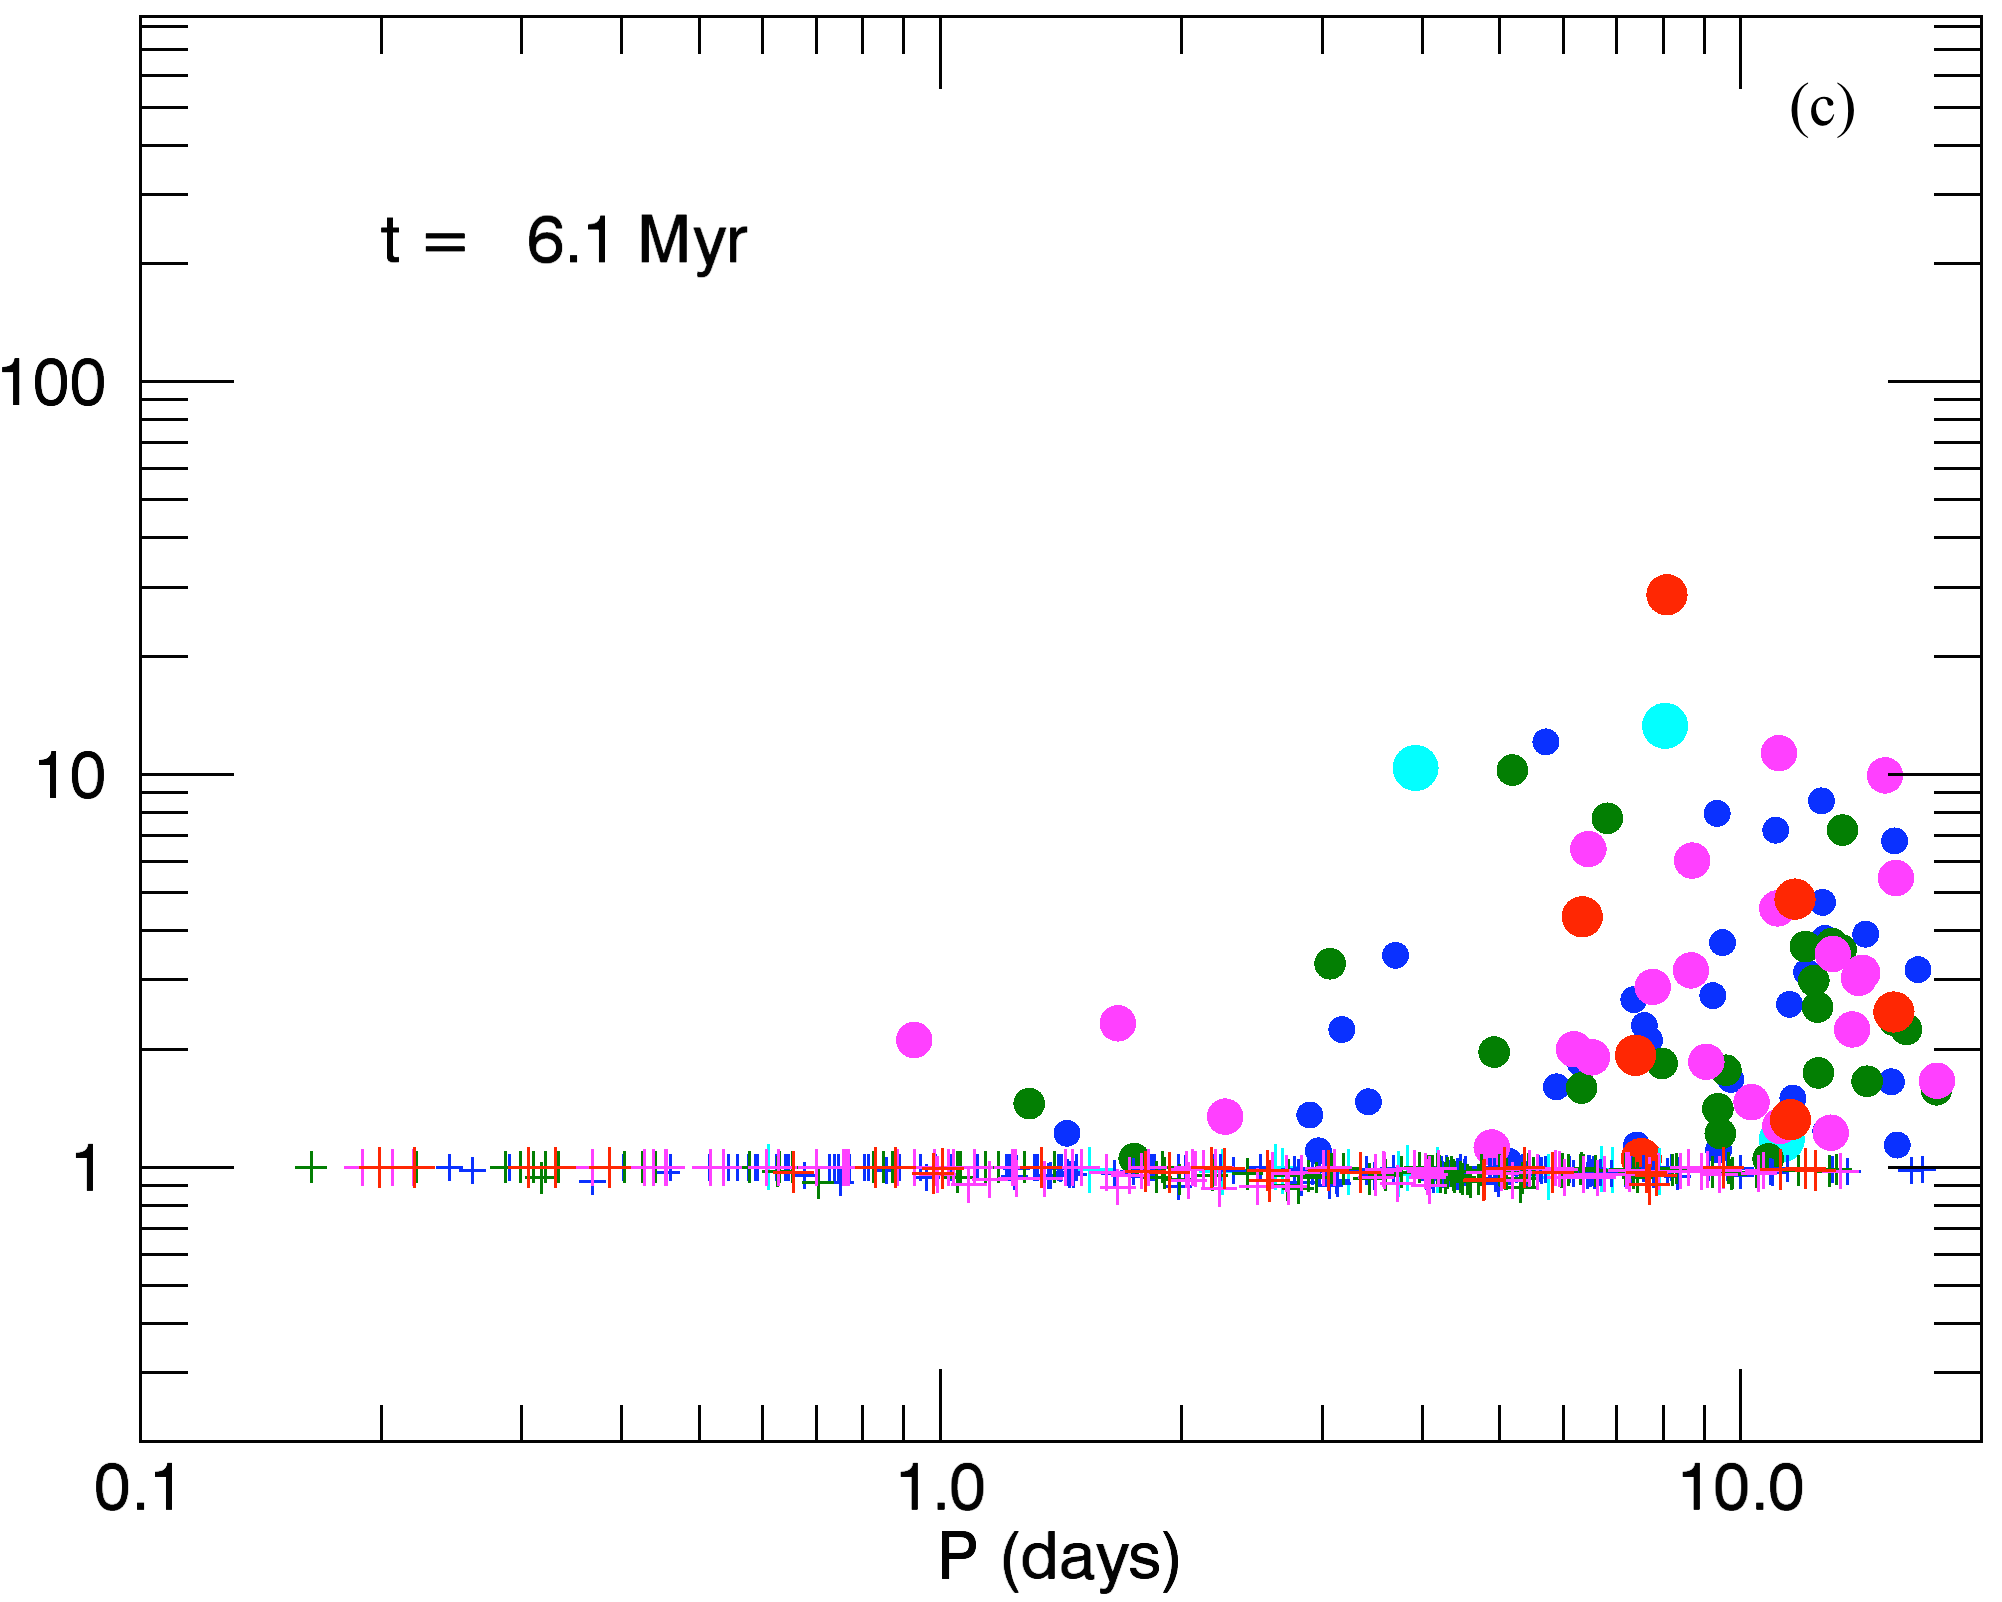
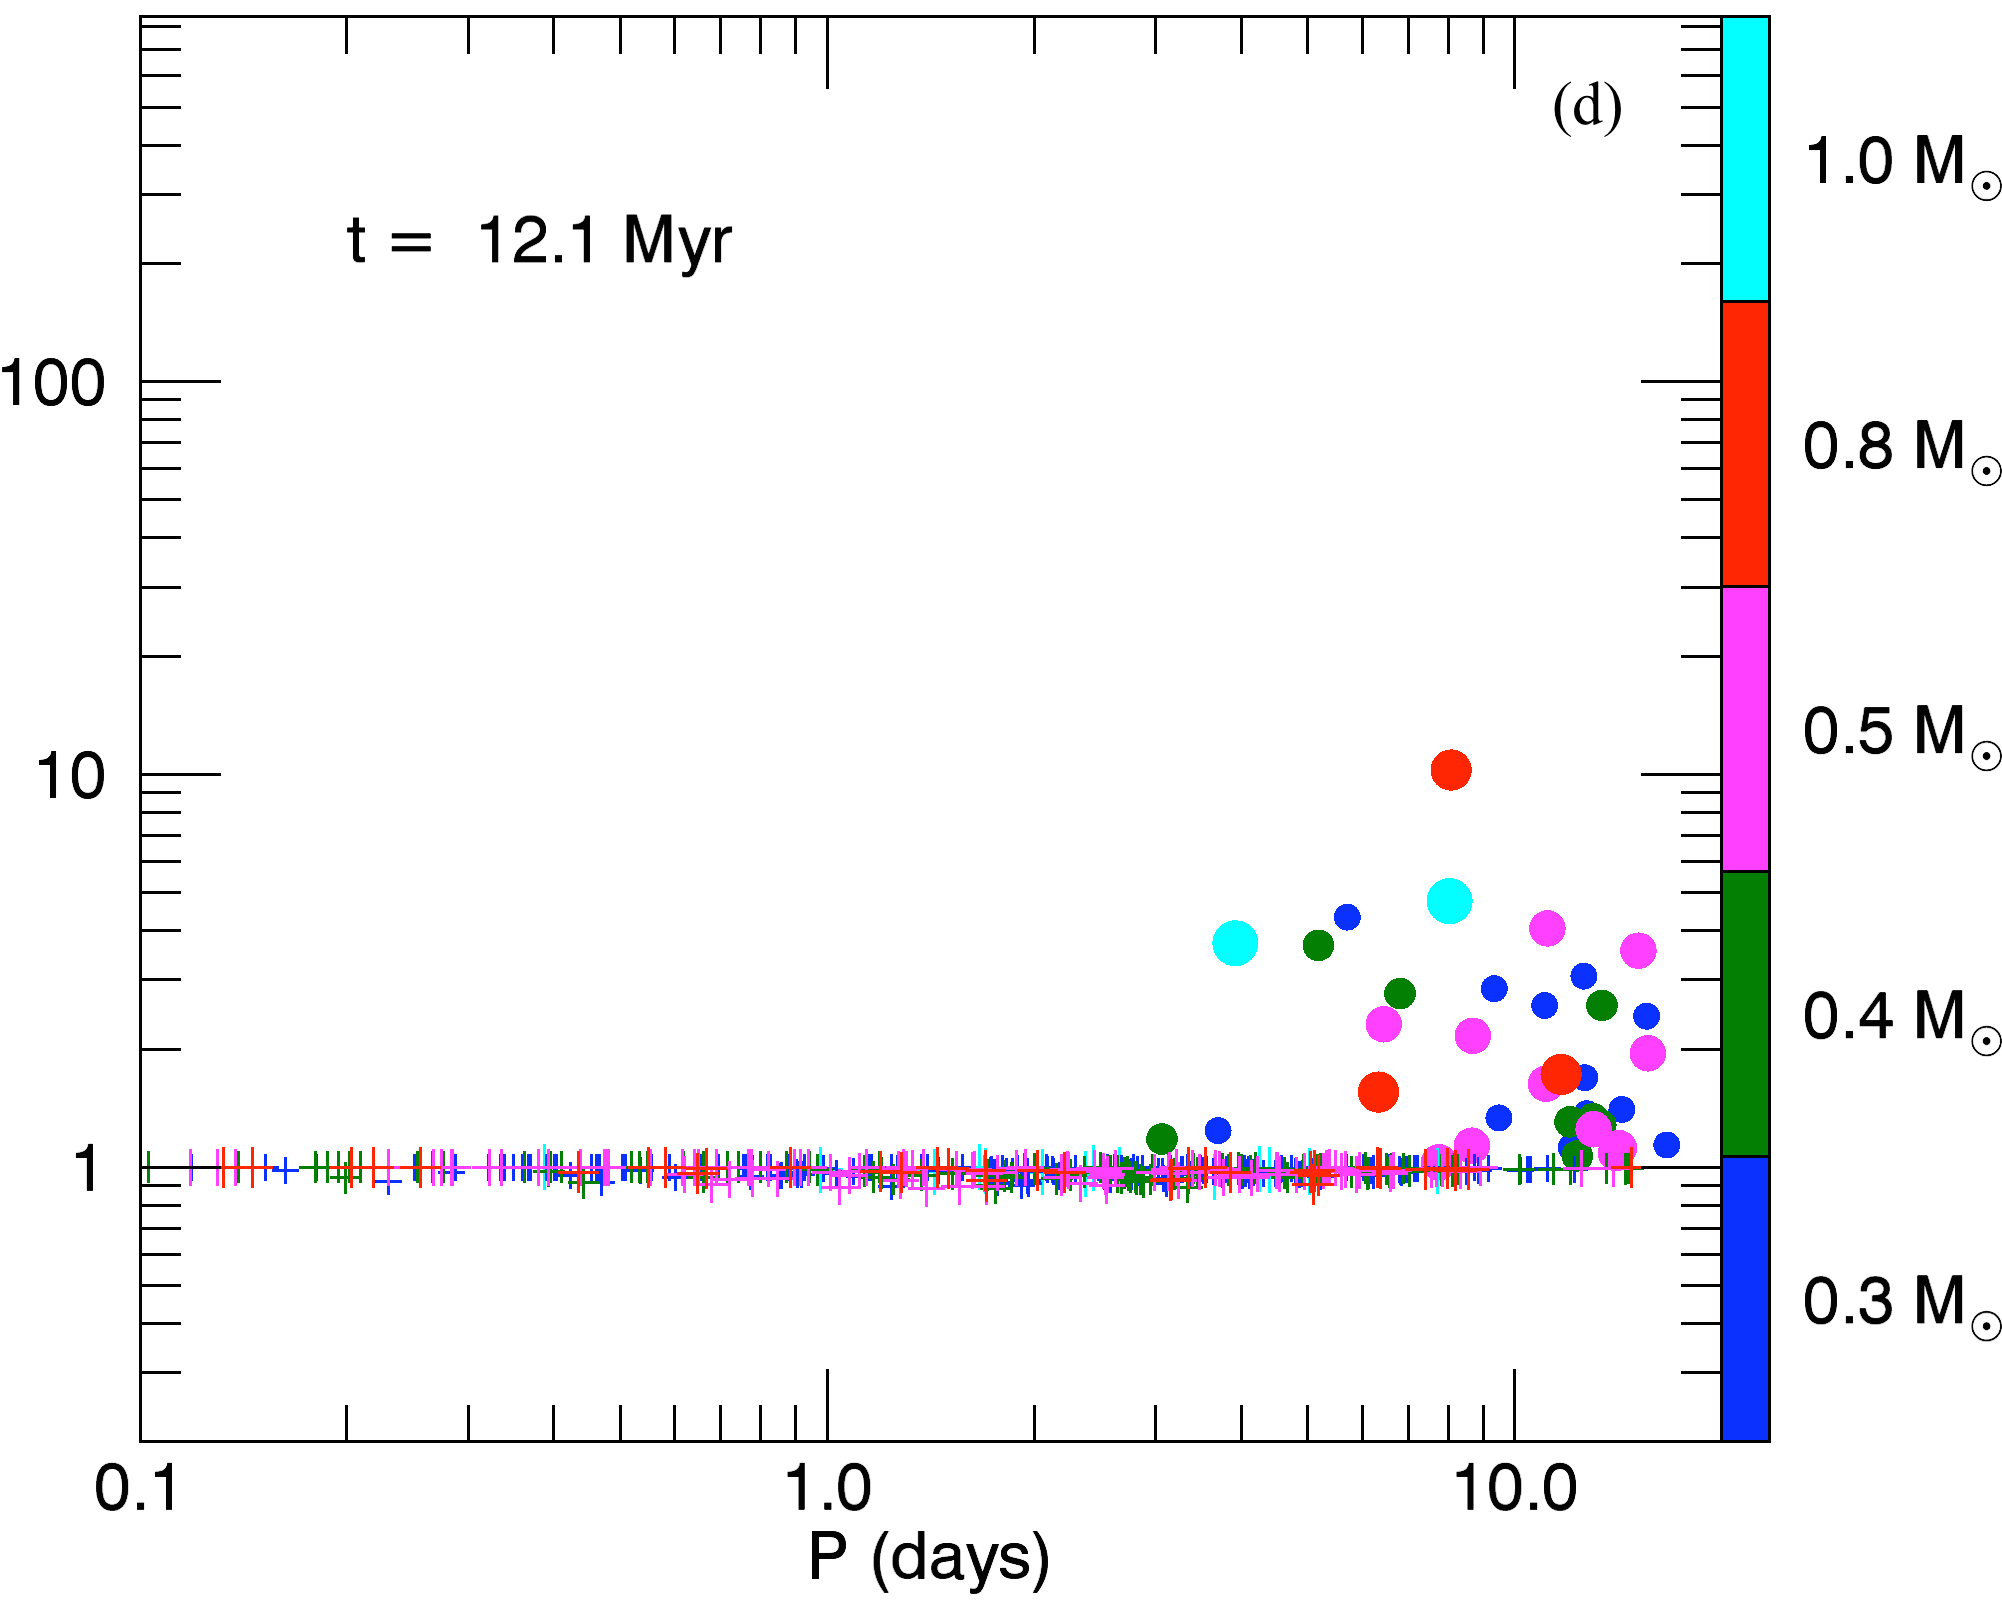
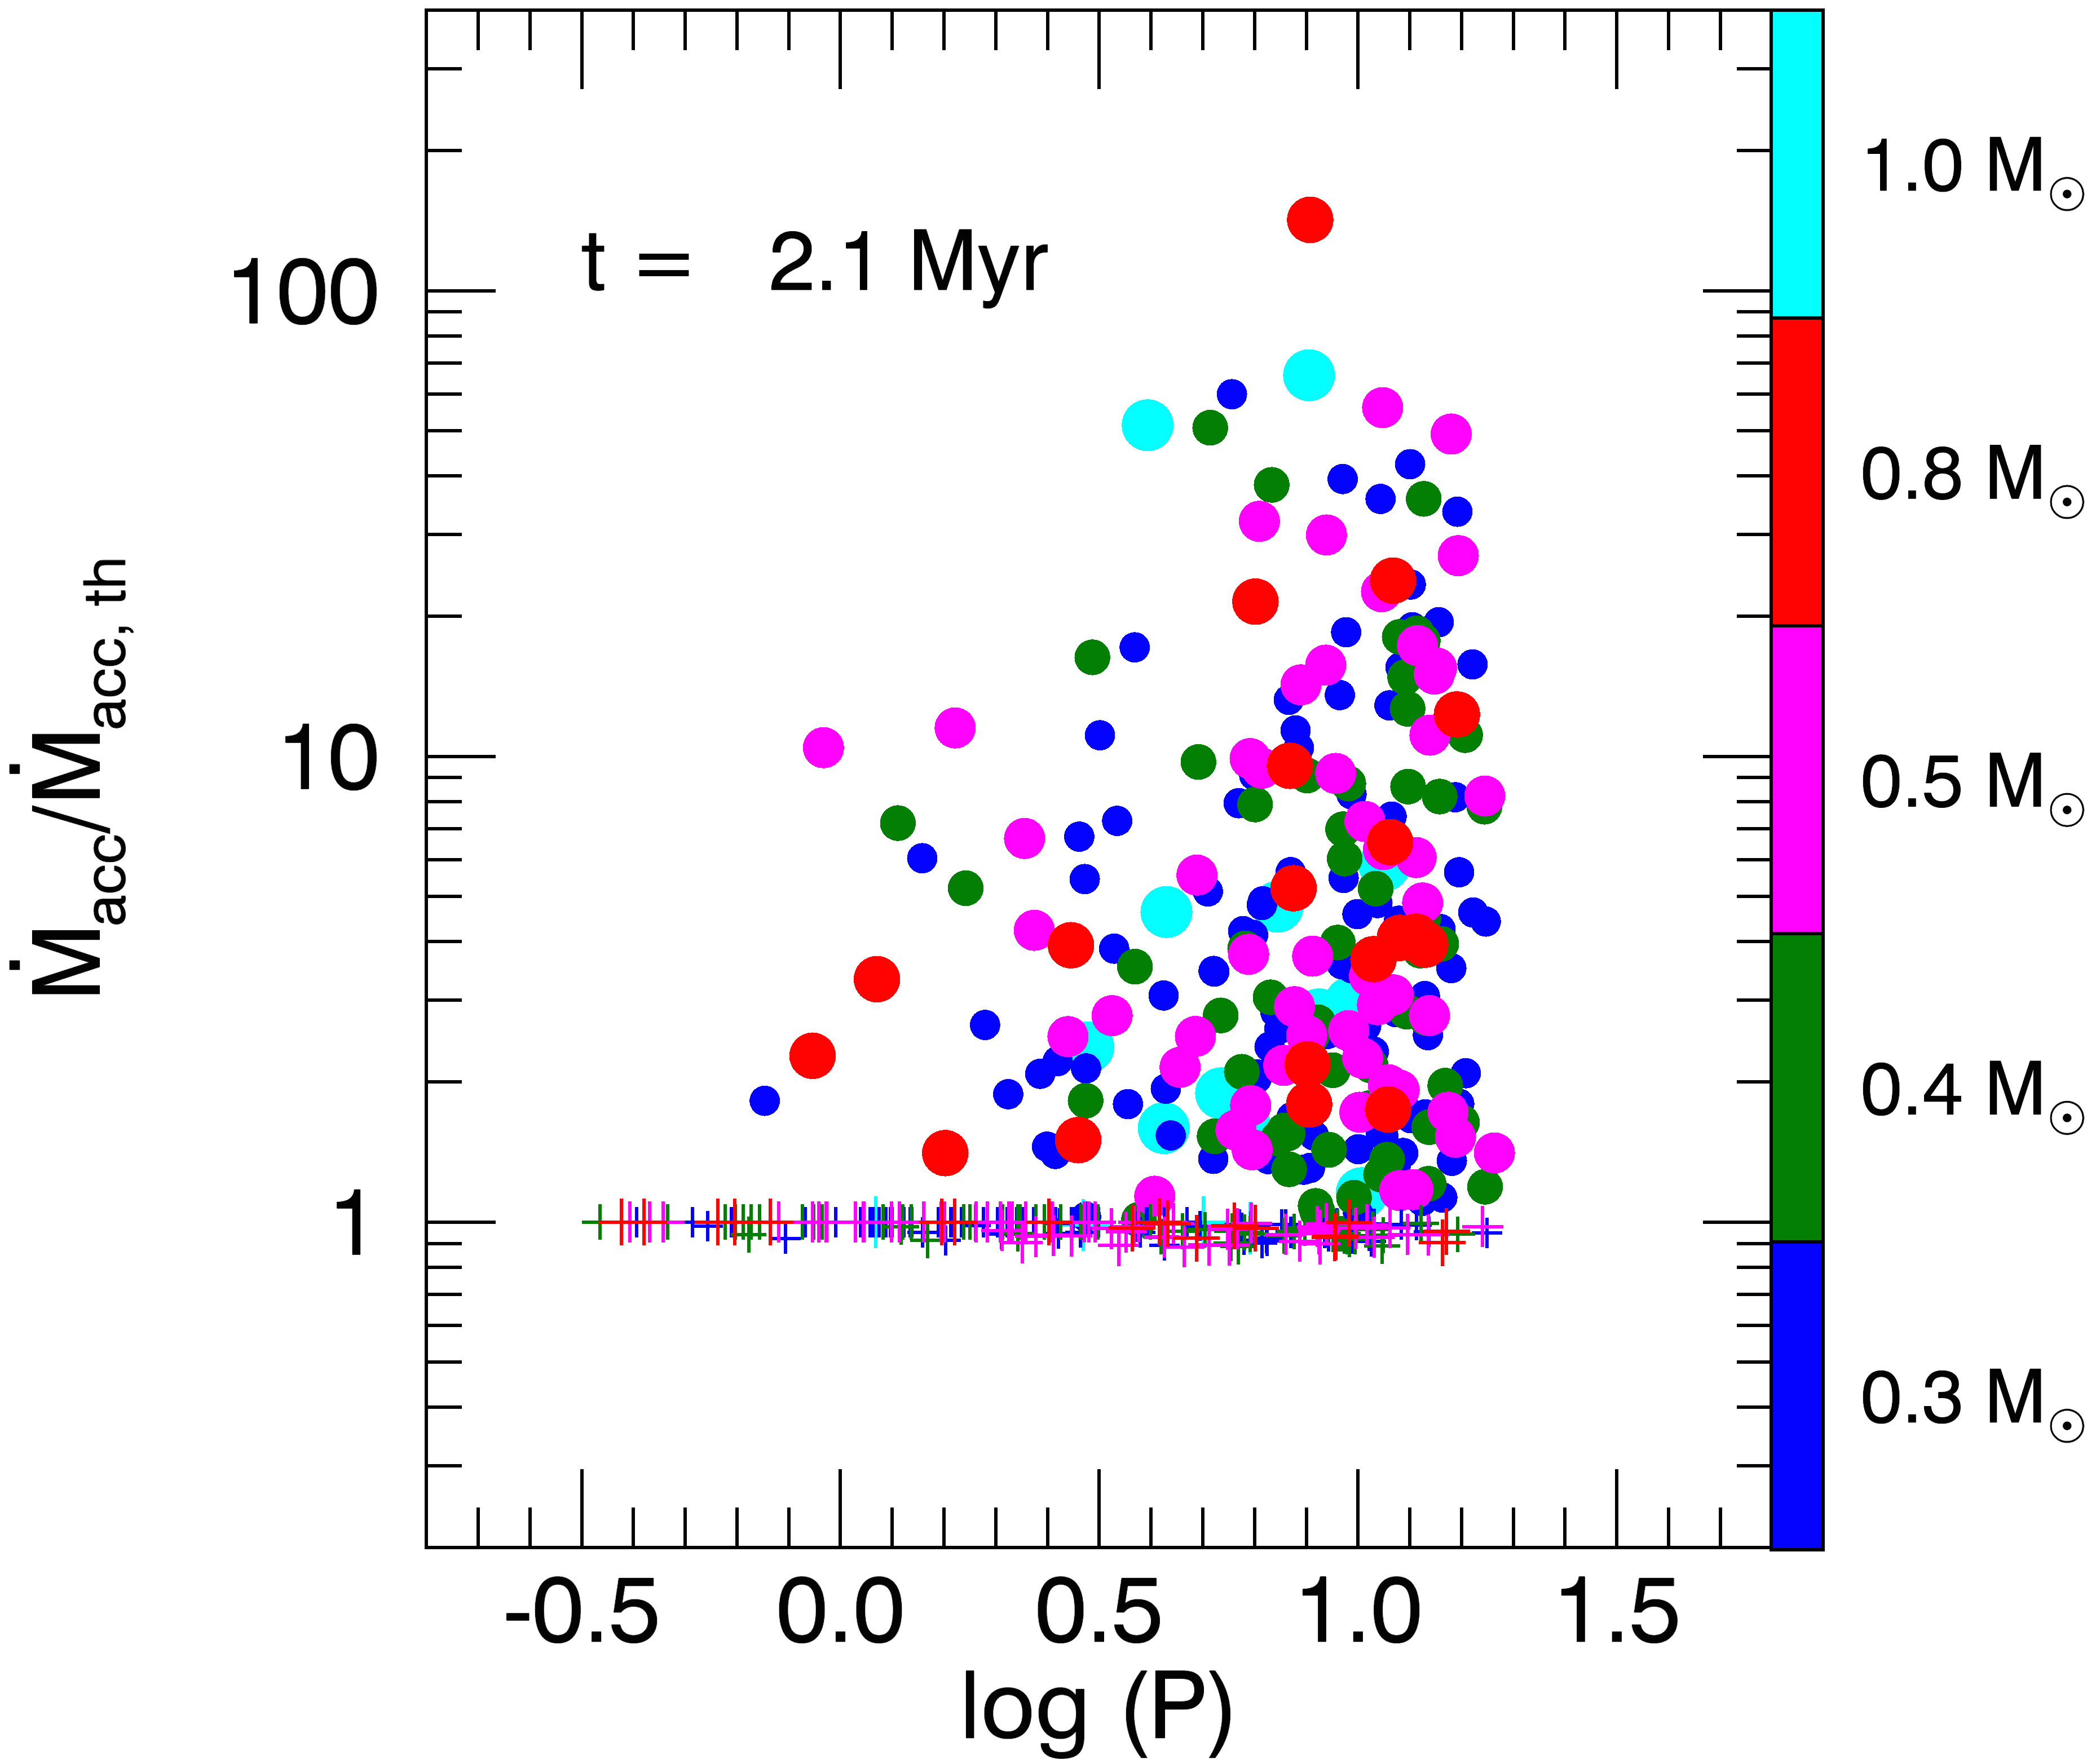
In order to further investigate if we can see a segregation in period due to the presence of a disk we plot, in Figure 9, the mass accretion rate normalized to the mass accretion rate threshold versus rotational period for the simulated sample at an age of 1.0, 3.1, 6.1, and 12.1 Myr. At t = 1.0 Myr, diskless stars are set at and none has a period longer than 10 days. Conversely, there are only few disk stars at short periods. As the population evolves, the period distribution of diskless stars gets wider, both towards longer and shorter periods. The former effect results from the evolution of disk stars that only recently have lost their disks and that have not had enough time to significantly spin up, thus yielding a population of long period diskless stars; the latter is due to the free spin up of initially diskless stars as they contract, thus shifting the bulk of the diskless stars rotational period distribution towards shorter periods. As a result, after a few Myr, the initially peaked diskless star period distribution spreads over the full range of periods from less than 1 day up to 15 days. In contrast, disk stars tend to fill the locus of longer periods, as they remain locked to their disk as they evolve. Hence, over time, the initial correlation between rotational periods and disks remains, but gets blurred by the widening of the period distribution of diskless stars. Yet, the short period locus remains depleted of disk stars at all ages, up to 12.1 Myr.
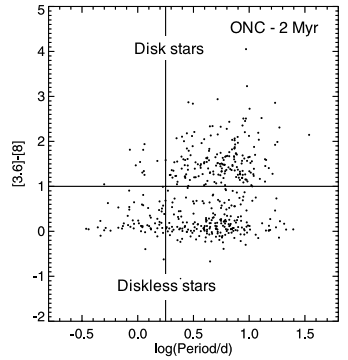
In Figure 10, we compare the simulated - plot at 2.1 Myr with the observed Spitzer IR excess vs. period plot for ONC from Rebull et al. (2006). It is not straightforward to translate mass accretion rate to Spitzer IR excess, and we therefore did not attempt such a conversion. Nevertheless, the mid-IR excess is expected to scale, at least in a statistical sense, with mass accretion rate. In this Figure, Rebull et al. (2006) show the [3.6] - [8] IRAC colors for 464 stars with measured periods in the Orion Nebula Cloud for which the mean age is about 2 Myr. Colors above [3.6] - [8] = 1 are indicative of the presence of disks. We clearly see in this Figure a deficit of disk stars at short periods and an accumulation of diskless stars at all periods. As discussed above, similar trends are seen at 2.1 Myr in our simulations: the diskless stars cover the full range of periods and there is a strong deficit of disk stars at P days. Hence, the simulated results of model M2 yield a good agreement with the observed IR - rotation plots.
3.2.4 Period - mass relationship
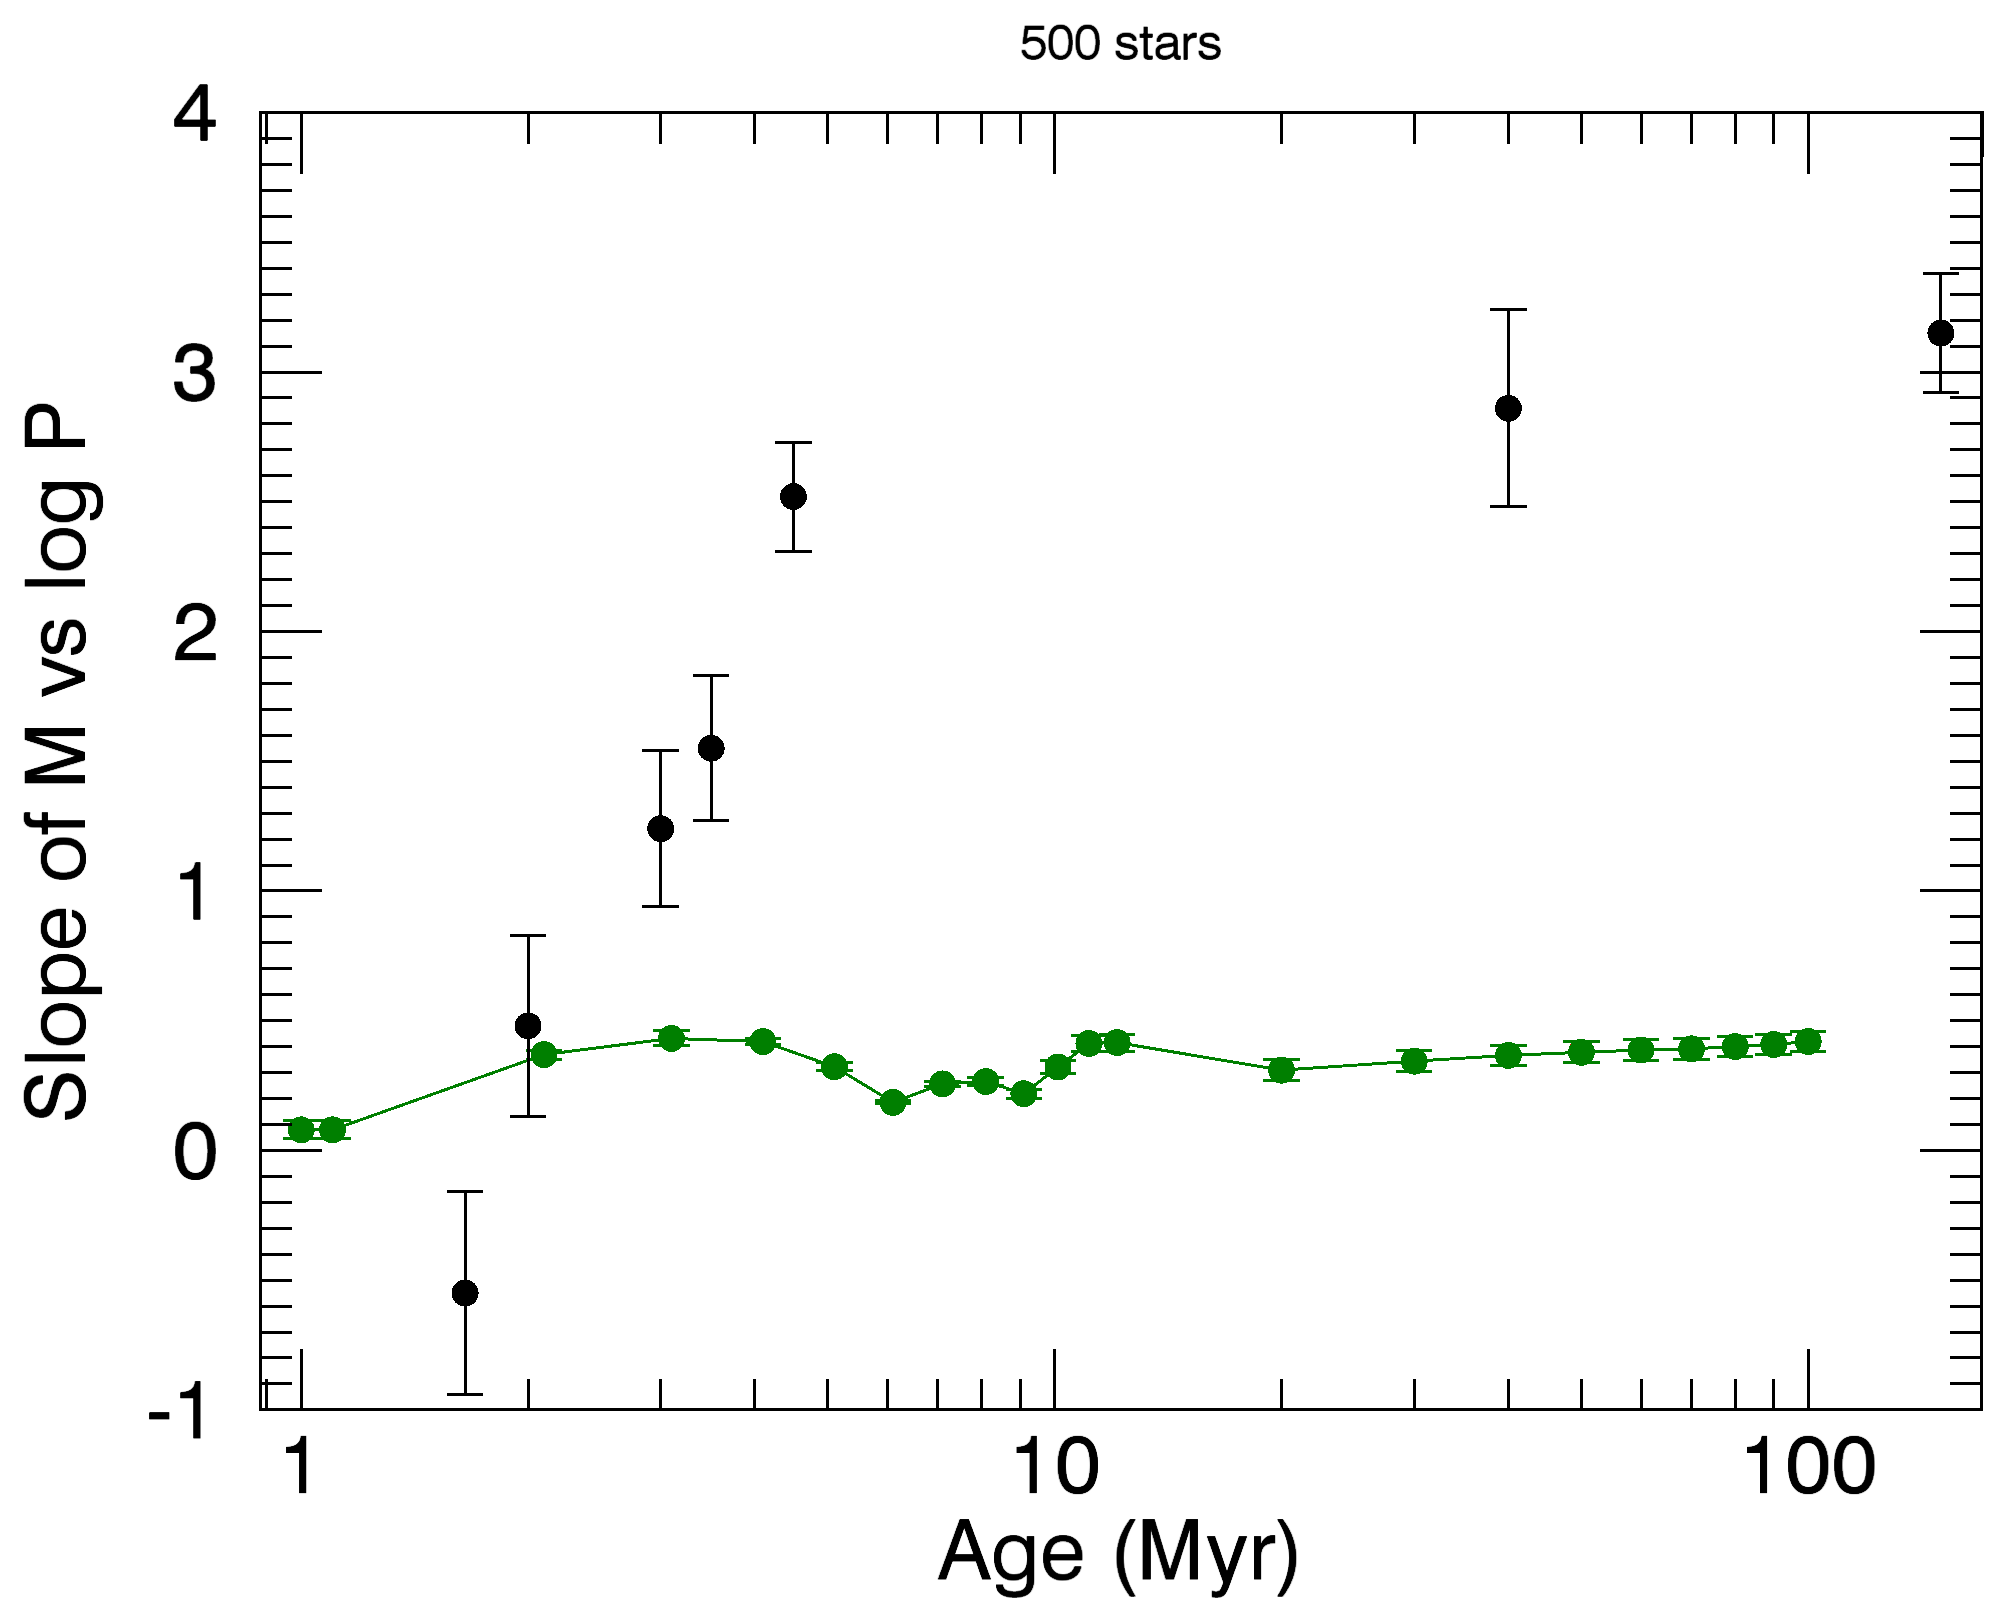
Henderson & Stassun (2012) investigated the period - mass relationship of 7 clusters (NGC 6530, ONC, NGC 2264, NGC 2362, IC 348, NGC 2547 and NGC 2516) with ages ranging from 1 - 2 Myr to 150 Myr. In analyzing low mass (0.2-0.5 M⊙) cluster members they found a positive correlation for older clusters, meaning that lower mass stars spin up faster than higher mass ones. Since the mass range we explore in our simulations does not extend down to 0.2 M⊙, we cannot claim that we can recover such a relationship, but we could perhaps expect some weaker correlation among the lowest mass stars of our sample. Following Henderson & Stassun (2012), we plot the slope of the P - mass relationship as a function of age in Figure 11. The slopes were calculated111Using the LINFIT function of IDL version 8.4 (Exelis Visual Information Solutions, Boulder, Colorado) which is based in a minimization algorithm. for the percentile of a random sample of 500 stars in the mass interval M/M as a function of mass. The slopes obtained from model M2 do not vary much with age and remain close to zero. This suggests that the rotational distributions are fairly independent of mass at very low masses in our simulations, a result clearly at odds with observations.
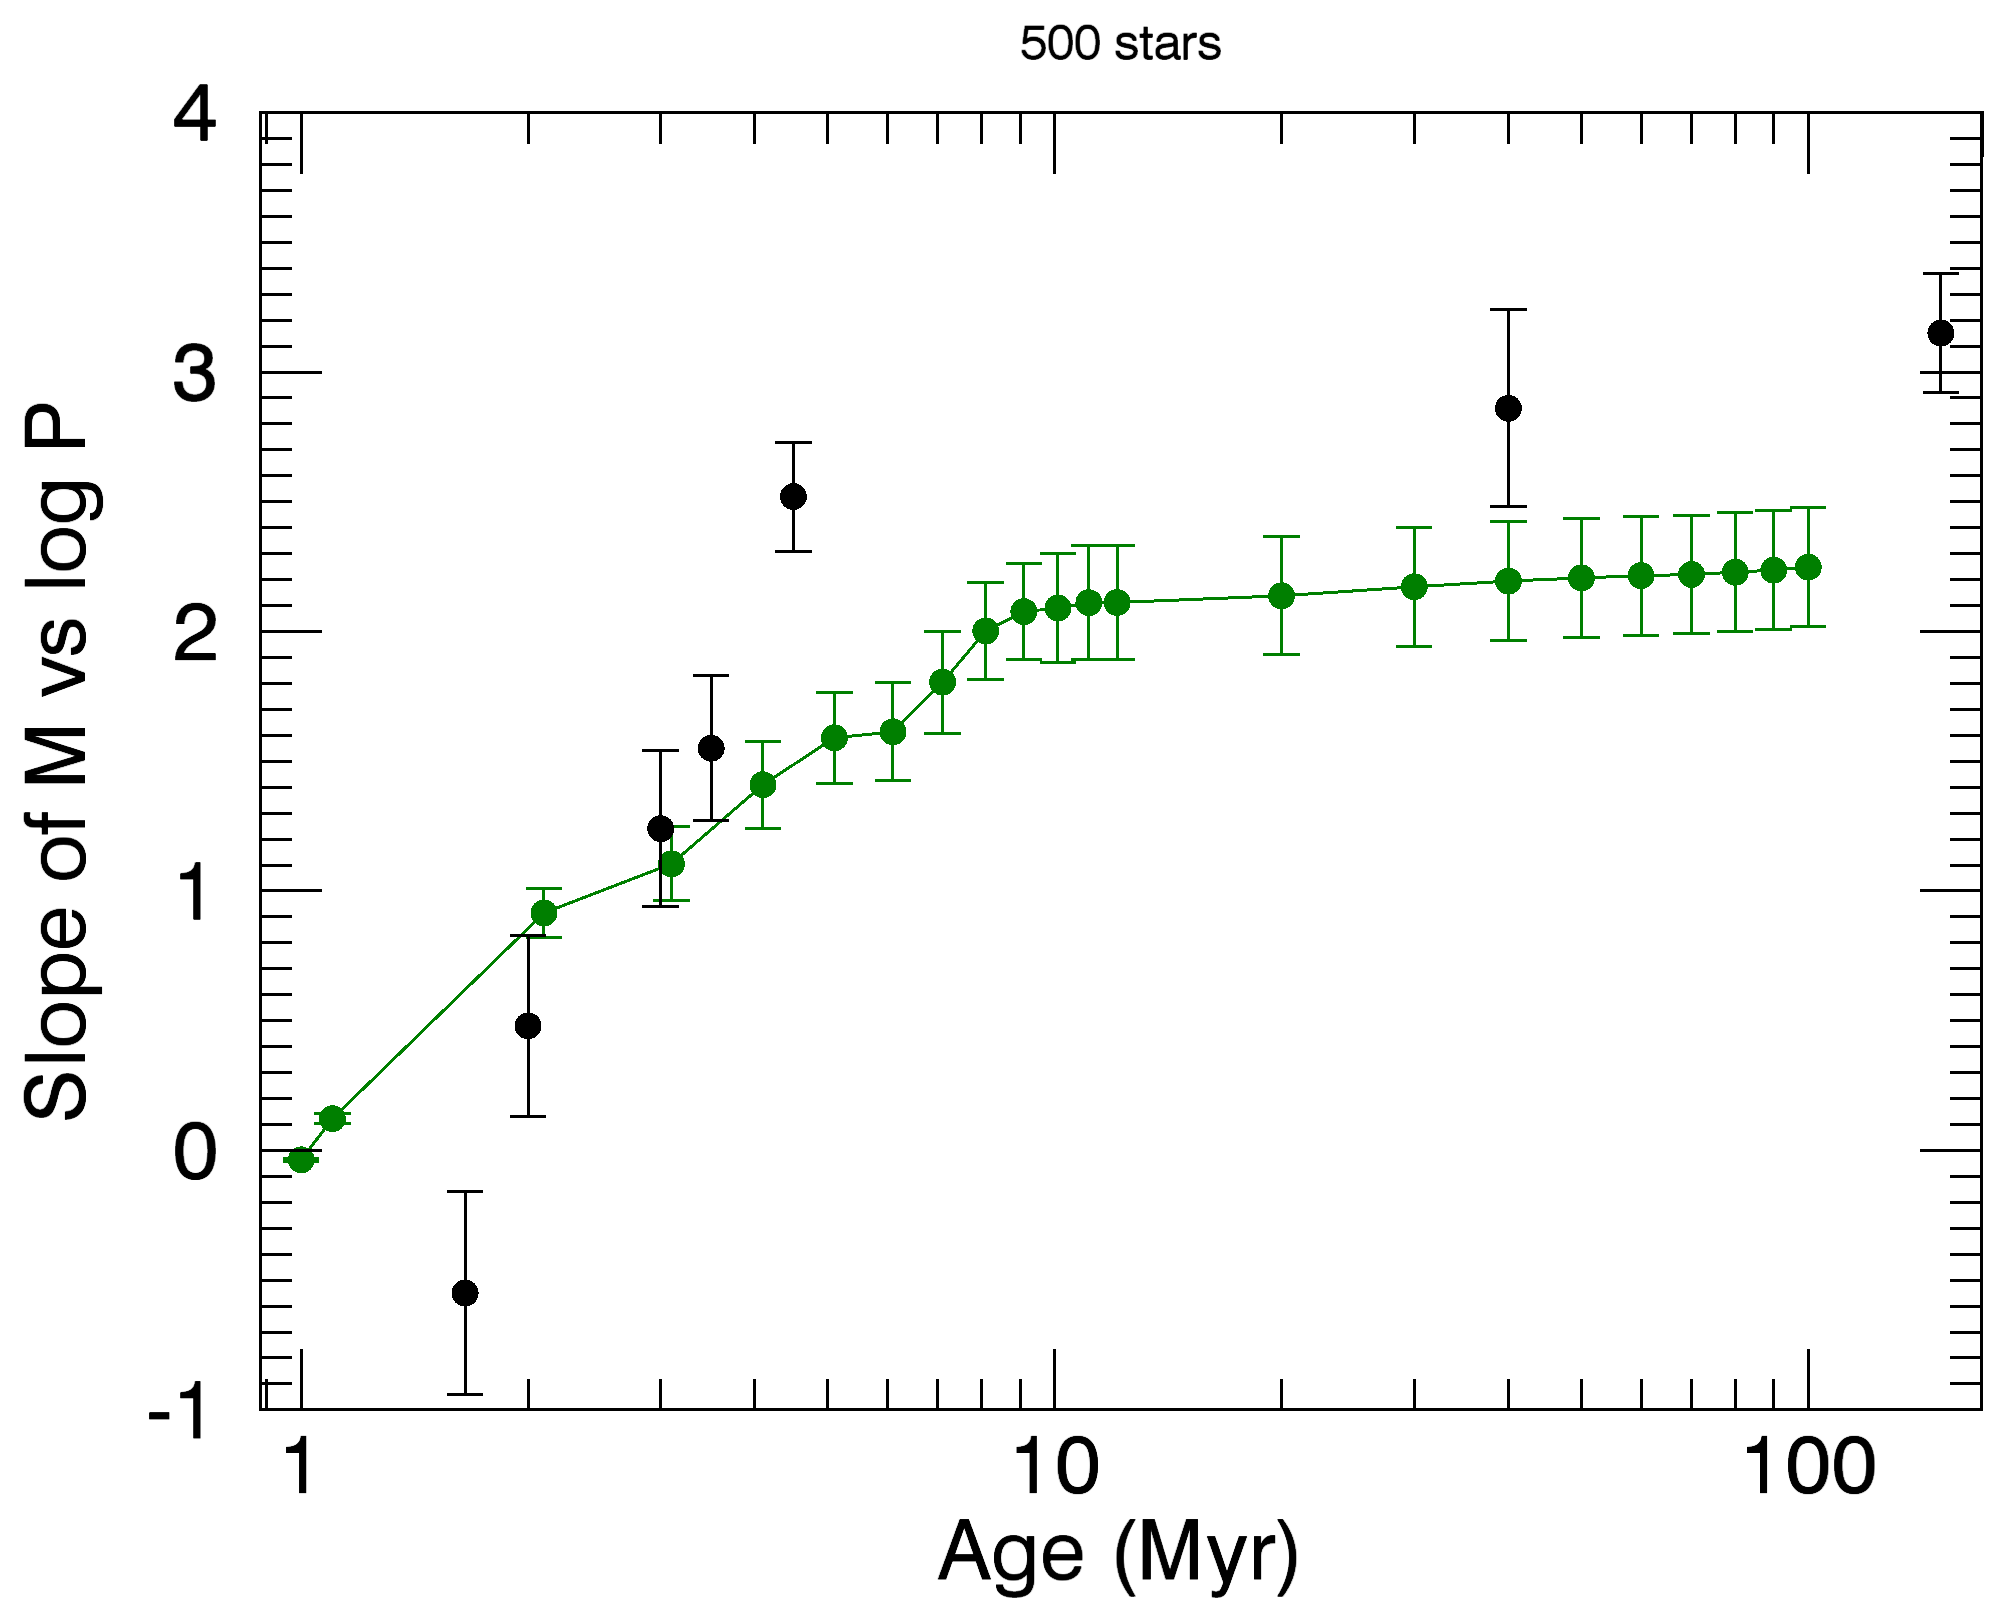
We therefore attempted another model with the same assumptions and parameters as model M2 but relaxing the disk locking assumption for the lowest mass stars. In the lowest mass bin, 0.3 M⊙, even a disk star is now assumed to evolve conserving its angular momentum. The results, shown in Fig. 11, yield positively increasing slopes as a function of time, which qualitatively matches the observations. This suggests that the disk locking might be less efficient at very low-masses, thus allowing these stars to spin up faster than higher mass ones (cf. Lamm et al. 2005; Bouvier et al. 2014).
3.2.5 Specific angular momentum evolution
Davies et al. (2014) calculated the specific angular momentum evolution of a sample of fully convective stars in Taurus-Auriga and in the ONC. They used new estimates of stellar radii and ages and classified their sample as Class II or Class III stars based on Spitzer IRAC fluxes. They found that the decreasing rate of the specific angular momentum during Class II phase is given by j t, with , which is faster than expected if the angular velocity is maintained constant. They interpreted this result as indicating that the braking rate of accreting young stars is larger than expected from disk-locking alone. They also observe the same time dependency for Class III objects, which they interpreted as initially accreting stars being sequentially released from their disks over a timescale of about 10 Myr.
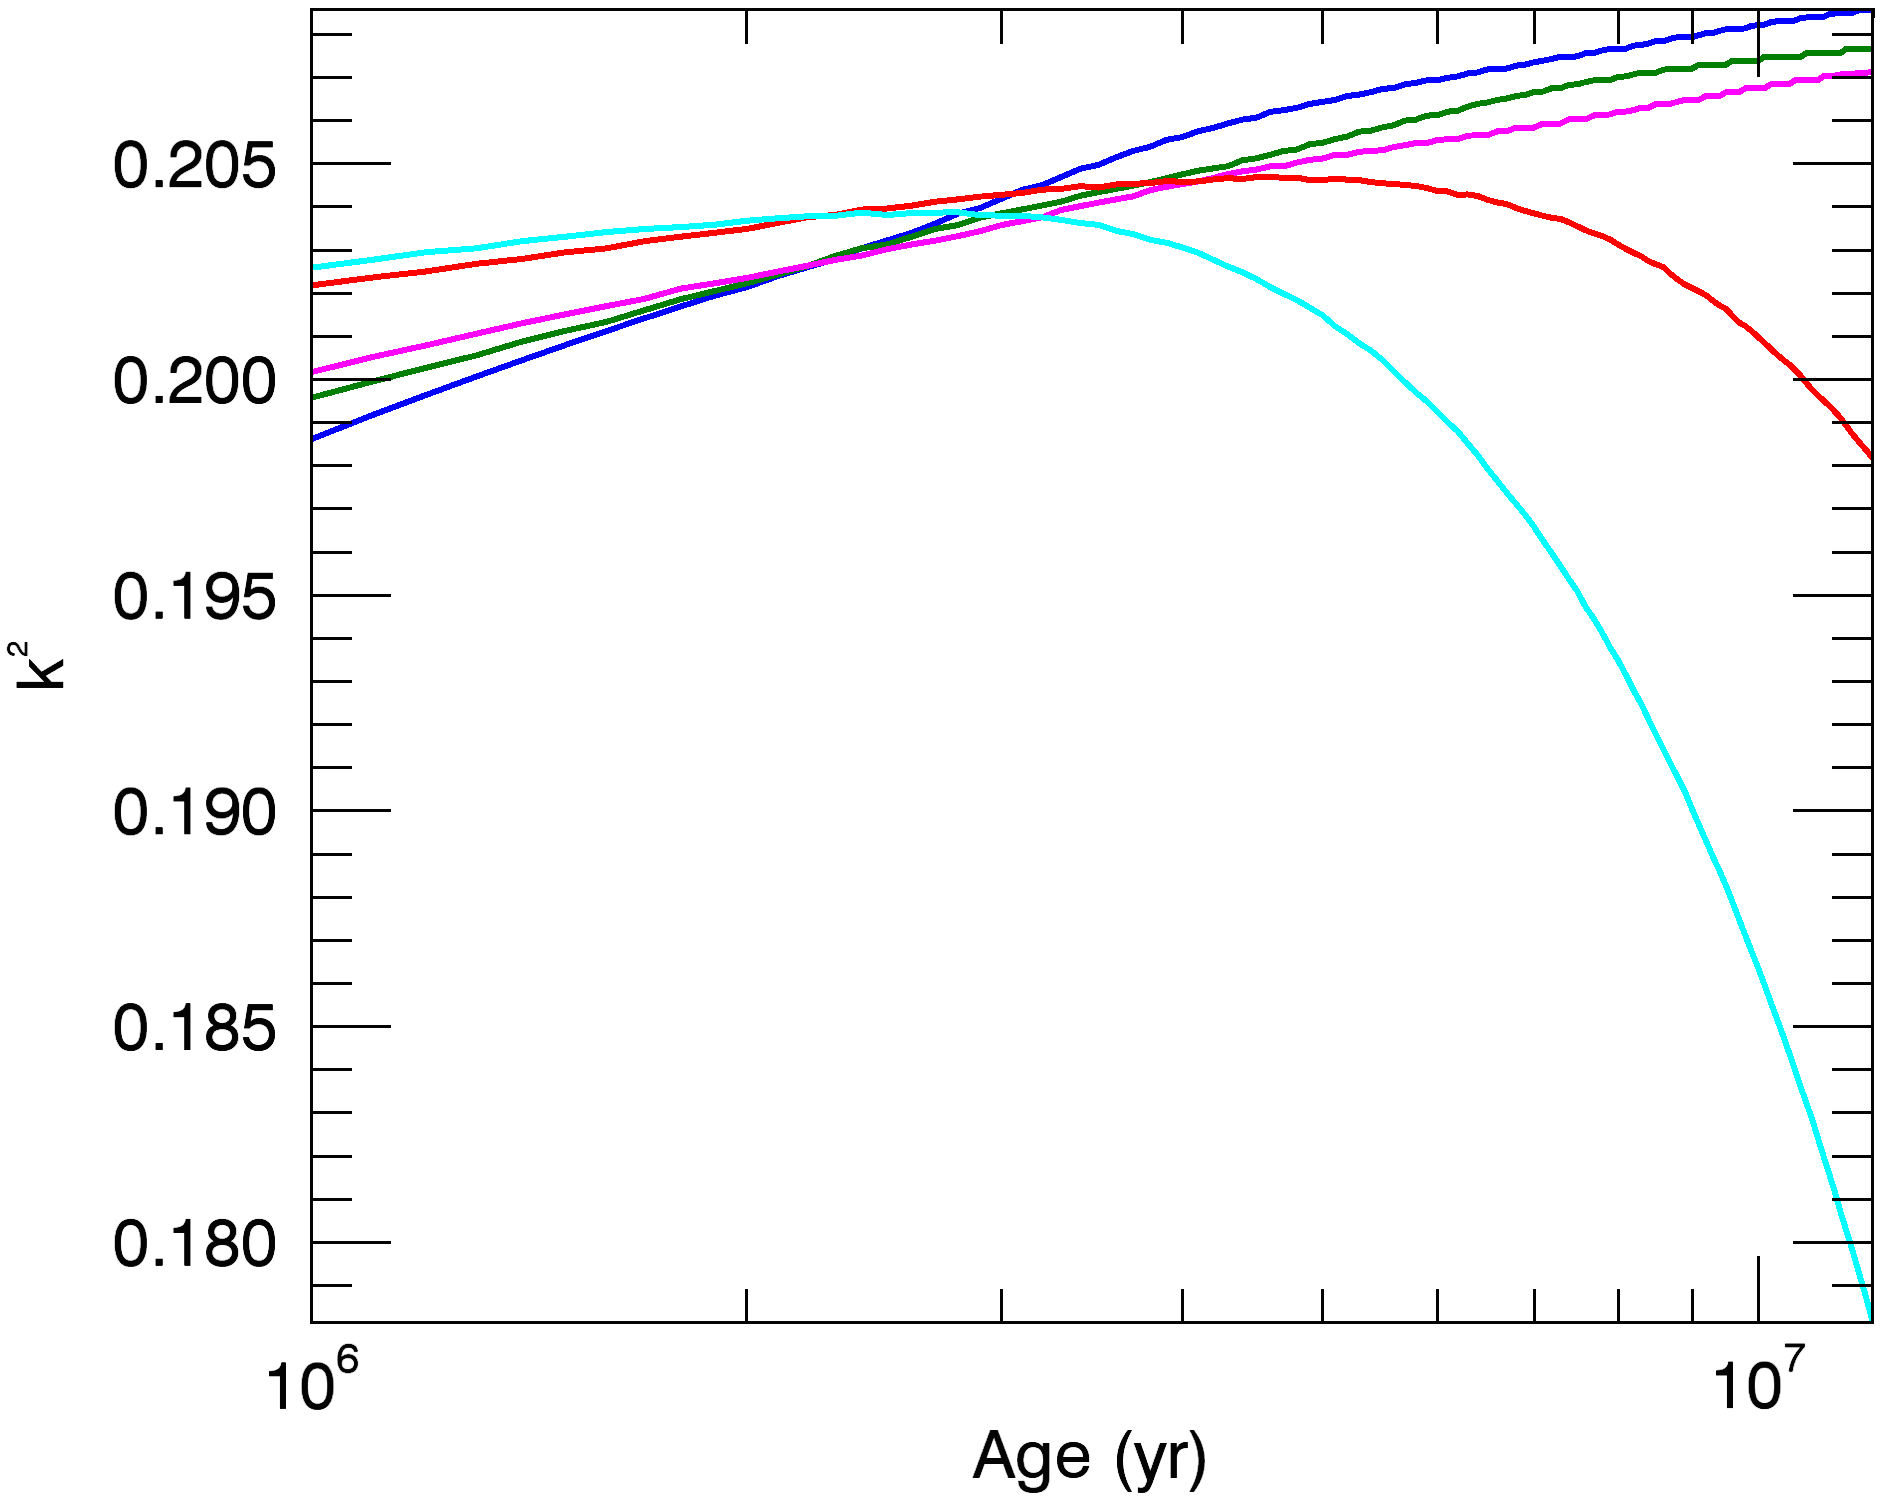
Using model M2 we calculated the specific angular momentum distribution of our population. As stated before, in our simulations, while a star has a disk, its angular velocity is kept constant. Then, for disk stars, we expect that the specific angular momentum, , varies with time as , if and , assuming that the time dependency of the gyration radius and the stellar radius can be expressed as power laws. Both are obtained from the stellar evolution models of Baraffe et al. (1998) and are shown in Figure 12 for each mass bin considered in this work. From 1 Myr to Myr, the gyration radius is approximately constant for all mass bins. At most, the gyration radius varies 1% for the 0.3 M⊙ mass bin. Beyond 3 Myr, the more massive stars start to develop a radiative core and the gyration radius of the 1 M⊙ decreases by about 15% at an age of 10 Myr, while the reduction is much less in lower mass stars. For the asymptotic power-law form above, we thus adopt , while in the simulations we use the actual, time-dependent values of the gyration radius provided by the stellar evolution models.
The variation of the stellar radius during the first few Myr mimics that of a fully convective polytrope (n=1.5), i.e., . Fig. 12 show that for M = 0.3 - 0.5 M⊙, the stellar radius falls off slightly more rapidly with time (), while the opposite is true for more massive stars. The exact values of , as derived from the stellar evolutionary models, are shown in Table 2. The mean value, however, is around -0.33 and we will consider that for the asymptotic form above. Then, the expected time dependency of the specific angular momentum in our simulations for disk-locked stars would be . For diskless stars, the angular momentum is held constant.
| Mass (M⊙) | 0.3 | 0.4 | 0.5 | 0.7 | 1.0 |
|---|---|---|---|---|---|
| -0.36 | -0.35 | -0.35 | -0.29 | -0.28 |
In Figure 13, the specific angular momentum, , is plotted as a function of time for our simulated sample and compared to observed samples of young stars. At t = 1 Myr, 75% of the simulated sample consists of disk stars. The magenta symbols show the specific angular momentum of two objects chosen from our simulations. One is initially fast rotating and diskless, and thus evolves conserving its initial angular momentum. The other is initially a slower rotator and has a disk lifetime of about 3 Myr. During this time, its specific angular momentum decreases as as expected, while it is held constant once the star is eventually released from its disk. When considered as a group, we find that the median specific angular momentum of disk stars in our simulation decreases with time as , i.e., close to the expectation for constant angular velocity. For diskless stars, we derive . Thus, while individual diskless stars evolve at constant angular momentum, when considered as a group their median angular momentum decreases in time nearly as fast as for disk stars. As already noted by Davies et al. (2014), this is the result of the stars being sequentially released from their disk over a wide range of disk lifetimes, from about 1 to 10 Myr.
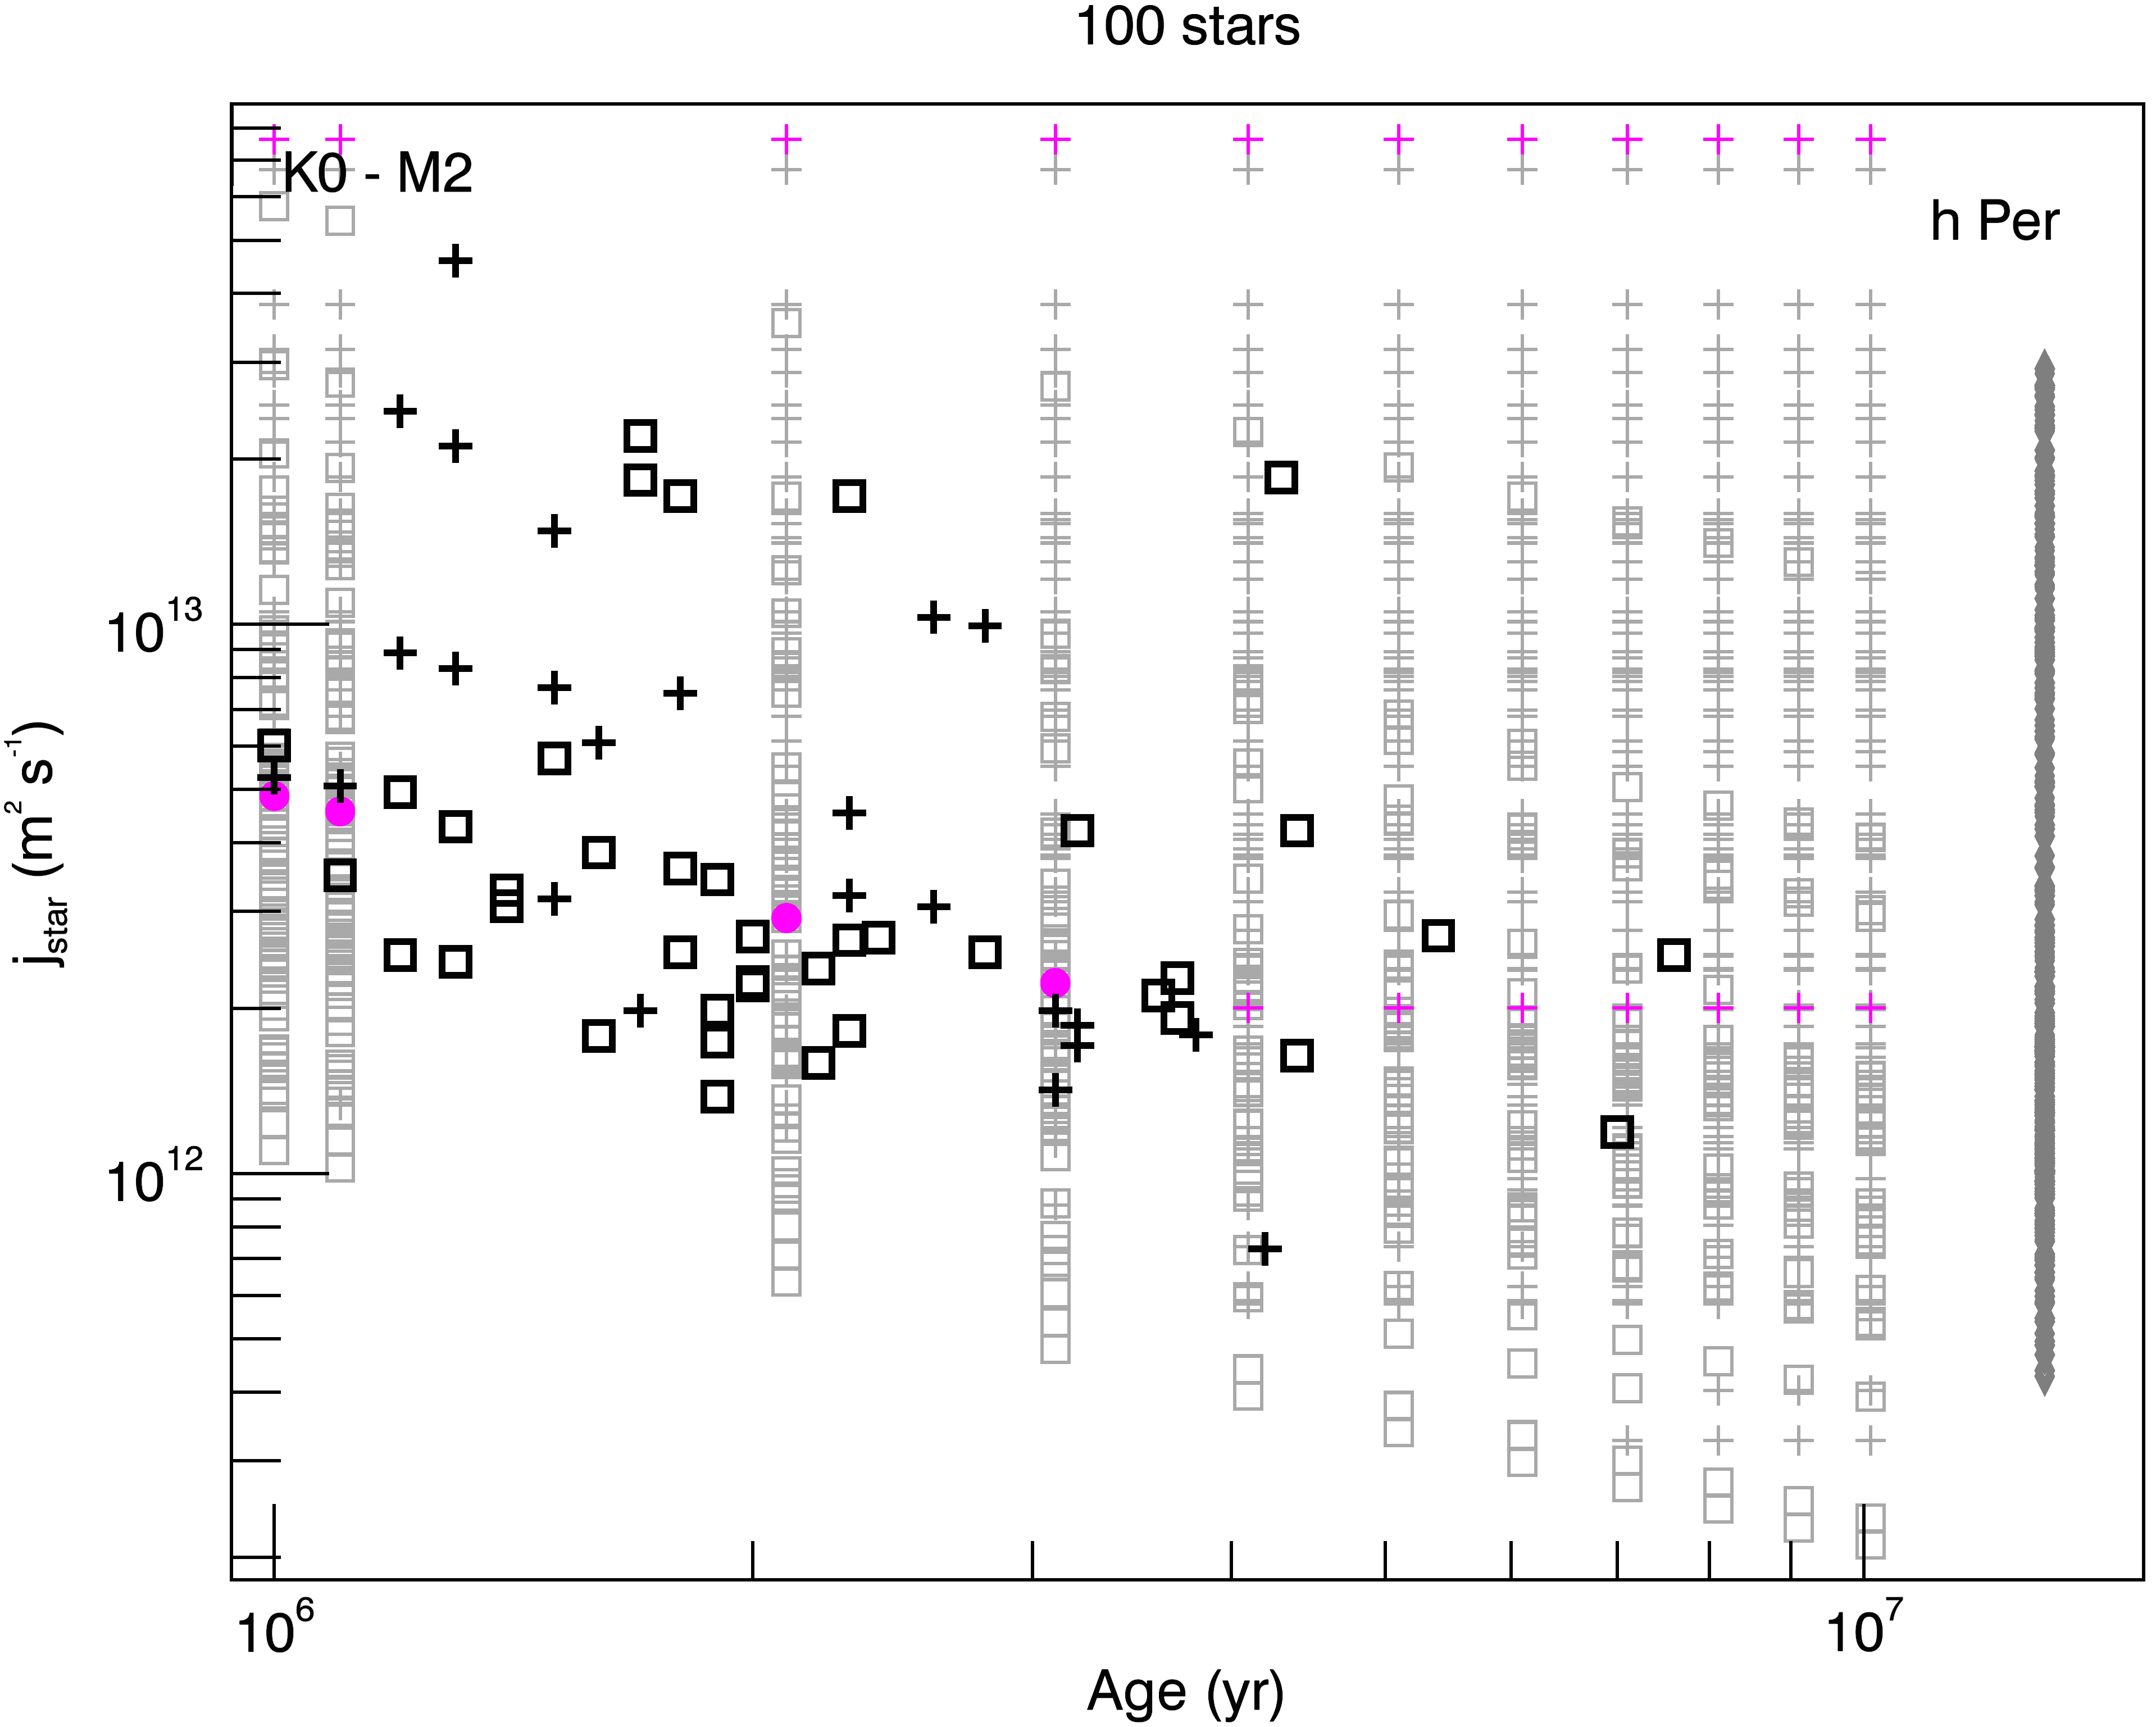
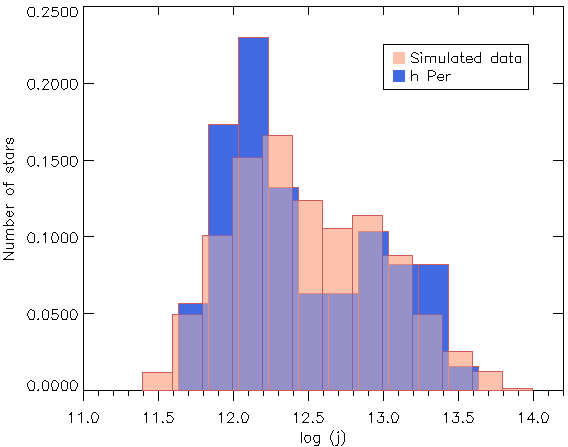
We compare our simulations to the distribution of the Taurus-Auriga and Orion samples from Davies et al. (2014)222Note that to allow for the comparison, we had to recompute their values of using actual gyration radii obtained from the Baraffe et al.’s models. Davies et al. (2014) used for most of their sample which applies to uniform density shells, while a value of is appropriate for fully convective PMS stars. We also neglected centrifugal effects in our simulations as they don’t impact significantly on the results.. The Taurus-Auriga and ONC estimates fall well within our range of values. We also plot the angular momentum values of h Per low mass members as derived by Moraux et al. (2013) at an age of 13 Myr, benchmarking the end of the accretion phase. A more detailed comparison of the angular momentum distribution of h Per members and that predicted by our simulations at 12.1 Myr is shown in Figure 14. While the distributions show differences, especially in the location of the peaks, the overall range of specific angular momentum is well accounted for. Indeed, this suggests that the angular momentum distribution of low-mass stars at the end of the PMS accretion phase builds up during the first few Myr, as the result of disk locking acting over a wide range of disk lifetimes, effectively widening the initial distribution (Bouvier et al. 1993; Rebull et al. 2004).
4 Conclusions
The Monte Carlo simulations presented here reproduce the main observed rotational properties of young low mass stars during their pre-main sequence evolution. We have shown that starting from now well-documented initial distributions of periods, mass-accretion rates and disk lifetimes, a model that assumes disk locking for accreting stars and angular momentum conservation for diskless stars succeeds in reproducing both the evolution of rotational period distributions in young clusters and the accretion-rotation connection observed between IR excess and rotational period at young ages. In order to also reproduce the mass-rotation connection, one has to further assume that disk locking is less efficient in very low mass stars, below 0.3 M⊙. Finally, the Monte Carlo simulations naturally produce the distribution of angular momentum observed at the end of the accretion phase, i.e., past 10 Myr. We show that this distribution, which is the starting point for the subsequent ZAMS and MS rotational evolution of low mass stars, builds up during the PMS as the disk locking process acts over a wide range of disk lifetimes, thus effectively widening the initial distribution of periods during PMS evolution.
Acknowledgements.
MJV is grateful to Florian Gallet and to Claire Davies for providing theoretical and observational data to this work, to Adriano Hoth Cerqueira and Andre Luis Batista Ribeiro for very useful discussions, and to Florian Gallet and to Adriano Hoth Cerqueira for a careful reading of the manuscript. MJV would like also to thank the financial support provided by CAPES (fellowship n. 2565-13-7) under the program “Science without borders” and by the project PROCAD – CNPq/CAPES number 552236/2011-0. JB acknowledges the support of ANR grant 2011 Blanc SIMI5-6 020 01 Toupies: Towards understanding the spin evolution of stars (http://ipag.osug.fr/Anr_Toupies/).References
- Affer et al. (2013) Affer, L., Micela, G., Favata, F., Flaccomio, E., & Bouvier, J. 2013, MNRAS, 430, 1433
- Baraffe et al. (1998) Baraffe, I., Chabrier, G., Allard, F., & Hauschildt, P. H. 1998, A&A, 337, 403
- Bell et al. (2013) Bell, C. P. M., Naylor, T., Mayne, N. J., Jeffries, R. D., & Littlefair, S. P. 2013, MNRAS, 434, 806
- Bouvier (2013) Bouvier, J. 2013, in EAS Publications Series, Vol. 62, EAS Publications Series, 143–168
- Bouvier et al. (1993) Bouvier, J., Cabrit, S., Fernandez, M., Martin, E. L., & Matthews, J. M. 1993, A&A, 272, 176
- Bouvier et al. (2014) Bouvier, J., Matt, S. P., Mohanty, S., et al. 2014, Protostars and Planets VI, 433
- Cieza & Baliber (2007) Cieza, L. & Baliber, N. 2007, ApJ, 671, 605
- Dahm & Hillenbrand (2007) Dahm, S. E. & Hillenbrand, L. A. 2007, AJ, 133, 2072
- Davies et al. (2014) Davies, C. L., Gregory, S. G., & Greaves, J. S. 2014, MNRAS, 444, 1157
- Gallet & Bouvier (2013) Gallet, F. & Bouvier, J. 2013, A&A, 556, A36
- Hartmann et al. (1998) Hartmann, L., Calvet, N., Gullbring, E., & D’Alessio, P. 1998, ApJ, 495, 385
- Henderson & Stassun (2012) Henderson, C. B. & Stassun, K. G. 2012, ApJ, 747, 51
- Hernández et al. (2008) Hernández, J., Hartmann, L., Calvet, N., et al. 2008, ApJ, 686, 1195
- Hernández et al. (2007) Hernández, J., Hartmann, L., Megeath, T., et al. 2007, ApJ, 662, 1067
- Kroupa et al. (2013) Kroupa, P., Weidner, C., Pflamm-Altenburg, J., et al. 2013, The Stellar and Sub-Stellar Initial Mass Function of Simple and Composite Populations, ed. T. D. Oswalt & G. Gilmore, 115
- Lamm et al. (2005) Lamm, M. H., Mundt, R., Bailer-Jones, C. A. L., & Herbst, W. 2005, A&A, 430, 1005
- Mamajek (2009) Mamajek, E. E. 2009, in American Institute of Physics Conference Series, Vol. 1158, American Institute of Physics Conference Series, ed. T. Usuda, M. Tamura, & M. Ishii, 3–10
- Manara et al. (2012) Manara, C. F., Robberto, M., Da Rio, N., et al. 2012, ApJ, 755, 154
- Moraux et al. (2013) Moraux, E., Artemenko, S., Bouvier, J., et al. 2013, A&A, 560, A13
- Rebull et al. (2006) Rebull, L. M., Stauffer, J. R., Megeath, S. T., Hora, J. L., & Hartmann, L. 2006, ApJ, 646, 297
- Rebull et al. (2004) Rebull, L. M., Wolff, S. C., & Strom, S. E. 2004, AJ, 127, 1029
- Ribas et al. (2014) Ribas, Á., Merín, B., Bouy, H., & Maud, L. T. 2014, A&A, 561, A54
- Rigliaco et al. (2011) Rigliaco, E., Natta, A., Randich, S., Testi, L., & Biazzo, K. 2011, A&A, 525, A47
- Spezzi et al. (2012) Spezzi, L., de Marchi, G., Panagia, N., Sicilia-Aguilar, A., & Ercolano, B. 2012, MNRAS, 421, 78
- Venuti et al. (2014) Venuti, L., Bouvier, J., Flaccomio, E., et al. 2014, A&A, 570, A82