An incompressible state of a photo-excited electron gas
Abstract
Two dimensional electrons in a magnetic field can form new states of matter characterized by topological properties and strong electronic correlations as displayed in the integer and fractional quantum Hall states. In these states the electron liquid displays several spectacular characteristics which manifest themselves in transport experiments with the quantization of the Hall resistance and a vanishing longitudinal conductivity or in thermodynamic equilibrium when the electron fluid becomes incompressible. Several experiments have reported that dissipation-less transport can be achieved even at weak, non-quantizing magnetic fields when the electrons absorb photons at specific energies related to their cyclotron frequency. Compressibility measurements on electrons on liquid helium demonstrate the formation of an incompressible electronic state under these resonant excitation conditions. This new state provides a striking example of irradiation induced self-organization in a quantum system.
pacs:
Physical sciences/Physics/Condensed-matter physics/Quantum fluids and solids and Quantum HallIntroduction
The discovery of the integer and fractional quantum Hall effects Klitzing ; Tsui ; Jain ; Novoselov ; Kim2005 ; Kim2009 revealed the existence of new states of matter characterized by topological properties and strong electronic correlations triggering an intense theoretical and experimental research activity. These efforts lead to a detailed microscopic understanding of the main experimental phenomena and to some of the most beautiful conceptual breakthroughs in condensed matter physics Ezawa . The observation of a new dissipationless transport regime at low magnetic fields under microwave irradiation mani2002 ; zudov2003 raised a new challenge regarding our understanding of two dimensional electron systems. Microwave induced zero resistance states (ZRS) appear at high microwave excitation powers when the ratio between the photon energy and Landau level spacing is close to a value within the fraction series: . In theory however, the motion of electrons in a magnetic field in ultra-clean samples is well described as a harmonic oscillator where the selection rules only allow transitions between nearby oscillator states corresponding to . The theoretical explanations proposed so far, have attempted to resolve this contradiction by considering the role of sharp inhomogeneities due to a short-range disorder potential Girvin ; Dmitriev ; review , edges ToulouseEdge ; Levin and contacts Mikhailov . The dominant microscopic picture for ZRS is currently an ensemble of domains with vanishing local conductivity review , but the formation of a collective state with long range order has also been suggested ToulouseS1 ; ToulouseS2 . So far, the experimental evidence does not provide a definite proof in support of one of the available models and despite intense experimental efforts West2004 ; Smet ; Zudov2006 ; Mani2009 ; Wiedmann ; Dorozhkin ; Mani2011 the microscopic nature of ZRS remains a puzzle. One of the difficulties is that while the manifestations of ZRS in transport phenomena are spectacular, such as vanishing longitudinal resistance, other indications of these novel electronic states remain elusive.
The observation of ZRS for surface electrons on helium under intersubband excitation Denis2 ; Denis1 has opened a new research direction in this field since the strong Coulomb interactions in this system allow collective effects, such as for example Wigner crystallization, to be observed more readily andrei ; monarkha_book . Previously, we reported a strong redistribution of the electron density under irradiation which coincided with the appearance of ZRS DenisTlse , although the underlying mechanism was not elucidated. Since the formation of ZRS in a Hall system coincides with vanishing conductivity, the observed redistribution may simply be a consequence of the expected long charge relaxation rates in this regime. In the experiments presented here, we systematically study the behaviour of the electronic density under irradiation and demonstrate a regime in which electrons stabilize at a fixed steady-state density independent of their initial density profile and the electrostatic confinement potential. Since in this regime the electron density is not changed by an increase of the holding electrostatic forces which tend to compress the electron cloud, we describe this new phase of the electron gas as an incompressible state.
Results
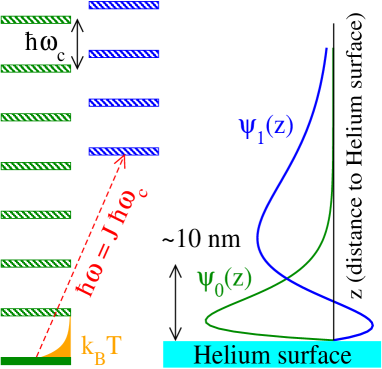
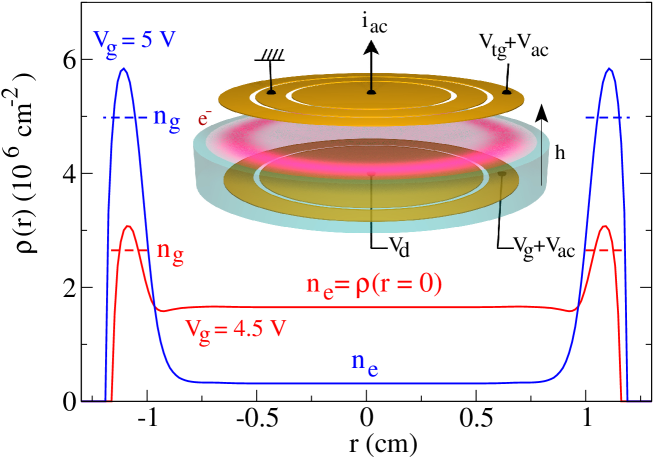
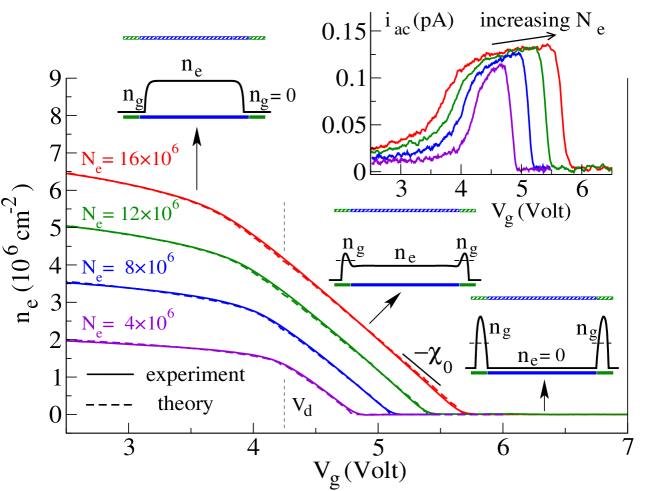
Description of the system: A population of electrons us trapped on a liquid helium surface forming a nondegenerate two-dimensional electron gas. The energy levels accessible to the surface electrons in a quantizing perpendicular magnetic field are shown in Fig. 1. They are formed by Landau levels separated by energy and intersubband excitations of energy perpendicular to the helium surface andrei ; monarkha_book . Our experiments are performed at a temperature of much smaller than the Landau level spacing so that in equilibrium the electrons mainly fill the lowest Landau level, whereas under resonant irradiation at energy , they can be excited into another subband manifold Denis2 ; Denis1 . Note that the two level system formed by the two subbands has been proposed as a candidate system for quantum computing Dykman1999 . Spatially, the electrons are distributed between two regions on the helium surface (see Fig. 2), a central region above the disc-shaped electrode at potential and a surrounding guard region above the ring electrode held at potential . We denote and as the mean electron densities in the central and guard regions respectively. As in a field effect transistor and can be controlled by changing the potentials and . The key difference here is that for surface electrons the total number of electrons in the cloud is fixed as long as the positive potentials and are sufficiently strong to balance the electron-electron Coulomb repulsion. Examples of simulated electron density profiles for different values of are shown in Fig. 2, the simulations were performed within an electrostatic model as described in Wilen ; Kovdrya ; Fabien2014 .
In addition to controlling the density profile of the electron cloud , the potentials and also change the perpendicular holding field in the cell . To avoid this unwanted effect in our experiments, we fixed the value of and changed the potential simultaneously with keeping the difference between top and bottom guard electrode voltages equal to . This choice ensures a uniform value of across the cell. Since lowering the potential compresses the electron cloud towards the center of the helium cell, we define the compressibility of the electron system as . In this definition, the electrostatic potential plays the role of the chemical potential in quantum Hall systems. This difference is due to the non-degenerate statistics for electrons on helium for which the Fermi energy is much smaller than the thermal energy.
Compressibility in equilibrium: we developed the following method to measure the compressibility of the electron cloud. An AC voltage excitation with amplitude was applied on the top and bottom guard electrodes (see Fig. 2) at a low frequency , for which the electron density quasi-statically follows the driving potential. The induced modulation of was measured by recording the AC current created by the motion of image charges on the top central electrode with radius . The correspondence between the variation of and was established using plane capacitance electrostatics, for which an electron trapped at the middle of the cell induces half an image charge of on the top electrode. The use of a simplified electrostatic model is justified here, since the gradients of are located away from the electrode on which is measured. This leads to the following expression for the compressibility :
| (1) |
The presented measurement technique has a strong similarity to that used in compressibility experiments in the quantum Hall regime Tessmer , providing an additional justification for our definition of compressibility. In supplementary note 1, we provide a more thorough discussion on our definition of compressibility and give a detailed derivation of Eq. (1) which is explained in supplementary note 2.
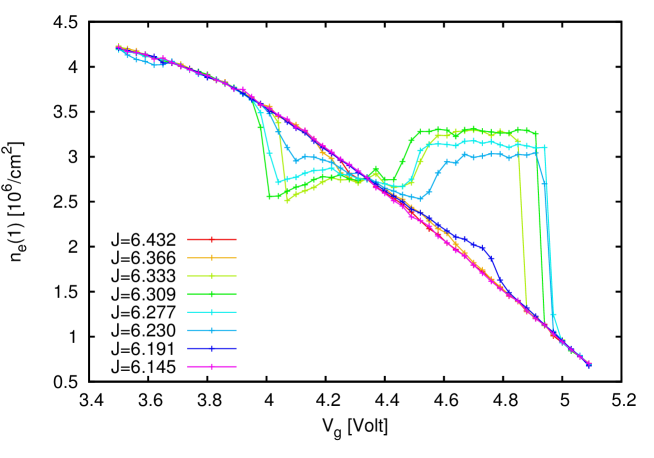
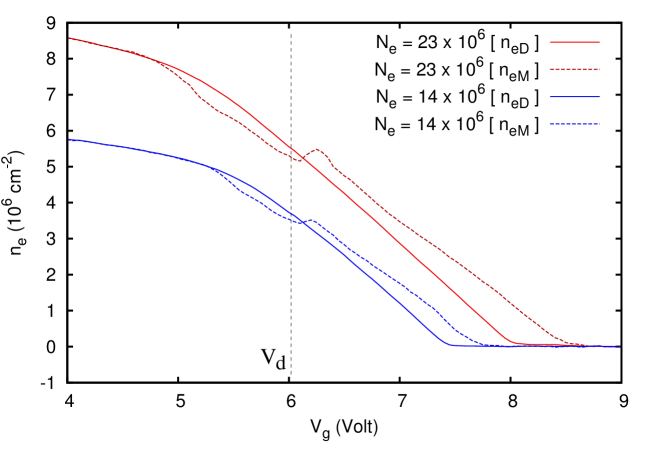
Using Eq. (1), the dependence can be reconstructed by integrating with respect to starting from the high limit where . The obtained results are illustrated in Fig. 3 which shows and the corresponding density as a function of for several values. The experimental curves for are compared with the results of electrostatic simulations Wilen ; Kovdrya ; Fabien2014 ; Badrutdinov that use the total electron number as the single fitting parameter for each of the obtained curves. The simulations exhibit an extremely good agreement with the experimental results. The dependence can be understood as follows: a large positive potential attracts the electrons towards the guard electrodes, whereas at low the electrons are repelled from the guard region and concentrate at the center of the cell. The potential from the guard electrodes is then almost completely screened, leading to a value of that is almost independent of . At intermediate , electrons occupy both the central and guard regions. In this case decreases linearly with increasing until the central region becomes completely depleted. At this point regardless of the value of . In the intermediate regime the compressibility depends only weakly on the total number of trapped electrons and the values of the confining potentials. This observation can be understood by considering a simplified electrostatic model in which the two electron reservoirs in the disc and guard are treated as plane capacitors. This model, which is presented in more detail in supplementary note 3, leads to a value for that depends only on the geometrical cell parameters (provided the disc/guard reservoirs are not empty):
| (2) |
here, is the cell height, and are the surface areas of the bottom disc/guard electrodes ( being the outer radius of the guard electrodes) and is the vacuum permittivity. We experimentally find in good agreement with the estimation obtained using the geometrical cell parameters and . This reference value will be used to normalize the compressibility in our following experiments.
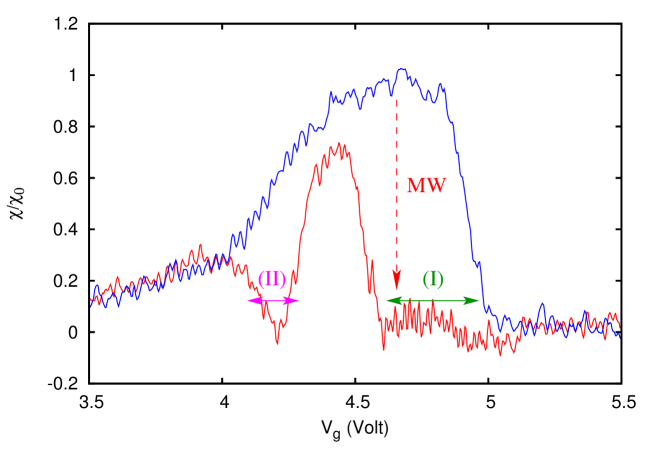
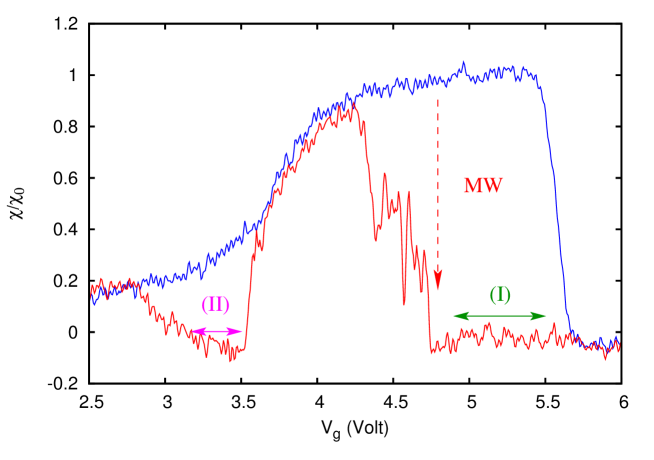
Compressibility under irradiation: We next present our compressibility measurements in the presence of microwave irradiation, focusing on the ZRS fraction , with and a magnetic field of . Outside ZRS regions the compressibility is not changed by microwave irradiation since it is independent of the conductivity of the system provided it remains finite. The holding field, identical in the central and guard regions (), was chosen to tune the photon energy in resonance with the intersubband transition.
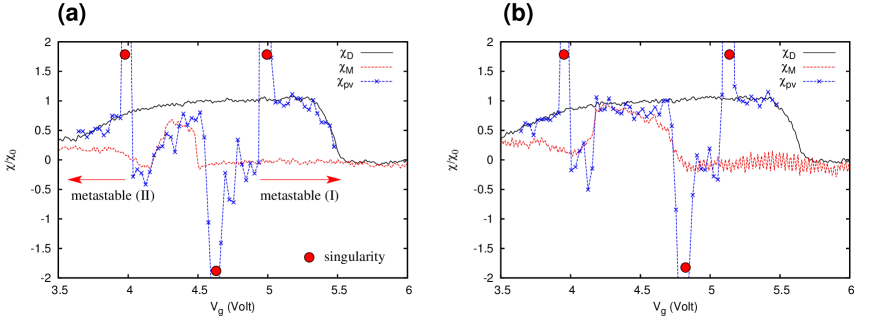
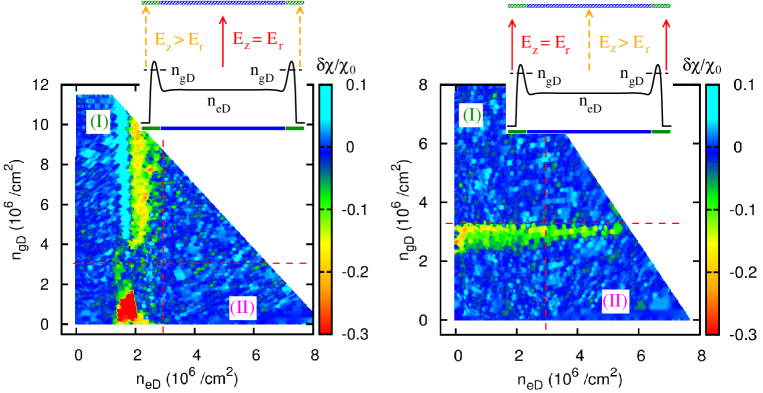
The compressibilities measured in the dark and under irradiation are compared in Fig. 4. Two singular regions where and differ are present: region at high and region at low . Hereafter on we use different notations for the average densities in the dark and and under microwave irradiation and to avoid ambiguity. In region , the dark density in the guard is higher than at the center , whereas in region we have . In both regions, a strong suppression of the compressibility is observed and strikingly vanishes in most of region . In contrast, at where the electrons are distributed evenly between center and the guard, the compressibility remains almost unchanged under irradiation: .
To clarify the physical origin of the anomalous regions and , we convert the experimentally controlled variables and to physically more relevant densities and . We obtained and from the compressibility measurements in the dark (as in Fig. 3). The quantity could not be measured directly in a reliable manner owing to the unavoidable effect of the density gradients in the guard region. We thus calculated by averaging the simulated density profiles over the guard region. This procedure is justified by the excellent agreement between the compressibility measurements and our numerical simulations that we demonstrated in absence of irradiation.
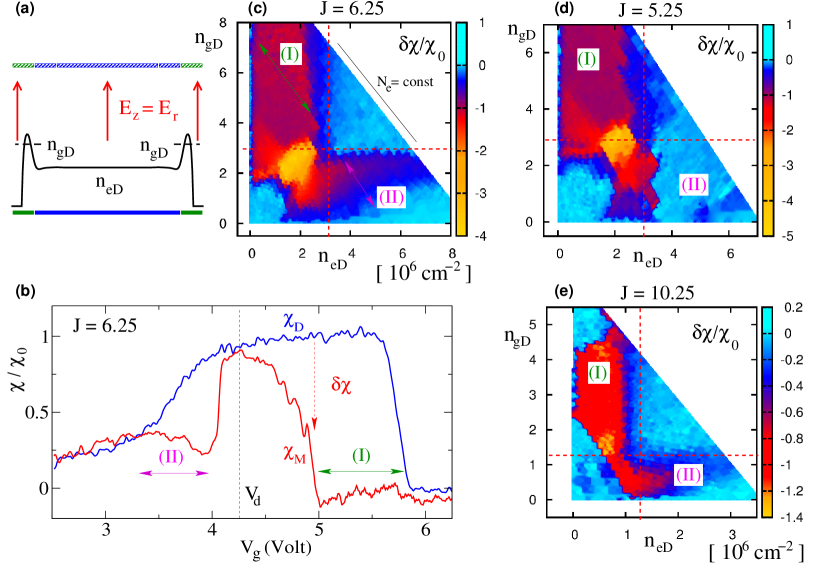
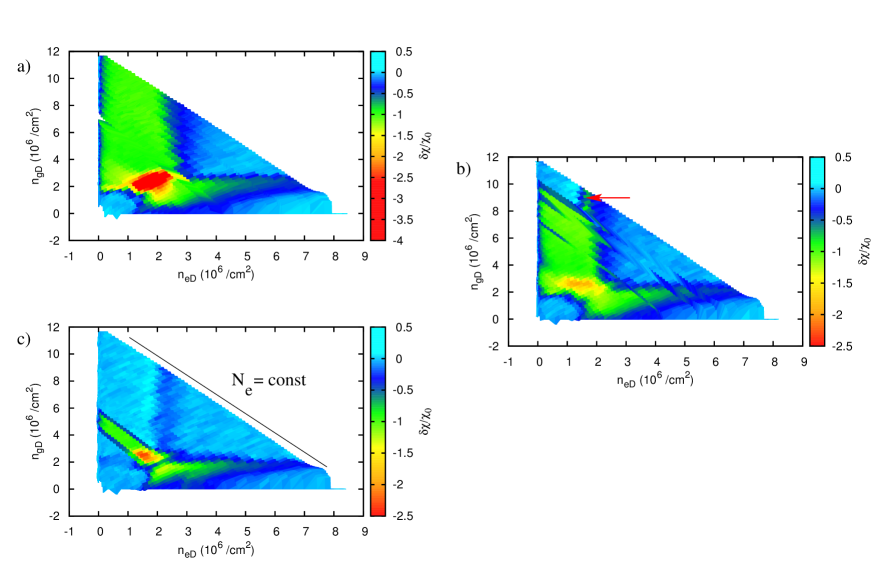
Using this method we summarize on the plane the changes in compressibility under irradiation measured at different values of and while fixing all the other parameters (magnetic field, microwave frequency and power, temperature and perpendicular electric field; the dependence on microwave power and magnetic field is shown in supplementary figures 1-5). The results are shown in the color-scale panels in Fig. 4. The anomalous regions and are upper bounded by lines of constant density in the center and in the guard where we introduced . Indeed for and the change in compressibility is negligible and the electron density is still described by the electrostatics of the gas phase. Similarly at low densities: and , we also find no deviations from the equilibrium values. The incompressible regions and occupy the space and a fraction of the space , they are characterized by on Fig. (4). Finally, in the remaining area on the plane, becomes negative under irradiation for example at . To highlight the robustness of our results, Fig. 4 also shows similar data obtained at two other ZRS fractions: and . Incompressible regions appear for these cases as well, we note that for the position of the boundary is displaced towards significantly lower densities .
The incompressible regions with vanishing correspond to an unexpected regime where the density becomes independent of the compressing confinement potential . In the integer quantum Hall effect, incompressible phases appear owing to the finite energy required to add electrons to a system in which the Landau levels available at the Fermi energy are all fully occupied. This explanation, however, is not applicable to electrons on helium since they form a non-degenerate electron gas. Experiments on the quantum Hall effect have also shown that a vanishing longitudinal conductivity , can freeze a non-equilibrium electron density distribution since the charge relaxation time-scales can become exponentially large dolgoporov ; jeannert . An explanation based on the vanishing conductivity seems natural owning to the coincidence between the onset of charge redistribution and ZRS. We can determine experimentally whether the incompressible behavior can be explained only on the basis of . Indeed a state with is expected to freeze the existing density distribution due to the very long charge relaxation rates; thus, the final state should depend in a non trivial way on the equilibrium density profile and on the kinetics of the transition to ZRS.
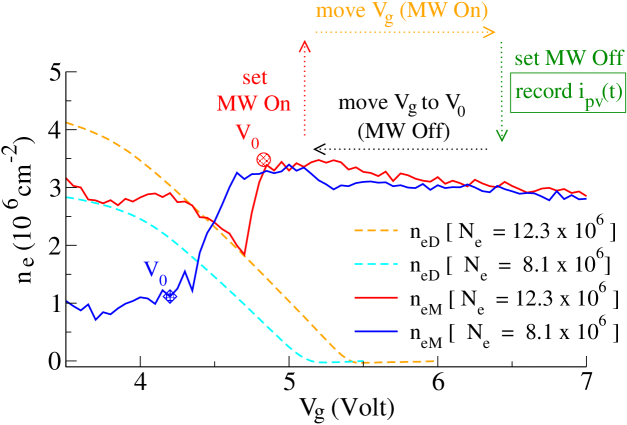
We developed the following approach to determine the central density under irradiation for different initial densities . We performed compressibility measurements without irradiation as described in Fig. 3 to obtain as function of at a fixed . Then, fixing , we irradiated the electron system with on/off pulses of millimeter waves creating a periodic displacement of the electron density . This displacement induces a transient current of image charges on the measuring electrode , which within a plane-capacitor approximation is related to the change in the electron density through the relation:
| (3) |
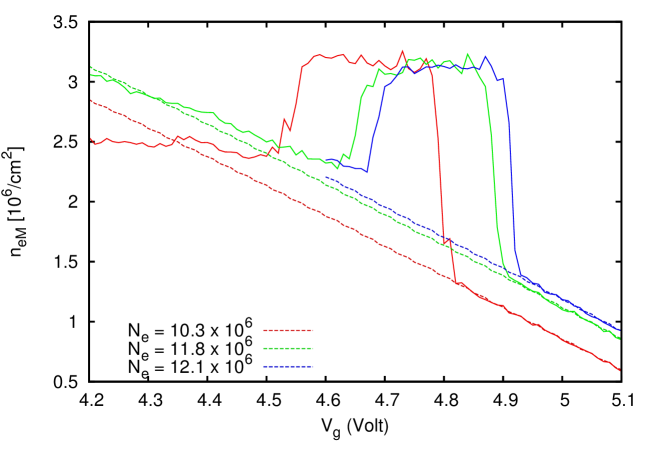
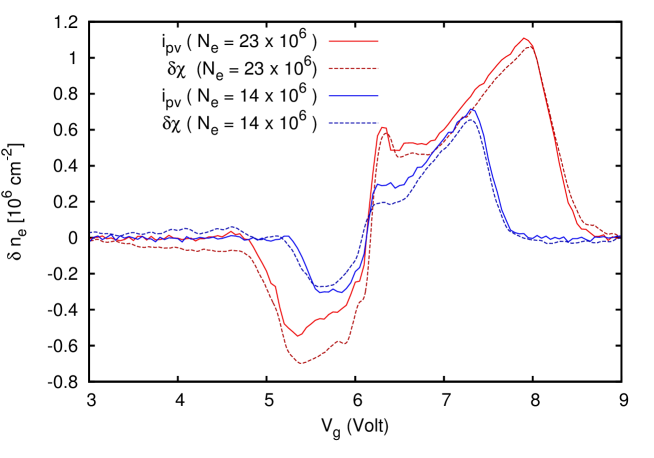
The integral in this equation is evaluated over the time interval where the irradiation is switched off (a derivation of this relation is provided in supplementary note 4) . Combining with the known values for , we reconstructed the dependence of on the guard potential : the results are shown on Fig. 5 for several values.
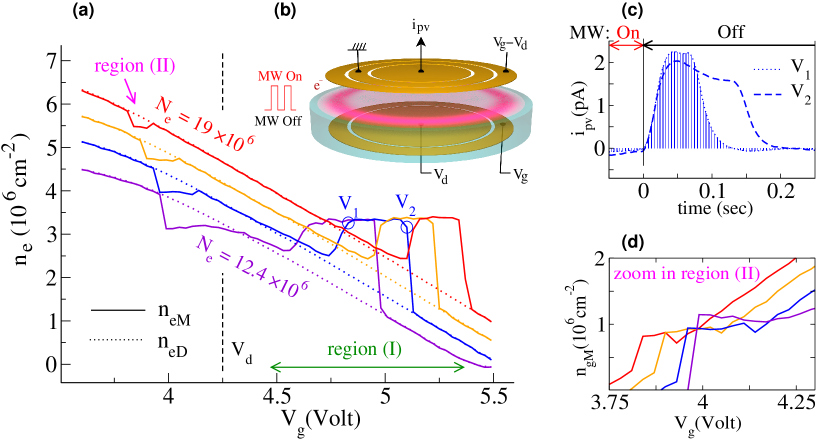
Deviations from mainly appear in two voltage regions which are in good correspondence with the regions and outlined in Fig. 4. In region the density under irradiation exhibits a striking plateau as a function of with a plateau density independent of . We emphasize that this plateau appears because of the cancellation between the decrease of at higher and the increase of the area below curves (see Fig. 5.c and Eq. 3), it is thus a highly non-trivial experimental result. These observations confirm the existence of an incompressible phase for electrons on helium and appear to exclude an explanation based only on since the final state density does not depend on the density distribution in equilibrium for a wide range of parameters. Instead, our experiments imply the existence of a dynamical mechanism that stabilize the electron density to a fixed value.
We next comment on the sign of . In region the electrons migrate from the guard, where the densities are higher, to the center of the electron cloud, whereas in region the trend is opposite and electrons flow from the center towards the edges of the electron cloud. In the latter region narrow density plateaux are also observed however the plateau density value depends on in contrast to region . An approximate calculation of shown on Fig. 5 suggests that in region the transition to an incompressible state occurs owning to the pinning of the density inside the guard region. Thus in the incompressible phase, the electron cloud transfers electrons from a high density reservoir region, increasing the density in the low-density regions up to a plateau value.
Discussion
Since the formation of a non-equilibrium density profile increases the electron-electron repulsion energy, it is important to estimate the associated energy cost. Using the simplified electrostatic model (see supplementary note 5 for a detailed derivation), we find that the energy cost of the redistribution per electron is approximately:
| (4) |
From the experimental values of and (estimated at point on Fig. 5), we find . The presence of this large electrostatic barrier, can explain why the incompressible regions occupy a narrower range in the photocurrent data than in the compressibility measurement: for example region has a width at least 0.6 Volt in Fig. 4 but a width of only 0.3 Volt in Fig. 5. The main difference between the two techniques is that during compressibility measurements microwaves are always present, maintaining the system in a non-equilibrium state, whereas in the photocurrent measurement the microwave on/off pulses continuously reset the system back to its equilibrium state. Thus in the photocurrent measurements, the electrons must overcome an increasingly large energy barrier to reach the incompressible state as increases. When the barrier becomes too large, the systems remains in its equilibrium state and the photocurrent vanishes abruptly. In contrast, in the compressibility measurement, the electron system remains in the incompressible state as changes and the electrostatic barrier does not need to be overcome directly, allowing the incompressible state to exist over a wider parameter range. (In the supplementary figures 6-9, we provide a detailed comparison between the two measurement techniques and show that they are fully consistent once the described hysteretic behaviour is taken into account).
The estimated charging energy must be provided by the microwave irradiation since it is the only energy source in our system, its amplitude corresponds to a surprisingly large number of photons absorbed per electron , particularly in comparison with a two level system that cannot absorb more than one photon. The energy of the absorbed photons thus needs to be transferred efficiently to other degrees of freedom. It could be transferred by the excitation of higher Landau levels. However, the theoretical calculations performed by Y. Monarkha to explain the origin of microwave induced resistance oscillations for electrons on helium, suggest that Landau levels higher than the photon energy are unlikely to be strongly populated Monarkha2011 ; Monarkha2012 . These calculations give an accurate prediction for the phase of the resistance oscillations allowing us to exclude strong inter-Landau level excitation Denis3 .
The energy can also be accumulated by transitions within the same manifold of quasi-degenerate Landau levels as they are bent by the confinement potential. A possible mechanism for this absorption is provided by the negative conductivity models introduced theoretically to explain ZRS in heterostructures review . It has been predicted that a negative resistance state will stabilize through the formation of domains with a fixed built-in electric field . We performed simulations of the electron density profiles for an electric field dependent conductivity model with which is believed to describe domain formation. Our simulations show that this model tends to fix the electron density gradients in order to generate the built in field . This changes the compressibility of the electron cloud depending on the number of stable domains in the system but without inducing an incompressible state. Thus, new theoretical developments are required to make the domain picture consistent with our experiments.
A recent theoretical proposal suggests that another instability can occur even before the conductivity becomes negative Entin2013 ; Entin2014 . Due to fluctuations of the microwave electromagnetic field on the wavelength scale ratchet internal currents are expected to appear under irradiation inside the electron system. The velocity of the induced electron flow will scale as where is the amplitude of the microwave electric field and a non-linear response coefficient Entin2014 . Under steady state conditions this internal flow must be compensated by a counter-flow created by internal electric fields with maximal value . The balance between the two flows sets a lower bound on the longitudinal mobility that is stable under irradiation: . Mobilities below this threshold are expected to lead to the formation of electron pockets on a scale with a certain similarly to the stripe/puddles instability occurring in quantum Hall systems Shkovskii .
The above argument predicts the existence of an instability without explaining the pinning of the electron density. A mechanism selecting a particular density value is thus desirable. As a possible mechanism we propose the following scenario. If we assume that a significant fraction of the energy carried by the absorbed photons is transferred into ripplons with a typical wave number given by the inverse magnetic length Lea , then the helium surface will vibrate at frequency where and are the helium surface tension and density respectively monarkha_book . Provided frequencies are matched, this vibration can interact resonantly with electronic modes. The frequency of the expected surface vibrations is approximately (for ) and has the same order of magnitude as the low wavelength magneto-shear modes Golden which have frequency . Equating these frequencies we find an equation on the plateau density:
| (5) |
For this formula gives the right order of magnitude for the plateau density , and the predicted dependence on is consistent with our observations at different shown on Fig. 4. Even if the described mechanism requires further theoretical studies, it correctly captures the critical dependence on the electronic density observed in the experiments. For electrons on helium the electronic density mainly controls the strength of electron-electron interactions and the key role played by this parameter indicates that the formation of incompressible states is a collective effect involving many electrons.
In conclusion, we have shown that electrons trapped on a helium surface exhibit incompressible behavior under resonant irradiation conditions corresponding to the formation of a microwave induced zero-resistances state. Their density becomes pinned to a fixed value independent of the applied electrostatic force and on the initial electron distribution profile for a wide range of parameters. The transition to the incompressible state is achieved by overcoming an impressively high electrostatic energy barrier of up to per electron. We described the possible energy conversion processes within the electron system that can transform the energy of the absorbed photons into charging energy, and we proposed several competing mechanisms that can render the equilibrium density profile unstable. Since the incompressible behavior emerging from our experiments is very elegant, we believe that its understanding will stimulate the emergence of new concepts for self-organization in quantum systems.
Acknowledgements: We are thankful to H. Bouchiat for fruitful discussions and acknowledge support from JSPS KAKENHI Grant Number 24000007. One of us, A.C. acknowledges support from the E. Oppenheimer fellowship and from St. Catharine college in Cambridge. D.K. is supported by internal grant from Okinawa Institute of Science and Technology Graduate University.
Author contributions: All authors contributed to all aspects of this work.
Methods : Our experiments were performed in a Leiden dilution refrigerator with base temperature around , the magnetic field was provided by a home made superconducting magnet with maximal field of . The experimental cell was filled with liquid helium until half filling by monitoring the cell capacitance during helium condensation. Electrons were deposited on the helium surface by thermionic-emission from a heated tungsten filament. Control of the total electron number in the cloud was achieved by trapping an initially high concentration of electrons and then lowering the confinement voltages allowing excess electrons to escape. The obtained value was determined from compressibility measurements in equilibrium. The frequency of the intersubband transition was tuned in resonance with the photon energy using the linear Starck shift induced by the electric field perpendicular to the helium surface which was fixed during our compressibility and photo-current experiments in order to keep the system at intersubband resonance. The current probe electrodes were grounded through Stanford Research (SR570) current amplifiers while the potential of the other electrodes was set by Yokogawa DC voltage supplies, this ensure a stable DC voltage on all cell electrodes independently of the irradiation. Numerical simulations were performed by solving the Laplace equations for our cell geometry using a finite elements method Hecht .
References
- (1) K. v. Klitzing, G. Dorda, and M. Pepper New Method for High-Accuracy Determination of the Fine-Structure Constant Based on Quantized Hall Resistance, Phys. Rev. Lett. 45, 494-497 (1980)
- (2) D.C. Tsui, H.L. Stormer and A.C. Gossard Two-dimensional magnetotransport in the extreme quantum limit. Phys. Rev. Lett. 48, 1559–1562 (1982).
- (3) J. Jain Composite Fermions (Cambridge Univ. Press, 2007).
- (4) K. S. Novoselov, A. K. Geim, S. V. Morozov, D. Jiang, M. I. Katsnelson, I. V. Grigorieva, S. V. Dubonos and A. A. Firsov, Two-dimensional gas of massless Dirac fermions in graphene, Nature 438, 197-200 (2005)
- (5) Y. Zhang, Yan-Wen Tan, Horst L. Stormer and Philip Kim Experimental observation of the quantum Hall effect and Berry’s phase in graphene, Nature 438, 201-204 (2005)
- (6) K.I. Bolotin, F. Ghahari, M.D. Shulman, H.L. Stormer and P. Kim Observation of the fractional quantum Hall effect in graphene, Nature 462, 196-199 (2009)
- (7) Zyun Francis Ezawa, Quantum Hall effect: field theoretical approach and related topics, World scientific (2008), Singapore. ISBN: 9812700323
- (8) R.G. Mani, J.H. Smet, K. von Klitzing, V. Narayanamurti, W.B. Johnson, and V. Umansky, Zero-resistance states induced by electromagnetic-wave excitation in GaAs/AlGaAs heterostructures, Nature 420, 646-650 (2002).
- (9) M.A. Zudov, R.R. Du, L.N. Pfeiffer, and K.W. West, Evidence for a New Dissipationless Effect in 2D Electronic Transport Phys. Rev. Lett. 90, 046807 (2003).
- (10) A. C. Durst, S. Sachdev, N. Read, and S. M. Girvin, Phys. Rev. Lett. 91, 086803 (2003).
- (11) I. A. Dmitriev, A. D. Mirlin, and D. G. Polyakov, Phys. Rev. Lett. 91, 226802 (2003).
- (12) I. A. Dmitriev, A. D. Mirlin, D. G. Polyakov, and M. A. Zudov, Nonequilibrium phenomena in high Landau levels, Rev. Mod. Phys. 84, 1709-1763 (2012).
- (13) A. D. Chepelianskii and D. L. Shepelyansky, Microwave stabilization of edge transport and zero-resistance states Phys. Rev. B 80, 241308(R) (2009)
- (14) A. D. Levin, Z. S. Momtaz, G. M. Gusev, and A. K. Bakarov, Phys. Rev. B 89, 161304(R) (2014)
- (15) S.A. Mikhailov, Theory of microwave-induced zero-resistance states in two-dimensional electron systems, Phys. Rev. B 83, 155303 (2011)
- (16) O. V. Zhirov, A. D. Chepelianskii, and D. L. Shepelyansky, Towards a synchronization theory of microwave-induced zero-resistance states Phys. Rev. B 88, 035410 (2013)
- (17) A. D. Chepelianskii, A. S. Pikovsky and D. L. Shepelyansky, Synchronization, zero-resistance states and rotating Wigner crystal, Euro. Phys. Jour. B 60, 225-229 (2007)
- (18) R.L. Willett, L.N. Pfeiffer, and K.W. West, Evidence for Current-Flow Anomalies in the Irradiated 2D Electron System at Small Magnetic Fields Phys. Rev. Lett. 93, 026804 (2004).
- (19) J. H. Smet, B. Gorshunov, C. Jiang, L. Pfeiffer, K. West, V. Umansky, M. Dressel, R. Meisels, F. Kuchar, and K. von Klitzing, Circular-Polarization-Dependent Study of the Microwave Photoconductivity in a Two-Dimensional Electron System Phys. Rev. Lett. 95, 116804 (2005).
- (20) M.A. Zudov, R.R. Du, L.N. Pfeiffer, and K.W. West, Bichromatic Microwave Photoresistance of a Two-Dimensional Electron System Phys. Rev. Lett. 96, 236804 (2006).
- (21) R. G. Mani, W. B. Johnson, V. Umansky, V. Narayanamurti, and K. Ploog, Phase study of oscillatory resistances in microwave-irradiated- and dark-GaAs/AlGaAs devices: Indications of an unfamiliar class of the integral quantum Hall effect, Phys. Rev. B 79, 205320 (2009)
- (22) S. Wiedmann, G.M. Gusev, O.E. Raichev, A.K. Bakarov, and J.C. Portal, Microwave Zero-Resistance States in a Bilayer Electron System Phys. Rev. Lett. 105, 026804 (2010).
- (23) S.I. Dorozhkin, L. Pfeiffer, K. West, K. von Klitzing, and J.H. Smet, Random telegraph photosignals in a microwave-exposed two-dimensional electron system, Nature Phys. 7, 336 (2011).
- (24) R. G. Mani, A. N. Ramanayaka, and W. Wegscheider, Observation of linear-polarization-sensitivity in the microwave-radiation-induced magnetoresistance oscillations, Phys. Rev. B 84, 085308 (2011)
- (25) Denis Konstantinov and Kimitoshi Kono, Photon-Induced Vanishing of Magnetoconductance in 2D Electrons on Liquid Helium, Phys. Rev. Lett. 105, 226801 (2010)
- (26) Denis Konstantinov and Kimitoshi Kono, Novel Radiation-Induced Magnetoresistance Oscillations in a Nondegenerate Two-Dimensional Electron System on Liquid Helium, Phys. Rev. Lett. 103, 266808 (2009)
- (27) Electrons on Helium and Other Cryogenic Substrates, edited by E.Y. Andrei (Kluwer Academic, Dordrecht, 1997).
- (28) Y. Monarkha and K. Kono: Two-Dimensional Coulomb Liquids and Solids (Springer, Berlin, 2004).
- (29) Denis Konstantinov, Alexei D. Chepelianskii and Kimitoshi Kono, Resonant Photovoltaic Effect in Surface State Electrons on Liquid Helium, J. Phys. Soc. Jpn. 81 093601 (2012)
- (30) R.M. Platzman and M.I. Dykman, Quantum Computing with Electrons Floating on Liquid Helium Science 284, 1967-1969 (1999)
- (31) L. Wilen and R. Giannetta, Impedance methods for surface state electrons, Jour. Low Temp. Phys. 72, 353-369 (1988)
- (32) Y.Z. Kovdrya, V.A. Nikolayenko, O.I. Kirichek, S.S. Sokolov and V.N. Grigor’ev, Quantum transport of surface electrons over liquid helium in magnetic field, Jour. Low Temp. Phys. 91, 371-389 (1993)
- (33) F. Closa, E. Raphaël and A.D. Chepelianskii, Transport properties of overheated electrons trapped on the a helium surface, Eur. Phys. J. B 87:190, 1-9 (2014)
- (34) A. O. Badrutdinov, L. V. Abdurakhimov, and D. Konstantinov Cyclotron resonant photoresponse of a multisubband two-dimensional electron system on liquid helium, Phys. Rev. B. 90, 075305 (2014)
- (35) S. H. Tessmer, P. I. Glicofridis, R. C. Ashoori, L. S. Levitov and M. R. Melloch, Subsurface charge accumulation imaging of a quantum Hall liquid, Nature 392, 51-54 (1997)
- (36) V. T. Dolgopolov, A. A. Shashkin, N. B. Zhitenev, S. I. Dorozhkin, and K. von Klitzing, Quantum Hall effect in the absence of edge currents, Phys.Rev B 46, 12560-12567 (1992)
- (37) B. Jeanneret, B. D. Hall, H.-J. Bühlmann, R. Houdré, M. Ilegems, B. Jeckelmann, and U. Feller, Observation of the integer quantum Hall effect by magnetic coupling to a Corbino ring, Phys. Rev. B 51, 9752-9756 (1995)
- (38) Y. P. Monarkha, Microwave-resonance-induced magnetooscillations and vanishing resistance states in multisubband two-dimensional electron systems , Low Temp. Phys. 37, 655-666 (2011)
- (39) Y. P. Monarkha, Coulombic effects on magnetoconductivity oscillations induced by microwave excitation in multisubband two-dimensional electron systems, Low Temp. Phys. 38, 451-458 (2012)
- (40) Denis Konstantinov, Yuriy Monarkha and Kimitoshi Kono, Effect of Coulomb Interaction on Microwave-Induced Magnetoconductivity Oscillations of Surface Electrons on Liquid Helium , Phys. Rev. Lett. 111, 266802 (2013)
- (41) M. V. Entin and L. I. Magarill, Photogalvanic current in a double quantum well, JETP Letters 98, 38 (2013),
- (42) M. V. Entin and L. I. Magarill, Photogalvanic current in electron gas over a liquid helium surface, JETP Letters 98, 816-822 (2014),
- (43) A. A. Koulakov, M. M. Fogler, and B. I. Shklovskii, Charge Density Wave in Two-Dimensional Electron Liquid in Weak Magnetic Field, Phys. Rev. Lett. 76, 499-502 (1996)
- (44) M. J. Lea, P. Fozooni, A. Kristensen, P. J. Richardson, K. Djerfi, M. I. Dykman, C. Fang-Yen, and A. Blackburn, Magnetoconductivity of two-dimensional electrons on liquid helium:Experiments in the fluid phase , Phys. Rev. B 55, 16280-16292 (1997)
- (45) Kenneth I. Golden, G. Kalman and Philippe Wyns, Dielectric tensor and collective modes in a two-dimensional electron liquid in magnetic field, Phys. Rev. B 48 8882-8889 (1993)
- (46) F. Hecht, New development in FreeFem++. J. Numer. Math. 20, no. 3-4, 251–265. 65Y15 (2012)
A novel incompressible state of a photo-excited electron gas : supplementary materials
Supplementary note 1. On the definition of compressibility.
Our definition of compressibility deviates from the definition of compressibility in the quantum-Hall effect community since the derivative of the density is taken against a gate voltage and not the chemical potential (position of the Fermi level). Such a definition is not suitable in our case since electrons on helium form a non-degenerate electron gas and the Fermi-energy is much smaller than temperature and is therefore not a relevant parameter, instead we have used the electrostatic potential which is controlled by . We note that our experimental technique is otherwise very similar to the capacitive measurements performed on GaAs two-dimensional electron gas to determine the compressibility. For example, except for the dimension of the probe electrode, our measurement geometry is very similar to that in [S.H. Tessmer, P.I. Glicofridis, et. al. … Nature 392, 51 (1998)] even in terms of the non-local excitation scheme used in their experiment. We would also like to emphasize that as decreases the electron gas is progressively compressed towards the center of the electron cloud, which is the expected behavior in a compressibility experiment. Thus we believe that the use of the term compressibility is fully justified.
Finally our definition of compressibility may seem non-local since it involves the derivative against the potential of the guard electrode instead of the potential of the potential of the central electrode . Actually only the difference is important for the electron distribution profile, thus the two definitions are in principle equivalent. Our motivation for choosing as the main control parameter is that we wanted to keep the perpendicular field constant during our measurements, and it is much easier to fix the potential of the top guard electrode ensuring that is constant, than to change the potential of the top central electrodes, which are grounded through the current amplifiers.
Supplementary Note 2. Derivation of Eq. (1) in the main text. We will use to denote the RMS-oscillation amplitude of the electronic density below the central electrode of diameter induced by AC voltage with amplitude applied to the bottom and top guard electrodes. The oscillation amplitude of the charge on the top central electrode then can be expressed as:
| (6) |
This equation assumes that electrons are distributed midway between top and bottom electrodes separated by distance . We ensured that this was indeed the case by adjusting the liquid helium level to during the filling of the sample cell using capacitance measurements. Under these conditions it is strictly valid for an homogeneous charge distribution below the disc for which the density gradients are located at least a screening length away from the electrode edges. This is the case without microwave irradiation since the density gradients are located at .
We next consider the effect of a spontaneous density modulation at a wavenumber superimposed on the average change in the carrier density on the validity of Eq. (6). The influence of wavenumbers for which will be exponentially suppressed by the screening from the electrodes. The effect of wavenumbers satisfying will also be reduced by the averaging over the surface of the measuring electrode. At longer wavelengths the charge density is almost uniform and the error is also expected to be weak. Thus we expect this relation to stay valid for a large range of wave-numbers . A possible source of charge density oscillation is the fluctuation of the microwave field on the microwave-wavelength scale . For this case we have and we thus expect the effect of the charge modulations to be strongly suppressed as compared to the changes in the average charge density.
The change in the charge accumulated on the electrodes is related to the current measured with the current amplifier as follows:
| (7) |
where is the modulation frequency. This relation assumes a quasi-static limit where the charges follow the external driving. In a lumped-element approximation this is valid provided the modulation frequency is sufficiently low: . Here is the inverse of the longitudinal conductivity of the electron cloud and is the coupling capacitance. From our measurements using the Sommer-Tanner technique without microwaves we know that under our experimental conditions, with typical electron density and magnetic field , at a frequency . We performed our compressibility measurements at , thus the inverse conductivity of the electron cloud can only affect our measurements when is suppressed by around two orders of magnitude compared with its equilibrium value. As discussed in the main text, the compressibility measurement cannot distinguish between a vanishing conductivity state with in which carriers do not respond to the external driving owing to their very long response times and an ”active” mechanism stabilizing the density at a fixed value independent on the applied electrostatic potentials. We note that the photocurrent experiment (Fig. 5 from the main text) allows us to distinguish between these two scenarios by showing that the cloud reaches the same steady state density under irradiation independently on the initial density giving a strong argument in favor of an ”active” mechanism.
Combining equations Eqs. (6) and (7) we find the compressibility as:
| (8) |
An implicit assumption here is that is a continuous well-behaved function. If has a discontinuity we would theoretically expect a narrow peak smoothed by the lock-in integration-time and instrumental resolution. In the case where an hysteresis loop is present around the discontinuity, the system will stay trapped on the same branch after crossing the discontinuity and the density jump will no longer be correlated with the small voltage modulation . In this case the discontinuity may completely disappear from the compressibility traces. In all cases, we do not expect discontinuities to appear as sharp features in the compressibility measurement.
Supplementary note 3. Derivation of Eq. (2) in the main text.
We denote the potential of the electron cloud and assumes that the electron cloud extends to both reservoirs, in the plane condensator approximation the charge densities in the central and guard region are:
| (9) | ||||
| (10) |
In these equations we neglected the contribution of the dielectric constant of liquid helium which is close to one within a few percent error.
Subtracting these two equations and keeping only the AC terms we find :
| (11) |
Here we remind readers that the AC potential is applied to both the top and bottom guard electrodes.
Charge conservation in the cloud leads to:
| (12) |
where and are the surface areas of the central and guard electrodes respectively. We thus obtain the compressibility defined in the text as:
| (13) |
For reference, note that we can deduce the potential of the electron cloud with a given total number of electrons by inserting Eqs. (9),(10) into:
| (14) |
this leads to:
| (15) |
Another way of deriving these equations is by minimization of the charging energy, this derivation also allows us to treat naturally the case where one of the reservoirs is fully depleted under the action of the gate potentials.
Supplementary note 4. Derivation of Eq. (3) in the main text.
This equation connects the change in the electron density under irradiation and the photo-current :
| (16) |
where integration is performed over the time interval in which the irradiation is switched off. This equation is derived by combining Eq. (6) with where the ratio is taken in the sense of a time derivative.
The assumptions behind this equation are in practice slightly different from the assumptions behind Eq. (8), indeed since integration is performed over the off phase of the microwave cycle the dynamics of the electrons is known from the dark state properties and the only unknown is the state under microwave irradiation from which relaxation back to equilibrium starts. We thus expect this relation to be less sensitive to short wave-length fluctuations since they will quickly relax back to a homogeneous density without irradiation. Since the two relations correspond to slightly different assumptions on the unknown steady state under irradiation, it is important to ensure that they produce consistent results (this is shown in Figs. 11,13,14)
Supplementary note 5. Derivation of Eq. (4) in the main text.
We assume a more general configuration with fixed and . The electrostatic potentials in the center and in the guard are then different but their values are still given by relations similar to Eqs. (9,10):
| (17) | |||
| (18) |
The electrostatic energy of the system in a plane capacitance approximation is then:
| (19) |
The densities and are related by charge conservation , the electrostatic energy can thus be viewed as a function of alone . Moreover an inspection of Eqs.(17,18,19) shows that is a second order polynomial in , for our purposes we will need only the highest order term:
| (20) | ||||
| (21) |
where we remind that . Since the electrostatic energy is minimal for the dark electron density, we obtain finally :
| (22) |
where the constant is independent on .
Dividing by the total electron number, and using the notation we obtain the expression for the energy cost of the redistribution per electron which was given without derivation in the main article:
| (23) |
Supplementary figure 6: Dependence on microwave power
As demonstrated in Supplementary Figure 6 the microwave power changes the surface of the incompressible regions on the plane without changing their horizontal/vertical boundaries. The observation that the and density boundaries are independent on the microwave power supports our idea of a resonance that occurs around certain electron densities independently of the microwave power. At lowest microwave power the narrow incompressible region clearly follows lines of constant . This can be understood from the hysteretic behavior which we described in the main manuscript. At lowest microwave powers, the incompressible state can only form within a narrow range of values. Once the incompressible state is formed, it can exist as a meta-stable state over a wide range of guard voltages; which when converted into the corresponding dark density parameters and give a narrow incompressible stripe tilted along the slope .
Supplementary Figure 7. Magnetic field dependence around ( integer).
We did not observe any strong dependence on the parameter as long as its value was near a minimum of the MIRO oscillations (integer plus 1/4 offset), the corresponding data is shown in supplementary figure 7. When the deviation of became too large the incompressible states disappeared abruptly and the equilibrium dependence was recovered. This shows that the integer part of is the important parameter for the study of the magnetic field dependence of the incompressible states.
Supplementary Figure 8: Compressibility at
Supplementary Figure 9: Compressibility at
Supplementary Figure 10: Density from the photocurrent technique at
Supplementary Figures 11 and 12. Consistency between compressibility and photo-current measurements at cyclotron resonance.
The compressibility under microwave irradiation and the photo-current measurements provide two independent ways of probing the density of the system under microwave irradiation and it is important to verify their consistency. We expect the following relation to hold between the two measurements:
| (24) | ||||
| (25) |
Here Eq. (24) reproduces Eq. (3) from the main text and Eq. (25), which follows from the integration of that is the difference between the compressibility under irradiation and in the dark.
To demonstrate that these two independent measurements indeed lead to the same values of we performed experiments under cyclotron resonance conditions. As shown recently cyclotron irradiation can significantly heat the electron system inducing considerable changes in the electron density [ A. O. Badrutdinov, L. V. Abdurakhimov, and D. Konstantinov Cyclotron resonant photoresponse of a multisubband two-dimensional electron system on liquid helium, Phys. Rev. B. 90, 075305 (2014) ]. This provides us with a model case to confirm the consistency between Eqs. (24) and (25) in a regime where the mechanism driving the electron redistribution appears to be better understood. The results of our experiment are presented in Fig. 11 and show a good agreement between the two techniques. Fig. 12 shows the evolution of the density under irradiation as a function of . Although the change in the electron density is comparable, but smaller than the changes reported in the main text. Moreover, the density plateaux do not form under cyclotron resonance conditions.
Supplementary Figures 13 and 14. Consistency between compressibility and photo-current measurements in incompressible phases.
In supplementary Figs. 11 and 12, using the example of cyclotron resonance, we showed that in general the compressibility and photo-current measurements should indeed be consistent. We also verified this for the case of intersubband resonance in regimes where only a small change in the compressibility was observed without leading to the formation of incompressible phases. However, when incompressible states form, the two techniques do not coincide perfectly. For example the voltage span of the incompressible regions is much larger in the compressibility data than in the photocurrent data. Indeed, as seen from Figs. 4 and 5 in the main text region occupies the voltage range according to the compressibility data, but the width of the range is only according to the photocurrent data for the same number of electrons.
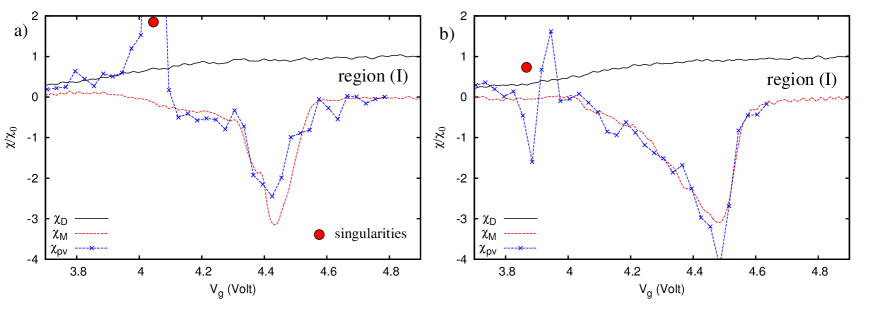
To clarify the origin of this discrepancy we computed the compressibility by numerically differentiating the electron density under irradiation as obtained from the photocurrent measurement; we denote as the corresponding value. In Fig. 13 we compare with the compressibilities and measured with the lock-in technique in the dark and under irradiation. In this comparison we used the data shown in the main text at at and . Except at the singular points that appear due to the differentiation of the abrupt features in Fig. 5 (main text), follows the values of or switching between the two curves at the singular points located at approximately and .
This suggests, as described in the main text, that at the switching points the electrostatic energy barrier becomes too high to allow a direct transition to the incompressible state from the dark electron density, collapsing the compressibility onto the dark branch . For the incompressible behavior can extend over a wider range. Indeed once the system has formed an incompressible state a small change in does not lead to the formation of a large energy barrier. The incompressible state can thus continue to exist as a metastable state that cannot be reached directly from the dark electron density distribution. In this sense, the formation of the incompressible state is strongly hysteretic.
The compressibility measurements under irradiation also show the existence of a region with around . We confirmed that similar negative compressibility values can be obtained independently from the numerical differentiation of the photo-current. The corresponding data is shown on Fig. 14. Inside the negative-compressibility region electrons are repelled from the more positive potential effectively behaving as carriers with a positive charge. These experiments show that our two measurement techniques remain consistent even in this exotic state of the electron cloud, highlighting that the discrepancies are indeed due to the presence of singular points in dependence under irradiation. We have not focussed on this regime in the main text since it appears when incompressible region with fixed and region with fixed merge into the same range. It is thus a consequence of the interaction between the two regions and corresponds to a more complex regime in which the electron system cannot reach a stable final state by increasing the density in one of the reservoirs.
Both the compressibility and transient current measurements demonstrate the existence of two incompressible regions and corresponding to the pinning of the density in the central and guard regions respectively. It is interesting to know whether this pinning can be achieved if the microwave excitation is confined to the central and guard regions only. It is not possible to control the distribution of the microwave power inside the cavity directly, however we achieved some spatial selectivity by detuning the electrons from the intersubband resonance in the central and guard regions of the electron cloud. The results of compressibility experiments under these irradiation conditions are shown in Fig. 15.
When the intersubband resonance conditions are realized only at the center of the cloud, an anomaly appears in the compressibility when the density in the center is around . However if the intersubband resonance is confined to the guard region, the compressibility changes under irradiation only when the mean density in the guard is around regardless of the value of . These observations confirm that the incompressible regions and appear predominantly owing to the excitation of the central and guard regions. Surprisingly, they also show that creating resonant conditions in those regions alone is not sufficient to create an incompressible state since the variations of the compressibility on Fig. 15 (typical ) are much smaller than those in the case where the entire cloud was excited. Therefore, the formation of an incompressible state requires the excitation of the intersubband resonance in most of the electron cloud, confirming the existence of long-range correlations (on the scale) in this new state of the electron system.
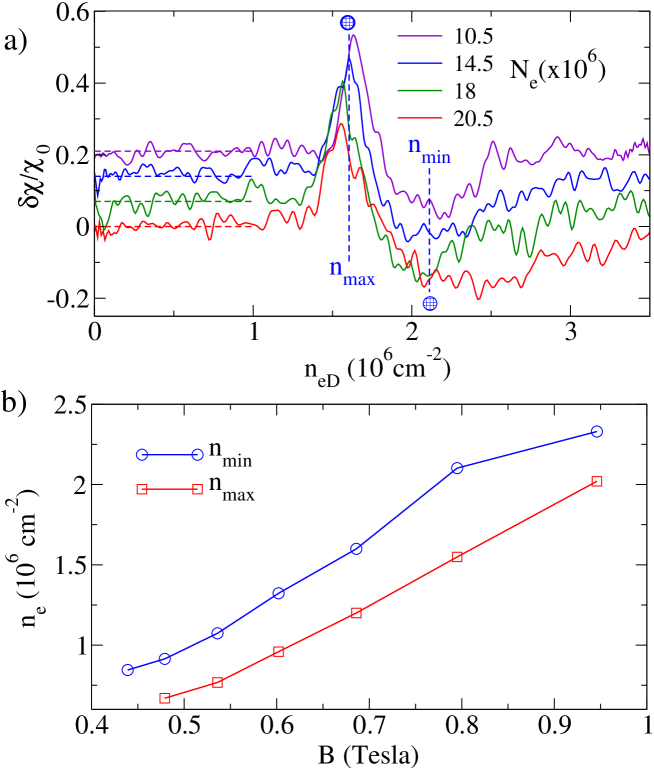
The experiments performed with detuning in the guard show a large parameter range where is only a function of the density in the center . This property is confirmed in Fig. 16.a which compares the data displayed on Fig. 15 for different . The absence of the strong hysteresis effect characteristic of the transition to the incompressible state allow to define two characteristic densities and (note that we checked that as expected when hysteresis is absent, the photocurrent and compressibility measurements coincide on the entire density and gate voltage range for this measurement) . The density corresponds to a maximum in which is rather narrow with a half width quality factor of the maximum peak of around 10. We think that these characteristic densities correspond to the position of a density-dependent resonance in the system, which is probably a precursor to the formation of the incompressible state. Fig. 15.b shows the dependence of and on the magnetic field, the observed quasi-linear dependence is consistent with the scaling proposed in the main text.
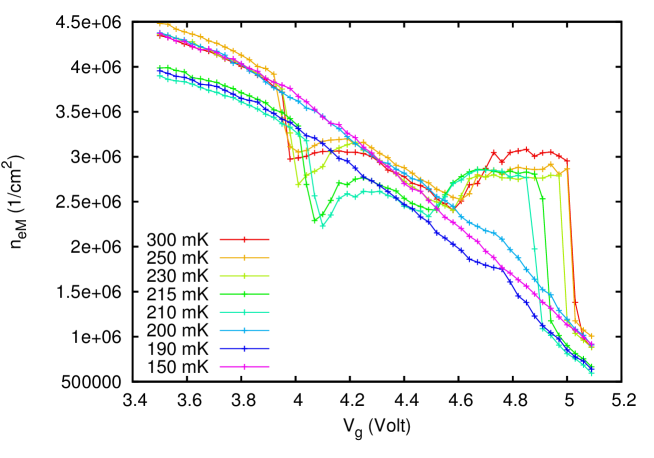
Temperature dependence
We have attempted to experimentally study the temperature dependence of the incompressible states. The results of these experiments are shown on Fig. 17. One of the problems encountered in temperature dependent experiments was that the intersubband resonance shifts at lower temperatures effectively tuning the system out of resonance and destroying the incompressible states. We think that this frequency shift may be due to segregation of helium 3 impurity atoms onto the surface of helium 4 at low temperatures but further investigations are currently needed. Thus investigations of the temperature dependence require a careful calibration of the position of the intersubband resonance, highlighting the importance of the intersubband resonance to observe the formation of incompressible states.
Extension of the photocurrent technique to the metastable incompressible branch
We have shown (see Fig. 13) that the incompressible state can be meta-stable and survive under continuous irradiation for parameters at which the electron-gas phase is stable under irradiation. In particular this occurs in region for increasing voltages. Since the compressibility also vanishes when the central region of the cloud is completely depleted, we do not know if the incompressible state extends as a metastable state beyond the depletion point or if it is destroyed close to the depletion voltage ( for Fig. 13).
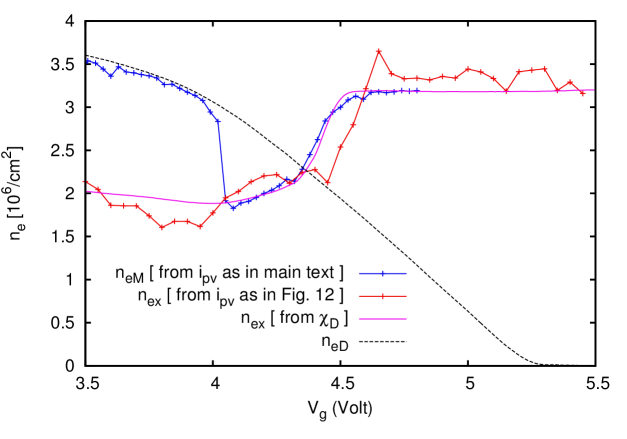
To settle this issue we have modified the photocurrent technique to track the electronic density along the metastable incompressible branch under irradiation. This modification is described in Fig. 18 and shows that the metastable branch surprisingly extends far into the depletion region where all the electrons are expected to accumulate in the guard region. This shows that electrons can stay trapped in the center under irradiation even in presence of a potential dip in the guard exceeding . As a final consistency check, we plot in Fig. 19 the density under irradiation obtained using the three different measurements: the photocurrent method (Fig. 5 from the main manuscript and Fig. 10 in supplementary materials), the modified photocurrent method described in Fig. 18 and the integration of the compressibility under irradiation using Eq. (25) and experimental data from Fig. 4 in the main manuscript). The good agreement between the three different procedures demonstrates that we have successfully reconstructed the two possible branches of the dependence: the branch corresponding to the equilibrium electron gas and the excited state branch displaying incompressible behaviour.
Conductivity measurements
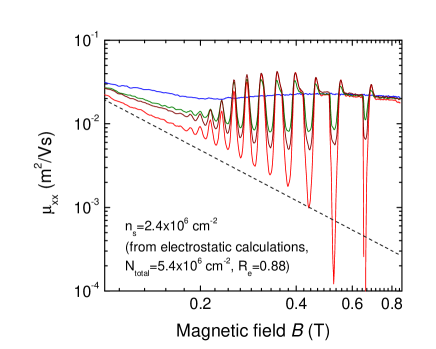
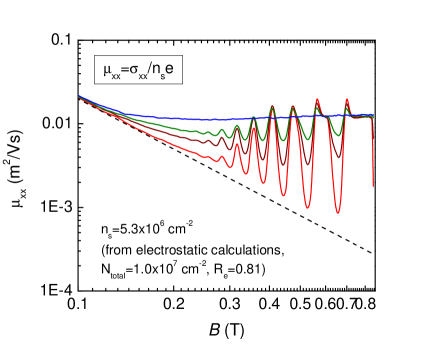
Here we show some data on mobility under irradiation for different microwave powers. The dashed lines show the behavior expected from the Drude model, without irradiation the mobilities follow the Drude dependence at low magnetic fields but saturate to a fixed mobility at high magnetic field. This behavior corresponds to the quantum transport regime where which was investigated in [ M. J. Lea, P. Fozooni, A. Kristensen, P. J. Richardson, K. Djerfi, M. I. Dykman, C. Fang-Yen, and A. Blackburn, Magnetoconductivity of two-dimensional electrons on liquid helium:Experiments in the fluid phase , Phys. Rev. B 55, 16280 (1997) ]. Microwave irradiation reduces the value of for certain values of the parameter but the mobility remains above the Drude line even in this case for most traces. At the highest microwave power shown on Fig. 20, the mobility abruptly drops to a very low value once it becomes close to , on Fig. 21 the mobility stays above this limit and the formation of ZRS is not observed.
This suggests that two independent mechanisms may combine to explain the formation of ZRS / incompressible phases: a mechanism that restores the conductivity to a value close to the Drude line at certain values of and an instability which occurs once becomes sufficiently low and that leads to the formation of ZRS and incompressible behaviour.