Time-variable non-thermal emission in the planetary nebula IRAS 151035754
Abstract
The beginning of photoionization marks the transition between the post-Asymptotic Giant Branch (post-AGB) and planetary nebula (PN) phases of stars with masses M⊙. This critical phase is difficult to observe, as it lasts only a few decades. The combination of jets and magnetic fields, the key agents of PNe shaping, could give rise to synchrotron emission, but this has never been observed before in any PNe, since free-free emission from the ionized gas is expected to dominate its radio spectrum. In this paper we report radio continuum observations taken with the Australia Telescope Compact Array between 1 and 46 GHz of the young PN IRAS 151035754. Our observations in 2010-2011 show non-thermal emission compatible with synchrotron emission from electrons accelerated at a shock with spectral index . However, in 2012, the spectral index is no longer compatible with synchrotron emission in these types of processes. Several hypothesis are discussed to explain this change. The more plausible ones are related to the presence of the newly photoionized region in this young PN: either energy loss of electrons due to Coulomb collisions with the plasma, or selective suppression of synchrotron radiation due to the Razin effect. We postulate that the observed flattening of non-thermal radio spectra could be a hallmark identifying the beginning of the PN phase.
1. Introduction
Planetary Nebulae (PNe) represent one of the final phases in the evolution of stars with masses M⊙, when they become hot enough to photoionize the circumstellar envelope ejected during the Asymptotic Giant Branch (AGB). This nebular photoionization proceeds very quickly, over only a few decades (Bobrowsky et al. 1998), making it extremely difficult to study the events produced just at the transition to the PN phase, which are crucial to determine how PNe form.
Many PNe exhibit complex axisymmetric or multipolar morphologies that are believed to be caused by collimated jets (Sahai & Trauger 1998) launched during the post-AGB (which just precedes the photoionization of the envelope) and PN phases. The exact mechanism for the launching of these jets is still unknown, but possible scenarios are the presence of magnetic fields (García-Segura et al. 2005) and/or binary systems (Soker & Rappaport 2000; Nordhaus & Blackman 2006; de Marco 2009). The combination of jets and magnetic fields lead to the presence of synchrotron radiation in several astrophysical contexts, such as active galactic nuclei (Bridle & Perley 1984), microquasars (Mirabel et al. 1992), or massive protostars (Carrasco-González et al. 2010). This emission is caused by the motion within a magnetic field of electrons accelerated to relativistic velocities at shock fronts induced by jets (Achterberg 2000).
Magnetic fields have been detected in the circumstellar envelopes of some PNe (Miranda et al. 2001; Sabin et al. 2007), but synchrotron emission has never been unambiguously reported in PNe before (see, e.g., Casassus et al. 2007, for a review of previous attempts for such a detection), even though the energy conditions in PNe are well-suited for the production of synchrotron radiation (Dgani & Soker 1998; Casassus et al. 2007). The reason is that the strong free-free radiation from ionized gas that characterize these objects is expected to overwhelm any type of non-thermal emission. Casassus et al. (2007) claimed that synchrotron emission is a possible source of centimeter-wave excess in the radio continuum flux of some PNe, over what would be expected from free-free emission alone, but the available data could not confirm this hypothesis. On the other hand, non-thermal emission has been observed in a few post-AGB sources (Cohen et al. 2006; Bains et al. 2009; Pérez-Sánchez et al. 2013), where photoionization has not yet started but jets are already present. All this indicates that the temporal window for a possible study of synchrotron radiation in PNe is extremely short, since it cannot be detected very shortly after the onset of photoionization.
The source IRAS 151035457 (hereafter I15103) is an optically obscured PN showing a high-velocity jet traced by water masers (Bendjoya et al. 2014; Gómez et al. 2015). Water maser jets are seen in a few late AGB and post-AGB stars, and are termed “water fountains” (Imai et al. 2007). I15103 is the first known case of a “water fountain” that has already entered the PN phase, suggesting that it may be one of the youngest PN known. Therefore, it is an excellent candidate to study the processes taking place during the transition into this phase. Moreover, interferometric radio continuum observations obtained in the Red MSX Survey (RMS, Lumsden et al. 2013) show a flux density lower at 3.6 cm than at 6 cm (Urquhart et al. 2007), which suggests the emission may be non-thermal. A confirmation of this trend was needed, since only two wavelengths were observed in this survey, and problems such as calibration uncertainties or extended flux missed by the interferometer may have affected these values of flux density.
In order to confirm the presence of non thermal emission in I15103, we present new radio continuum observations covering a much wider range of wavelengths in different epochs. In Section 2 we describe the observations performed. In Section 3 we explain the results derived from the observations. Section 4 is devoted to the different hypothesis we analyse to explain the variations observed in the spectral energy distribution (SED). These hypotheses are put in context and the predictions of the future evolution of the SED are presented. Section 5, finally, presents the conclusions of this work.
2. Observations and data reduction
Radio observations towards I15103 were performed using the Australia Telescope Compact Array (ATCA) in several epochs between 2010 and 2012. Table 1 summarizes the different frequencies and array configuration used. All observations used the Compact Array Broadband Backend (CABB), which provides two independent intermediate frequency (IF) outputs of 2 GHz in dual linear polarization. In the particular case of observations around 2.1 GHz, both IF were centered at the same frequency, since each IF covers the whole frequency band of the receiver (to provide redundancy in case of correlator failure), so we only processed one of them. The observations on August 2011 used the 64M mode of CABB, which samples each 2 GHz bandpass into 32 frequency channels of 64 MHz. All other observations used the 1M mode, which samples 2048 channels, each of them 1 MHz wide.
| Date | FrequencyaaCentral frequency of each band. | ArraybbATCA configuration used. |
|---|---|---|
| (GHz) | ||
| 2010-Oct-07 | 5.5, 9.0 | H214 |
| 43.0, 45.0 | H214 | |
| 2011-Aug-11 | 21.8, 24.0 | H168 |
| 2012-Oct-23 | 2.1 | H214 |
| 5.5, 9.0 | H214 | |
| 22.0, 24.0 | H214 | |
| 2012-Dec-10 | 2.1 | 6B |
| 5.5, 9.0 | 6B | |
| 26.0 | 6B |
The complex gain calibrator was PKS 1613-586 in all datasets. The absolute flux calibrator was PKS 1934-638 at all observed frequencies, except at the beginning of the observations centered at 5.5 and 9.0 GHz on December 2012, when this source was not yet above the horizon, and PKS 0823-500 was used instead for this purpose. Since PKS 1934-638 is the recommended source to set the flux density scale in ATCA data, in these particular set of data, we independently calibrated the data that used PKS 1934-638 and PKS 0823-500 as flux calibrators, and rescaled the latter data (by a factor of , depending on frequency) to achieve the same final flux density on the complex gain calibrator throughout the observations that day. This indicates that the flux density model of PKS 0823-500 used by the data reduction package was in error by %, as pointed out in the ATCA calibrator catalog. The two sets of uv-data were merged after this rescaling. The flux calibrators were also used to calibrate the bandpass at frequencies below 15 GHz. At higher frequencies, we initially used PKS 1921-293 to correct the bandpass, but checked the results against PKS 1934-638, to confirm that the resulting spectral slopes in our data were correct.
All data were calibrated and processed with the MIRIAD package using standard procedures. Calibration, initial imaging and self-calibration were performed across the entire 2 GHz bands. Final uv-data were then imaged in successive 200-MHz intervals to obtain the intra-band variation of flux density with frequency. The two exceptions for this processing mode were the data between 4345 GHz, where the signal-to-noise ratio was lower and we present the average of each 2 GHz band, and the data between 21-25 GHz taken on August 2011 where we kept the original 64 MHz spacing provided by the correlator. To double check our results, we reprocessed the data by splitting the raw uv-data into the same frequency intervals, which were then independently calibrated, self-calibrated, and imaged. The resulting dependence of flux density with frequency was the same using both methods of splitting. In all cases, broadband data were weighted with robust parameter 0.5 and frequency synthesis was applied, using MIRIAD task “invert”. Images were subsequently deconvolved with the CLEAN algorithm, as implemented in task “mfclean”.
Low-frequency observations are contaminated by extended Galactic background emission. This affects the shortest baselines. In order to obtain reliable maps we had to restrict the data to baselines k at frequencies GHz. With this restriction, the 2.1 GHz data taken in October 2012 with the compact H214 array were unusable. We also note that a visual inspection of the maps between 4.5 and 6.5 GHz obtained on October 2010, revealed significant artifacts and a higher noise (a factor of 3) than those at GHz. We think that they could be affected by low-level radio-frequency interferences (RFI), which we could not identify in uv-data for flagging, but that affects the data reliability. Furthermore, the corresponding flux density points show a relatively large scatter.
To reconstruct the SED behavior with time we have used the archival and published data summarized in Table 2. These data have been taken with ATCA by other authors in 1991 (van de Steene & Pottasch 1993), 1999 (Gaensler et al. 2000), 2002 and 2004 (Urquhart et al. 2007), as well as with the Molonglo Observatory Synthesis Telescope in 1998 for the Second Molonglo Galactic Plane Survey (1998) (Murphy et al. 2007). We used the published flux densities for the data from 1991 and 1998. We note that data from 1991 do not have enough uv coverage to obtain images, so their flux density values may have a significantly larger error than quoted. We downloaded and processed the ATCA archival data on 1999 and 2002 to obtain the values in Table 2. The fluxes on 2004 were measured on processed images provided by the authors (Urquhart et al. 2007). The data taken in January 2012 centered at 1.8 GHz for the MAGMO project (Green et al. 2012), included I15103 within their primary beam, with their phase center located away from our source. Therefore, we processed these data correcting by the response of the ATCA primary beam as implemented in the MIRIAD task “linmos”.
| Date | FrequencyaaCentral frequency of the observation | Flux density | rmsbbOne-sigma rms noise of the map | References |
|---|---|---|---|---|
| (GHz) | (Jy) | (Jy) | ||
| 1991.4 | 4.8 | 0.1145 | 0.0008 | 1 |
| 1998.4 | 0.8 | 0.193 | 0.006 | 2 |
| 1999.2 | 1.4 | 0.199 | 0.003 | 3 |
| 2.5 | 0.219 | 0.004 | 3 | |
| 2002.7 | 4.8 | 0.1509 | 0.0006 | 4 |
| 8.4 | 0.1088 | 0.0004 | 4 | |
| 2004.9 | 4.8 | 0.0989 | 0.0007 | 4 |
| 8.4 | 0.068 | 0.002 | 4 | |
| 2012.0 | 1.8 | 0.052ccMean value for the frequency intervals in which we split the whole band | 0.002ccMean value for the frequency intervals in which we split the whole band | 5 |
3. Results
In Figure 1 we present the radio continuum emission in I15103 at different frequencies and epochs, obtained with our observations and the archival data. Our radio continuum observations show a dependency of flux density as a function of frequency that is atypical for a PN. Radio continuum emission from PNe normally consists in free-free (bremsstrahlung) radiation in the ionized gas, and follows a relation with frequency , where the spectral index ranges from in the optically thick regime at low frequencies (usually 10 GHz), to for optically thin emission at high frequencies (usually 10 GHz). The turnover frequency separating these two opacity regimes is thought to depend on the age of the PN (Kwok et al. 1981).
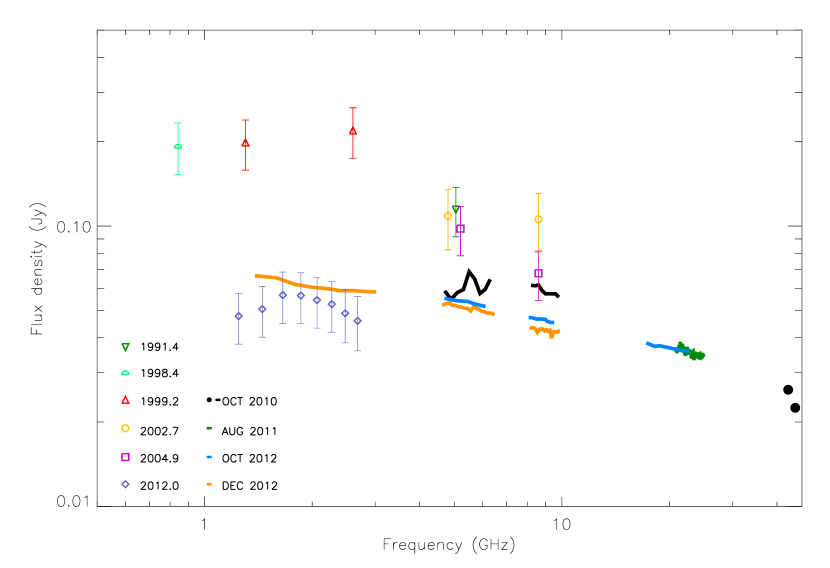
However, our data taken in the first two sets of observations (2010-2011; black and green solid lines and black filled circles) show radio continuum emission with a steep decline at high frequencies (Figure 1). We found a spectral index between 8 and 25 GHz, indicating a non-thermal origin for the emission. The data at higher frequencies (42-46 GHz) show an apparently steeper spectral index, but given that it is obtained from only two points, its significance is low (). At lower frequencies (4-5.5 GHz), the data have lower quality, with artifacts in the maps that may indicate the presence of low-level RFI, as explained above, so the possible turnover suggested by the data at these frequencies is not reliable.
Our most recent ATCA data (October-December 2012), taken about one year later, show a significantly flatter spectrum over the whole range from 1 to 24 GHz. In particular, the data taken on October 2012 (blue solid lines in Fig. 1) follow a spectral index of between 4.5 and 25 GHz. The slope is similar for data taken on December 2012 between 1 and 10 GHz (orange solid lines in Fig. 1).
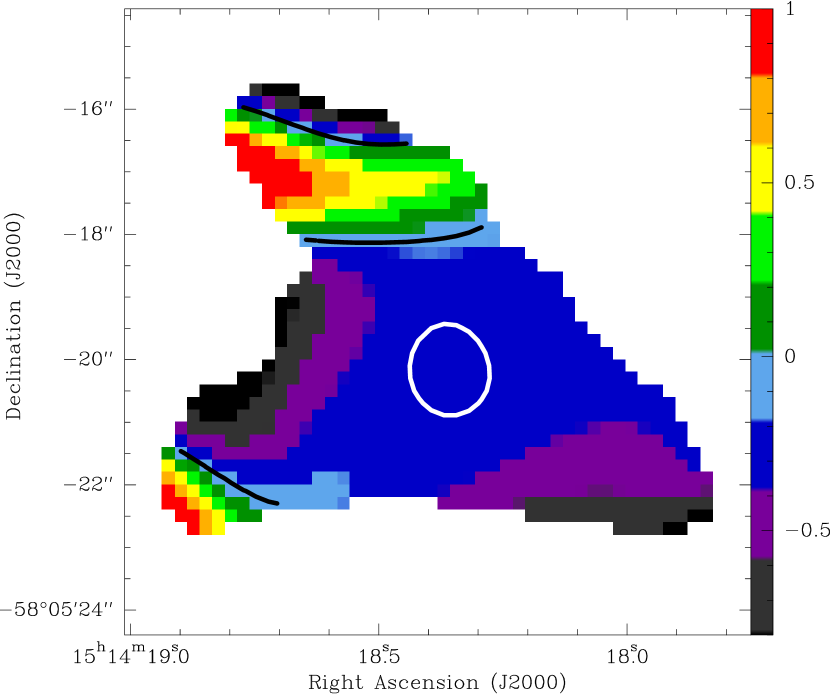
The data taken on December 2012 allow us to resolve some structure in the radio continuum emission. Figure 2 (top) shows a map of the emission integrated between 8 and 10 GHz. The emission is dominated by an unresolved intense core, but there is much weaker emission extending along three arms toward the northeast, southwest, and southeast. Note that the contour levels in this map are not linear, but proportional to powers of 2, and the highest level nearly corresponds to the half power level. Figure 2 (bottom) shows a spectral index map obtained with the emission between 8 and 10 GHz (map in Fig. 2-top), and the radio continuum emission between 4.5 and 6.5 GHz, both convolved to a common angular resolution of . As expected in view of the SED, most of the emission is non-thermal (with ), including the central bright core. However, there are some areas that are compatible with thermal emission (), specially toward the northeast (the positive spectral indices toward the southeast are at lower intensity levels and are less reliable). The intensity of this possible thermal emission is more than 50 times weaker than the non-thermal peak, and it does not significantly affect the derived spectral index from Fig. 1.

The time evolution of flux density derived from archival observations is also consistent with the emission becoming weaker with time, a variation that seems to be dramatic at low frequencies. The only exception to this historical weakening is the data from the MAGMO project, taken in 2012, and optimized for spectral line work. The MAGMO data suggest a turnover, and a slightly lower flux density than our observations at these frequencies, which were taken later. However, we consider these flux densities less reliable, given the relatively large distance of the source from the phase center of the observations, and the use of a different primary flux calibrator: PKS 0823-500 instead of PKS 1934-638 in our data. As noted above, the flux density model of PKS 0823-500 in MIRIAD might be incorrect, and so the combination of positional offset and calibrator flux density error margin reduce the significance of any differences.
Apart from the flux density scale, the flux density of the MAGMO data also shows an apparent turnover around 1.7 GHz. An incorrect spectral index in the model of PKS 0823-500 could produce such an effect. On the other hand, the turnover could be real, but it would have to be a very short-lived phenomenon, since we did not see it in our observations in December 2012, not even a year after the MAGMO ones. The unconfirmed result makes it difficult to ascertain the reliability of the possible turnover.
In any case, the global flattening of the flux density as a function of frequency, which we see in our observations in a timescale of 1-2 years (Fig. 1) is a robust result, since the same slope is seen in three different frequency ranges, observed independently.
4. Discussion
Several scenarios are possible for the origin and variations of the thermal and non-thermal radio continuum emission detected at I15103. We describe in the following the different hypothesis and their implication in the global context of stellar evolution.
4.1. Thermal emission from ionized gas
The weak emission detected on the radio continuum map with spectral indices (Fig. 2) is compatible with the typical free-free emission from ionized gas in PNe. It could represent photoionized gas extending toward the northeast lobe of the mid-IR nebulosity (Lagadec et al. 2011), in the direction of the water maser jet (Gómez et al. 2015). The overall emission in the source, however, is strongly dominated by non-thermal emission.
4.2. The origin of non-thermal emission and its variation
A very striking characteristic of the radio emission in I15103 is that it mostly shows negative spectral indices (see Fig. 2), which indicates that it is dominated by non-thermal processes. This emission should arise from electrons moving in a magnetized medium. In particular, the spectral index found between 8 and 25 GHz in 2010-2011 is consistent with either synchrotron emission from relativistic electrons, or gyrosynchrotron from mildly relativistic ones. The spectral index both in the case of synchrotron or gyrosynchrotron emission depends on the power-law energy distribution of electrons (). Therefore, a change in spectral index, as observed between 2010 and 2012, could indicate a time variation in this energy distribution that can be used to discern which processes are at work. Alternatively, it could be the result of absorption or suppression processes that are stronger on radiation at lower frequencies. We will discuss these possibilities in the following.
4.2.1 Synchrotron emission and Coulomb collisions
The spectral index is similar to that found in synchrotron emission in galaxies with active nuclei (Bridle & Perley 1984). In the case of pure synchrotron emission, the spectral index can be related to the energy distribution of electrons, in the form . In our case, the observed would imply a value of .
In the energy conditions of PNe, mass-loss processes can produce collisionless, non-relativistic shocks and electrons may undergo diffusive shock acceleration (Drury 1983; Achterberg 2000) up to very high velocities (this process is also called “first-order Fermi acceleration”). In this case, the exponent of the energy distribution of electrons is given by
| (1) |
where is the compression ratio of the gas at the shock. The maximum value of in an ideal, non-relativistic gas is . The value we obtained indicates that is close to this maximum value.
In the case of the data taken on October 2012, the spectral index of found between 4.5 and 25 GHz would imply an index for the energy distribution of electrons, if the emission were due to synchrotron emission. However, since the maximum compression ratio in collisionless shocks is , diffusive shock acceleration cannot explain indices . Therefore, the spectral index in the pure synchrotron regime should always be , while the acceleration is taking place.
However, the synchrotron emission could be the result of a shock that took place during a short time and electrons are not being accelerated any longer. In that case, the observed spectral flattening reflects the evolution of electron energy after the shock ended. We note that I15103 is a PN (Gómez et al. 2015), and it has developed a photoionized region around it. When the relativistic electrons move in a dense plasma, they lose energy due to Coulomb collisions against ions. The lifetime of electrons of lower energy is shorter under Coulomb losses (e.g., Rephaeli 1979; Sarazin 1999):
| (2) |
were is the electron density of the plasma expressed in cm-3, and is the Lorentz factor of the relativistic electrons. The result is a progressive hardening of the energy distribution, with less electrons of low energy. This will lead to a flattening of the synchrotron spectrum. Spectral flattening due to Coulomb collisions is also observed in the radio spectrum of solar flares (Melnikov & Magun 1998; Lee & Gary 2000).
The lifetimes of electrons under Coulomb collisions are consistent with the observed flattening of I15013 over time. In particular, assuming a magnetic field of mG, as seen in some post-AGB stars (Bains et al. 2003, 2004), according to Shu (1991), the Larmor frequency of electrons
| (3) |
(where and are the electron charge and mass, respectively, and is the magnetic field strength) would be kHz. Thus, the synchrotron emission at GHz would typically be due to electrons with .
Equation 2 indicates that the lifetime of these electrons under Coulomb collisions and assuming electron density of cm-3 (e.g. Tafoya et al. 2009) would be yr. This is a reasonable value considering the timescales of variations at low frequency shown in Fig. 1. Under this interpretation, the observed non-thermal emission in I15103 would be due to synchrotron emission from electrons accelerated during an explosive event that occurred a few years ago, and the emission would now be decaying due to Coulomb losses.
We note that a recent explosive event would also explain the velocity gradient of the maser emission in this source (Gómez et al. 2015), which reinforces this interpretation.
We also note that the timescale of relativistic electrons will shorten with increasing plasma density (equation 2). The change in spectral index between 2010 and 2012 seems particularly sudden compared with the evolution in previous years. This is suggestive of an increasing density of ionized gas, consistent with I15103 being a very young PN that is developing its photoionized region.
4.2.2 Gyrosynchrotron emission from mildly relativistic electrons
An alternative explanation to the observed change in the SED of I15103 would be that we witness the variation in gyrosynchrotron emission from mildly relativistic electrons. This radiative process is seen in active stars (e.g., Dulk 1985; Gunn et al. 1994; Pestalozzi et al. 2000). The flux density of these stars roughly follows a power-law of the form
| (4) |
where the relation between the spectral index and the distribution of electrons is given by (Dulk 1985), is the pitch angle between the electron trajectory and the magnetic field, and is the electron-cyclotron frequency.
Equation (4) does not take into account any effect from the thermal plasma, and gyrosynchrotron emission will in general deviate from a simple power law (see, e.g. Fleishman & Kuznetsov 2010; Kuznetsov et al. 2011). However, it serves to illustrate the feasibility of this mechanism in the case of I15103.
As in the previous hypothesis, the change in spectral index would imply a change in the energy distribution of electrons, and all spectral indices observed in I15103 are in principle possible. Considering that the flux density has not changed much at 23 GHz between 2010 and 2013, equation 4 implies that magnetic fields of several kG are necessary to flatten the radio spectrum while maintaining a similar flux density at 23 GHz. These magnetic field strengths have not been observed in PNe (Leone et al. 2014), which makes this hypothesis highly unreliable.
4.2.3 Opacity of free thermal electrons and Razin effect
We have also explored the possibility that the change in the spectral index were not due to a variation in the electron distribution, but to selective absorption/suppression of radiation at low frequencies. If the emission on 2010-2011 is of gyrosynchrotron/synchrotron nature, this can be later suppressed by an increasing amount of ionized gas via two possible processes: a) opacity from free electrons or b) the Razin (or Razin-Tsytovich) effect (Razin 1960; Tsytovich 1951; Ginzburg & Syrovatskii 1965). Both processes are more efficient at lower frequencies.
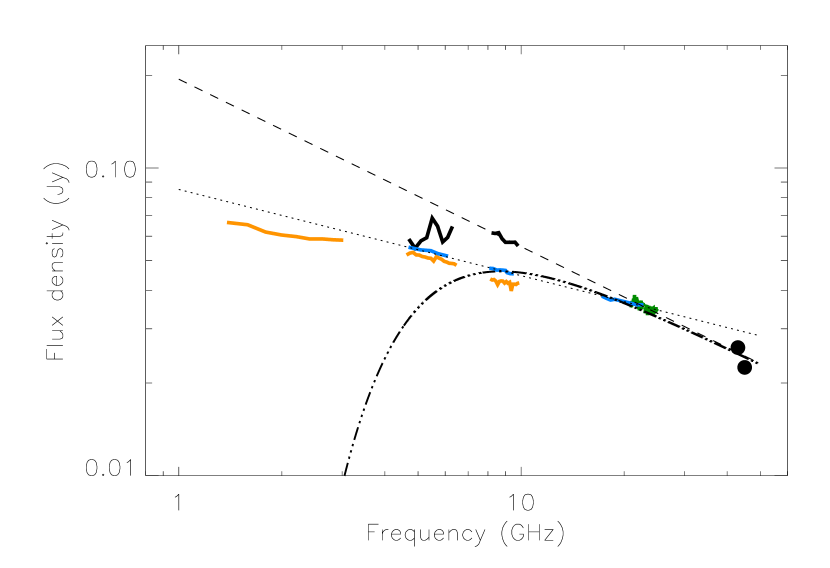
In the former case (a), the opacity due to free electrons has a dependency . We tested this possibility against our data, assuming a screen of ionized material between the observer and the source of non-thermal emission, and applying an optical depth to a SED with spectral index , varying the constant until we reached a final spectral index of between 8 and 23 GHz. However, the resulting screen of ionized gas would have such a high opacity at lower frequencies that we should not detect any emission at GHz (Fig. 3). Moreover, an optically thick screen of free electrons would produce thermal free-free emission with a flux density proportional to , where is the solid angle subtended by the screen. Given the frequency dependence of free-free emission, it cannot compensate the deficit of emission at 1-2 GHz since, in that case, thermal emission would dominate at even higher frequencies, with a positive spectral index that is not observed.
In the case of Razin effect (b), the shape of the spectral energy distribution of synchrotron emission within a plasma takes the form
| (5) |
(function P in equation 5 in Pacholczyk 1970, but with some changes in the nomenclature of variables), where
| (6) |
| (7) |
The function is defined as
| (8) |
where is the Bessel function of order 5/3.
The key parameter is the ratio , which controls the change in spectral slope. Assuming , the critical frequency below which the synchrotron emission is mostly suppressed is . Applying Equation 5 to a SED with spectral index , to reach a final spectral index of between 8 and 23 GHz, would also imply the complete suppression of emission at low frequency, as in the case of plasma opacity (a), ruling out these two hypothesis.
4.2.4 Combination of thermal and non-thermal emission
A possible explanation for the observed change in spectral index is the behavior predicted by Fleishman (2006) for non-thermal emission within dense plasmas when the magnetic field has both an ordered and a random component.
We note that the spectral index observed in 2012 is similar to that in the Crab nebula (Bietenholz et al. 1997) and other pulsar wind nebulae (Gaensler & Slane 2006). In these cases, the emission can be interpreted as “jitter” (or “diffusive synchrotron”) radiation (Toptygin & Fleishman 1987; Medvedev 2000; Fleishman & Bietenholz 2007), i.e., electrons moving in a random magnetic field, as opposed to the ordered field for usual synchrotron emission.
If we consider I15103 as having both an ordered and a random component, where the ordered component dominates, relativistic electrons moving along the magnetic field lines would mainly show a normal synchrotron emission, with a relatively small contribution of jitter emission. However, if this magnetic field is embedded in a plasma, the Razin effect would suppress the synchrotron component. The suppression of jitter emission depends much more slowly on plasma density (equation 40 in Fleishman 2006), and therefore, if this density is sufficiently high, the jitter emission will eventually dominate the entire spectrum even though the magnetic field and the electron energetics remained unchanged. The Razin effect is actually stronger in the presence of dense plasmas and relatively weak magnetic fields, so we expect it to be more readily detectable under the physical conditions of PNe, over those in other synchrotron-emitting objects, such as radio galaxies or supernovae.
In this scenario, and for the case of I15103, until 2010, while the photoionization of the PN was still low, it would show a mixture of synchrotron and jitter emission (consistent with a magnetic field with an ordered and a turbulent component). The increasing plasma density of the newly formed ionized region of the PN would then suppress the synchrotron component due to Razin effect. The final result would be pure jitter emission in the 2012 data. If the change in the spectral slope is due to a sudden change in the dominant radio continuum emission mechanism, it would suggest that we are witnessing the onset of the photoionization in a PN. However, given that we do not have a direct determination of the magnetic field strength, the plasma density, and the size of the non-thermal emitting region, it is not possible at this point to determine whether this interpretation is correct.
It is interesting to compare the flattening in the spectral energy distribution of the radio continuum emission, with the flattening seen in the post-AGB star IRAS 154455449 (Pérez-Sánchez et al. 2013), whose nature is clearly different from the one we see in I15103. In IRAS 154455449, the change in the slope between 2.5 and 22 GHz is due to an increase of flux density at high frequencies. This was interpreted as an increasingly higher contribution of free-free emission which could arise from a shock-ionized wind. It is known that a highly collimated ionized wind can produce significant free-free emission (Reynolds 1986), and a stronger emission at high frequencies could be the consequence of a sudden increase in its mass-loss rate. On the contrary, the flattening we observe in I15103 is due to a decrease of flux density at low frequencies. The flux density distribution seems to go down, pivoting around GHz, where it does not change much. This cannot be explained by an increase of free-free emission, but strongly indicates a suppression of emission at low frequencies. Other post-AGB stars show non-thermal emission (Bains et al. 2009), but there is no information on their time evolution, so a comparison is not possible at this stage.
Flat radio spectra with indices have also been found in Wolf-Rayet stars (Chapman et al. 1999), and explained as a combination of thermal and non-thermal emission in colliding wind binaries. Under these models, the non-thermal component has , and the flattening would be attributed to the thermal mechanism. However, as mentioned above, we cannot explain the progressive flattening of the spectrum in I15103 with an increase of thermal emission.
4.3. Processes taking place during the birth of a planetary nebula
I15103 is the first known PN in which synchrotron emission could be detected, since the free-free emission is so weak that it has not masked the non-thermal emission yet. This non-thermal emission due to shocks could share a common origin with that seen in some post-AGB stars (Bains et al. 2009; Pérez-Sánchez et al. 2013).
However, in the case of I15103, if we assume the Coulomb losses as the explanation for the variability in the spectral index (Sec. 4.2.1), we would be observing the results of a jet launched close to the moment when the post-AGB becomes a PN. Theoretical predictions affirm that jets can be launched when magnetic field lines are twisted due to the different rotation speeds of the envelope and the stellar core of an evolved star, and the energy is released in the form of a collimated ejection (Matt et al. 2006). The conditions for this magnetic explosion will be favoured when a star enters the PN phase, as is the case of I15103, since the magnetic field lines away from the star will tend to be locked by the ionized gas to the slower rotational motions of the outer envelope. Moreover, recent studies show that magnetic fields are stronger in older post-AGB stars and might be related to the origin of non-spherical morphologies in these objects (Gonidakis et al. 2014).
The changes in the spectral index could also be produced by the Razin effect (Sec. 4.2.4), where the beginning of photoionization could start new physical processes that affect the behavior of the radio continuum emission.
Previous studies of radio continuum in very young PNe showed that in several cases (Cerrigone et al. 2008, 2011; Casassus et al. 2007) the observed spectral index could not be explained by the classical optically thin free-free emission and the deviations from the expected were in some cases attributed to calibration uncertainties or other instrumental effects. Radio continuum variability as well as negative spectral indices were also found in young PNe (Cerrigone et al. 2011), but limited time and frequency coverage prevented a detailed identification of the processes taking place. In fact, it is possible that some of these young PN may be undergoing the same processes as we are witnessing in I15103, but it has only been possible to identify them in this study, thanks to the implementation of new broad-band receivers and correlators in radio telescopes such as ATCA or the Jansky Very Large Array.
4.4. Predictions on source characteristics and their future evolution
A monitoring of the radio spectrum of I15103 would shed light on the processes taking place in this unique object. As shown above, possible origins of the variation seen in the spectral index are changes in synchrotron emission due to Coulomb collisions (Sec. 4.2.1), or selective suppression of part of the emission due to Razin effect (Sec. 4.2.4). However, we expect that these processes would lead to different future evolutions in the short term. In the case of changes in the energy distribution of electrons due to Coulomb collisions, we expect that the spectral flattening will continue. Eventually, a low-frequency cutoff will arise in the spectrum, reflecting a complete suppression of electrons below an energy threshold. On the other hand, if the physical process is Razin suppression of synchrotron emission, leaving only jitter emission, we do not expect a significant further flattening of the emission, since the dominant radiative process after 2012 should not be immediately affected by the Razin effect.
As seen in Fig. 2, the possible contribution of free-free emission from ionized material is still much weaker than the non-thermal emission in this source. In the long term, we predict that free-free radiation will significantly increase in the future, as photoionization proceeds. Its more immediate effects would be an increase of flux densities at high frequencies due to free-free emission, and a decrease at low frequencies due to the absorption of non-thermal emission by the plasma opacity. At later times, free-free emission will eventually dominate the radio spectrum of the source, giving rise to a thermal SED similar to other young PNe (Gómez et al. 2005), with no trace of the non-thermal emission that we observe now.
5. Conclusions
We have observed radio continuum emission between 1 and 46 GHz towards the young PN IRAS 151035754, in different epochs between 2010 and 2012, using the Australia Telescope Compact Array. Archive radio continuum data from 1991 to 2012 have been used to complete the information on this source. Our main conclusions are as follow:
-
•
Radio continuum emission shows a non-thermal spectrum, which is not typical of PNe.
-
•
The flux density seems to have decreased with time, especially at the lowest frequencies. In particular we see a flattening of the spectrum, with a spectral index in 2010-2011, which changed to in 2012. While the radio spectrum observed in 2010-2011 can be explained as arising from synchrotron emission with electrons accelerated in a shock, the one in 2012 is not compatible with this process alone.
-
•
The variation of the radio spectrum in I15103 can be attributed to two effects of the onset of photoionization in this source:
-
–
The loss of energy of the synchrotron-emitting electrons due to Coulomb collisions within the ionized region of the PN. The estimated lifetime of the electrons is 18 yr, consistent with the timescale of variation of the flux density in the archival data. The onset of the photoionization could produce the sudden change visible in the spectral index between 2010 and 2012.
-
–
The electrons moving in a magnetic field with both an ordered and a random component, which would give rise to a mixture of synchrotron and ”jitter” emission. The Razin effect would suppress the synchrotron component as photoionization progresses. Only the jitter component with a flatter spectral index, will remain.
-
–
-
•
We postulate that the flattening of non-thermal spectra could be a signature of the onset of the PN phase.
References
- Achterberg (2000) Achterberg, A. 2000, in IAU Symposium, Vol. 195, Highly Energetic Physical Processes and Mechanisms for Emission from Astrophysical Plasmas, ed. P. C. H. Martens, S. Tsuruta, & M. A. Weber, 291
- Bains et al. (2009) Bains, I., Cohen, M., Chapman, J. M., Deacon, R. M., & Redman, M. P. 2009, MNRAS, 397, 1386
- Bains et al. (2003) Bains, I., Gledhill, T. M., Yates, J. A., & Richards, A. M. S. 2003, MNRAS, 338, 287
- Bains et al. (2004) Bains, I., Richards, A. M. S., Gledhill, T. M., & Yates, J. A. 2004, MNRAS, 354, 529
- Bendjoya et al. (2014) Bendjoya, P., Suárez, O., Gómez, J. F., et al. 2014, in Asymmetrical Planetary Nebulae VI conference, Proceedings of the conference held 4-8 November, 2013. Edited by C. Morisset, G. Delgado-Inglada and S. Torres-Peimbert. http://www.astroscu.unam.mx/apn6/PROCEEDINGS/, 5
- Bietenholz et al. (1997) Bietenholz, M. F., Kassim, N., Frail, D. A., et al. 1997, ApJ, 490, 291
- Bobrowsky et al. (1998) Bobrowsky, M., Sahu, K. C., Parthasarathy, M., & García-Lario, P. 1998, Nature, 392, 469
- Bridle & Perley (1984) Bridle, A. H., & Perley, R. A. 1984, ARA&A, 22, 319
- Carrasco-González et al. (2010) Carrasco-González, C., Rodríguez, L. F., Anglada, G., et al. 2010, Science, 330, 1209
- Casassus et al. (2007) Casassus, S., Nyman, L.-Å., Dickinson, C., & Pearson, T. J. 2007, MNRAS, 382, 1607
- Cerrigone et al. (2011) Cerrigone, L., Trigilio, C., Umana, G., Buemi, C. S., & Leto, P. 2011, MNRAS, 412, 1137
- Cerrigone et al. (2008) Cerrigone, L., Umana, G., Trigilio, C., et al. 2008, MNRAS, 390, 363
- Chapman et al. (1999) Chapman, J. M., Leitherer, C., Koribalski, B., Bouter, R., & Storey, M. 1999, ApJ, 518, 890
- Cohen et al. (2006) Cohen, M., Chapman, J. M., Deacon, R. M., et al. 2006, MNRAS, 369, 189
- de Marco (2009) de Marco, O. 2009, PASP, 121, 316
- Dgani & Soker (1998) Dgani, R., & Soker, N. 1998, ApJ, 499, L83
- Drury (1983) Drury, L. O. 1983, Reports on Progress in Physics, 46, 973
- Dulk (1985) Dulk, G. A. 1985, ARA&A, 23, 169
- Fleishman (2006) Fleishman, G. D. 2006, in Lecture Notes in Physics, Berlin Springer Verlag, Vol. 687, Geospace Electromagnetic Waves and Radiation, ed. J. W. Labelle & R. A. Treumann, 87–99
- Fleishman & Bietenholz (2007) Fleishman, G. D., & Bietenholz, M. F. 2007, MNRAS, 376, 625
- Fleishman & Kuznetsov (2010) Fleishman, G. D., & Kuznetsov, A. A. 2010, ApJ, 721, 1127
- Gaensler & Slane (2006) Gaensler, B. M., & Slane, P. O. 2006, ARA&A, 44, 17
- Gaensler et al. (2000) Gaensler, B. M., Stappers, B. W., Frail, D. A., et al. 2000, MNRAS, 318, 58
- García-Segura et al. (2005) García-Segura, G., López, J. A., & Franco, J. 2005, ApJ, 618, 919
- Ginzburg & Syrovatskii (1965) Ginzburg, V. L., & Syrovatskii, S. I. 1965, ARA&A, 3, 297
- Gómez et al. (2005) Gómez, J. F., de Gregorio-Monsalvo, I., Lovell, J. E. J., et al. 2005, MNRAS, 364, 738
- Gómez et al. (2015) Gómez, J. F., Suárez, O., Bendjoya, P., et al. 2015, ApJ, 799, 186
- Gonidakis et al. (2014) Gonidakis, I., Chapman, J. M., Deacon, R. M., & Green, A. J. 2014, MNRAS, 443, 3819
- Green et al. (2012) Green, J. A., McClure-Griffiths, N. M., Caswell, J. L., Robishaw, T., & Harvey-Smith, L. 2012, MNRAS, 425, 2530
- Gunn et al. (1994) Gunn, A. G., Spencer, R. E., Abdul Aziz, H., et al. 1994, A&A, 291, 847
- Imai et al. (2007) Imai, H., Sahai, R., & Morris, M. 2007, ApJ, 669, 424
- Kuznetsov et al. (2011) Kuznetsov, A. A., Nita, G. M., & Fleishman, G. D. 2011, ApJ, 742, 87
- Kwok et al. (1981) Kwok, S., Purton, C. R., & Keenan, D. W. 1981, ApJ, 250, 232
- Lagadec et al. (2011) Lagadec, E., Verhoelst, T., Mékarnia, D., et al. 2011, MNRAS, 417, 32
- Lee & Gary (2000) Lee, J., & Gary, D. E. 2000, ApJ, 543, 457
- Leone et al. (2014) Leone, F., Corradi, R. L. M., Martínez González, M. J., Asensio Ramos, A., & Manso Sainz, R. 2014, A&A, 563, A43
- Lumsden et al. (2013) Lumsden, S. L., Hoare, M. G., Urquhart, J. S., et al. 2013, ApJS, 208, 11
- Matt et al. (2006) Matt, S., Frank, A., & Blackman, E. G. 2006, ApJ, 647, L45
- Medvedev (2000) Medvedev, M. V. 2000, ApJ, 540, 704
- Melnikov & Magun (1998) Melnikov, V. F., & Magun, A. 1998, Sol. Phys., 178, 153
- Mirabel et al. (1992) Mirabel, I. F., Rodriguez, L. F., Cordier, B., Paul, J., & Lebrun, F. 1992, Nature, 358, 215
- Miranda et al. (2001) Miranda, L. F., Gómez, Y., Anglada, G., & Torrelles, J. M. 2001, Nature, 414, 284
- Murphy et al. (2007) Murphy, T., Mauch, T., Green, A., et al. 2007, MNRAS, 382, 382
- Nordhaus & Blackman (2006) Nordhaus, J., & Blackman, E. G. 2006, MNRAS, 370, 2004
- Pacholczyk (1970) Pacholczyk, A. G. 1970, Radio astrophysics. Nonthermal processes in galactic and extragalactic sources
- Pérez-Sánchez et al. (2013) Pérez-Sánchez, A. F., Vlemmings, W. H. T., Tafoya, D., & Chapman, J. M. 2013, MNRAS, 436, L79
- Pestalozzi et al. (2000) Pestalozzi, M. R., Benz, A. O., Conway, J. E., & Güdel, M. 2000, A&A, 353, 569
- Razin (1960) Razin, V. A. 1960, Iz. Vys. Ucheb. Zaved. Radiofiz., 584, 3
- Rephaeli (1979) Rephaeli, Y. 1979, ApJ, 227, 364
- Reynolds (1986) Reynolds, S. P. 1986, ApJ, 304, 713
- Sabin et al. (2007) Sabin, L., Zijlstra, A. A., & Greaves, J. S. 2007, MNRAS, 376, 378
- Sahai & Trauger (1998) Sahai, R., & Trauger, J. T. 1998, AJ, 116, 1357
- Sarazin (1999) Sarazin, C. L. 1999, ApJ, 520, 529
- Shu (1991) Shu, F. H. 1991, Physics of Astrophysics, Vol. I (University Science Books)
- Soker & Rappaport (2000) Soker, N., & Rappaport, S. 2000, ApJ, 538, 241
- Tafoya et al. (2009) Tafoya, D., Gómez, Y., Patel, N. A., et al. 2009, ApJ, 691, 611
- Toptygin & Fleishman (1987) Toptygin, I. N., & Fleishman, G. D. 1987, Ap&SS, 132, 213
- Tsytovich (1951) Tsytovich, V. N. 1951, Vestn. Mosk. Univ., 11, 27
- Urquhart et al. (2007) Urquhart, J. S., Busfield, A. L., Hoare, M. G., et al. 2007, A&A, 461, 11
- van de Steene & Pottasch (1993) van de Steene, G. C. M., & Pottasch, S. R. 1993, A&A, 274, 895