11email: wkollat@astro.physik.uni-goettingen.de 22institutetext: XMM-Newton Science Operations Centre, ESA, Villafranca del Castillo, Apartado 78, 28691 Villanueva de la Cañada, Spain 33institutetext: Osservatorio Astronomico di Brera (INAF), via Brera 28, I-20121 Milano, Italy
Proving strong magnetic fields near to the central black hole in the quasar PG0043+039 via cyclotron lines
Abstract
Context. The optical luminous quasar PG0043+039 has not been detected before in deep X-ray observations indicating the most extreme optical-to-X-ray slope index of all quasars.
Aims. This study aims to detect PG0043+039 in a deep X-ray exposure. Furthermore, we wanted to check out whether this object shows specific spectral properties in other frequency bands.
Methods. We took deep X-ray (XMM-Newton), far-ultraviolet (HST), and optical (HET, SALT telescopes) spectra of PG0043+039 simultaneously in July 2013.
Results. We just detected PG0043+039 in our deep X-ray exposure. The steep gradient is consistent with an unusual steep gradient Fν with seen in the UV/far-UV continuum. The optical/UV continuum flux has a clear maximum near 2500 Å. The UV spectrum is very peculiar because it shows broad humps in addition to known emission lines. A modeling of these observed humps with cyclotron lines can explain their wavelength positions, their relative distances, and their relative intensities. We derive plasma temperatures of T 3 keV and magnetic field strengths of B 2 G for the line-emitting regions close to the black hole.
Key Words.:
Galaxies: active – Galaxies: quasars – Galaxies: individual: PG0043+0391 Introduction
Active galactic nuclei (AGNs) emit enormous luminosities at all frequency ranges from the radio to the X-ray regime. The overall spectral energy distribution (SED) of these broad line emitting AGN shows general trends seen in their mean SED (Richards et al.2006). However, some outliers exist, such as PG0043+039. It is the only quasar in the PG sample (Schmidt & Green,1983) that was not detected in a dedicated deep XMM-Newton pointing (Czerny et al. 2008). It shows the most extreme optical to X-ray slope of all AGNs in the Brandt et al. (2000) sample. PG0043+039 (z=0.38512) has been classified as a broad absorption line (BAL) quasar (Turnshek et al.1994) based on a broad CIV absorption. The majority of broad absorption line quasars are X-ray weak. This is usually explained by the absorption of the outflowing wind in combination with the wind’s velocity shear. A conclusive interpretation of the X-ray weakness in PG0043+039 was hampered by the absence of simultaneous measurements, which is mandatory because both the X-ray flux and the broad absorption system are known to be variable. We took simultaneous observations in the optical, UV, and X-ray of PG0043+039 to pin down the optical to X-ray slope. Furthermore, we wanted to test whether PG0043+039 shows additional special spectral properties.
2 Observations and data reduction
We executed
simultaneous multifrequency observations of PG0043+039
in July 2013
with the original idea of probing the nature and understanding the origin
of the X-ray weakness of PG0043+039, while ensuring that we are rid of the
potential uncertainties that variability could create.
We used the XMM-Newton satellite in the medium X-ray regime, the
Hubble Space Telescope (HST) in the far-UV, and the ground-based
10m Hobby-Eberly and Southern African Large Telescopes
(HET, SALT)
in the optical to investigate this quasar in more detail. Furthermore,
this object has simultaneously been observed with the NuSTAR satellite
in the hard X-ray range (Luo et al.2014).
XMM-Newton observations:
PG0043+039 was observed
on July 18, 2013 under ObsId 690830201.
We screened for low background periods (Schartel et al.2007,
and Piconcelli et al.2005)
and obtained clean exposure times
of 14.5 ks for pn, 29.0 ks for MOS 1, and 31.3 ks for MOS 2. PG 0043+039 is
clearly visible as a weak point source in the images of all three cameras.
Since the source is weak, we added the pn, MOS 1,
and MOS 2 spectra. We obtained a count rate of
1.420.17 10-3 counts s-1
for the added signal.
An intrinsically absorbed power law can describe the spectrum
(C 55.52, d.o.f. 57)
and reveals
NH 4.9 1021 cm-2
and
1.55.
Within its error margin, the power-law index
agrees with the indices commonly found for optically selected quasars
(Piconcelli et al.2005).
The intrinsic absorbing column density cannot explain the X-ray weakness of
the quasar. We obtain a flux
F(2.0–10.0 keV) 1.80 10-14 ergs cm2 s-1
where the errors are provided for the 68% confidence.
HST-COS far-UV spectroscopy:
We observed PG0043+039 over one full HST orbit with an exposure time
of 1552 s on July 18, 2013.
We used the COS/NUV spectrograph with the G140L grating and an 2.5 arcsec
aperture (circular diameter).
This spectral set covers the wavelength range from 1110 Å to 2150 Å with a resolving power of 2000 at 1500 Å.
For filling up the wavelength hole produced by the chip gap and for reducing
the fixed pattern noise, we split our observation into four separate segments
of 388 s duration at two different FP-POS offset positions and four different
central wavelengths.
The original data were processed using the
standard CALCOS calibration pipeline.
Ground-based spectroscopy with the SALT/HET telescopes:
One optical spectrum of PG0043+039 has been obtained with the
10m Southern African Large Telescope (SALT)
nearly simultaneously to the XMM/HST observations on July 21,
2013, under photometric conditions.
The spectrum was taken with the Robert Stobie Spectrograph
attached to the telescope.
The exposure time of our spectrum amounted to 2200 s.
We covered the wavelength range from
6445 to 9400 Å at a spectral resolution of 4.8 Å (FWHM).
The observed wavelength range corresponds to
a wavelength range from 4653 to 6786 Å in the rest frame of the galaxy.
A second optical spectrum of PG0043+039 was taken by us
with the 9.2m Hobby-Eberly Telescope (HET) at McDonald Observatory
on August 1, 2013, under nearly photometric conditions.
Here we choose an exposure time of 1500 s.
We used the
Marcario Low Resolution Spectrograph (LRS)
at the prime focus of the telescope.
This spectrum covers the wavelength range from 4390 Å to 7275 Å
corresponding to 3170 to 5250 Å
in the rest frame of the galaxy.
The reduction of the spectra (bias subtraction, cosmic ray correction, flat-field correction, 2D-wavelength calibration, night sky subtraction, and flux calibration) was done in a homogeneous way with IRAF reduction packages (Kollatschny et al.2001). Details of the observations and their reduction will be given in a separated paper (Kollatschny et al.2015b). All wavelengths were converted to the rest frame of the galaxy with a redshift of z=0.38512.
3 Results and discussion
3.1 UV/far-UV and optical spectra of PG0043+039
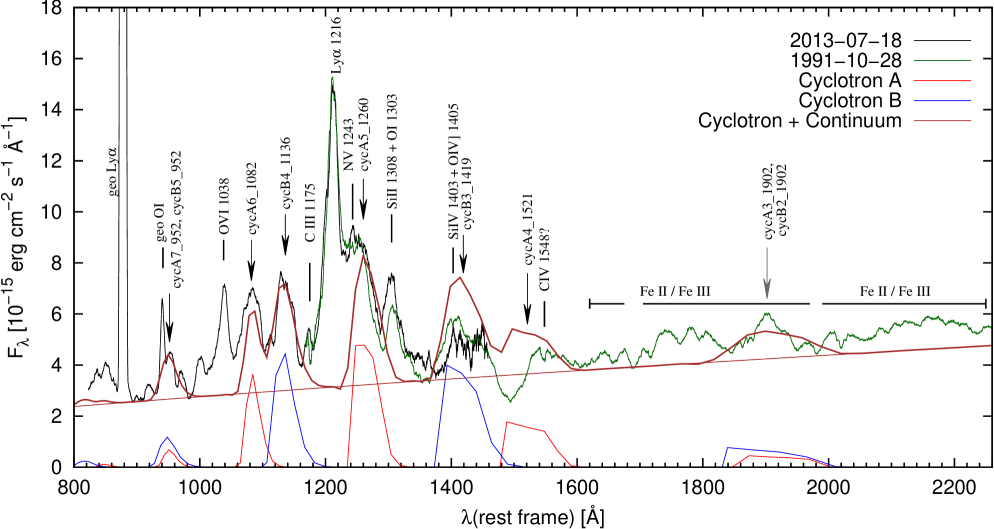
The UV spectrum of PG0043+039 that was taken with the HST-FOS in July 2013 is shown in Fig. 1. This spectrum covers the intrinsic wavelength range of 820 to 1550 . Overlaid is a second UV spectrum of PG0043+03 that was taken before with the HST-FOS spectrograph in 1991 (Turnshek et al.1994). This spectrum covered the intrinsic wavelength range from 1130 to 2300 . The continuum and line fluxes increased by a factor of 1.8 between the years 1991 and 2013 when comparing the overlapping wavelength range of both UV spectra (Kollatschny et al.2015b). We multiplied the observed UV spectrum taken in 1991 with this factor of 1.8 (in Fig. 1) to match the UV observations of 2013. The HST spectra have been smoothed ( or ) for high-lightening weaker spectral structures. We corrected the UV, as well as our optical spectra of PG0043+039 for a Galactic extinction E(B-V) = 0.02087 that was taken from Schlafly & Finkbeiner (2011). Overlaid is a power-law continuum Fλ with (in Fig. 1). For fitting this UV continuum, we used the spectral windows at 895, 983, 1360, 1609, and 1689 with typical widths of 10 .
There is no detectable Lyman edge associated with the BAL absorbing gas. Furthermore, we indicate the identifications of the strongest UV emission lines Ly, , etc., of the geo-coronal lines, as well as of other emission lines that we attribute to two cyclotron systems A and B with their second to seventh harmonics. The integer numbers identify the emissions with multiples of the cyclotron fundamental. Longward of 1600 , the spectrum is contaminated by FeII and FeIII blends. The observed UV/far-UV spectrum of PG0043+039 is quite different from the UV spectra of other quasars or BALQs (Hall et al. 2002, Baskin et al. 2013, Saez et al. 2012).
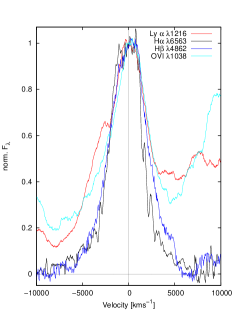
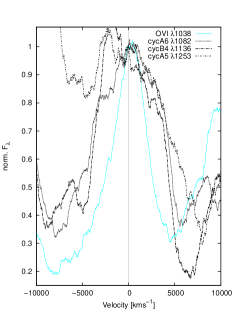
The strongest atomic emission lines in the UV are the Ly and O vi lines. The strongest emission lines in the optical spectra of PG0043+039 are the Balmer lines H and H. We show the optical and UV profiles of these lines jointly in Fig. 2 in velocity space. They are normalized to the same maximum intensity. All these broad emission lines exhibit very similar profiles and have nearly identical line widths of 4000 to 4800 km s-1(FWHM) except Ly, which shows a slightly broader line width of 6300 km s-1. This difference might be simulated by a different determination of the underlying continuum caused by additional underlying line components. Furthermore, we present the profiles of the strongest UV humps that we attribute to the cyclotron lines CycA6, CycB4, and CycA5 – in velocity space – in comparison to the O vi line. Again they are normalized to the same maximum intensity. All the cyclotron lines show similar line widths of about 10 000 km s-1, on the one hand, and as a whole, different line shapes than those of the normal emission lines, on the other hand.
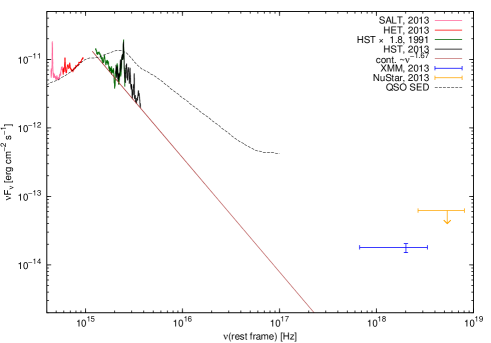
Figure 3 presents the observed optical-UV-X-ray
spectral distribution of PG0043+039 in July 2013.
Given are the optical
(taken with the SALT and HET telescopes), the UV, and the far-UV spectra taken with
the HST, the X-ray flux taken with the XMM-Newton satellite, as well as an upper
limit in the hard X-ray range (8–24 keV) obtained with NuSTAR
(Luo et al.2014). The UV spectrum taken in 1991 has been multiplied
with a factor of 1.8 to match the far-UV spectrum in 2013.
The extrapolation of the UV
power-law continuum Fν with
is in good agreement with the extreme
faint X-ray flux .
The figure shows the mean
composite SED (derived from
a sample of 259 quasars, Richards et al.2006) for comparison.
We scaled this composite spectrum at the frequency of Hz
with respect to the spectrum of PG0043+039.
The Balmer lines are the strongest optical emission lines
in the
spectrum of PG0043+039 besides their strong Fe ii blends
(Turnshek et al.1994, Kollatschny et
al.2015b).
The strongest atomic emission lines of AGNs
in the UV/far-UV range of 800 – 1500 Å are the
Ly, O vi , and N v lines.
We observe very similar line ratios of these UV emission lines
in comparison to those seen in a mean composite spectrum
(Shull et al.2012). However, PG0043+039 shows additional
strong broad lines or humps in the UV spectrum
that could not be attributed to known emission lines
based on their wavelength positions and relative intensities.
We compared the UV spectrum of PG0043+039 with those of
IZw1 (Laor et al.
1997), with a composite quasar spectrum (Vanden Berk et al.
2001), with Mrk 231 (Veilleux et al.2013,
Lipari et al. 2009), and with
ultraviolet composite spectra of AGN based on HST-COS observations
(Shull et al.2012, Stevans et al.2014).
Especially the strong broad emission humps/lines at
1082, 1136, and 1253 Å could not be attributed in a simple way
to known UV emission lines based on their wavelengths and relative intensities.
Before we demonstrate an alternative solution in the next section
that these lines can be attributed to cyclotron lines
we discuss the presence of line emissions
at these wavelength ranges in other AGNs first:
- The hump at 1082 Å is not seen in the composite AGN spectra of
Shull et al.(2012) and Stevans et al. (2014).
They list an expected N ii line at . However, there
is an unidentified emission feature in the composite AGN spectra that can
only be seen shortward of this position.
Furthermore, these authors assume
a continuum window to be there in the
wavelength range 1080–1110 Å. In the specific case
of the quasar HS 1103+3441 (TON 1329), an emission bump seems
to be present at around 1082 Å that could be attributed to
the N ii line at . However, this galaxy
shows an extreme [N iii] line in the optical
spectrum taken with Sloan Digital Sky Survey
(Schneider et al., 2007).
This optical line is not present in the spectrum of PG0043+039.
- At 1136 Å no spectral feature is to be seen in the composite AGN spectra.
On the other hand, Stevans et al. (2014)
find a weak spectral line of Fe iii at
Å. This line might contribute
to the outermost blue edge in our 1136 Å emission hump. Veilleux et al.
(2013) identify a very weak feature at Å in Mrk 231. They claim that an identification of this feature
with lines of NI or FeII is unlikely.
No emission line is to be seen at 1253 Å, in either Mrk 231 or the composite AGN spectra.
In principle, there is a weak possibility that the observed humps might be
caused by low ionization lines or blends of FeII or NII, for example. However, in that
case one should be able to explain why
all these emission features have the same widths,
broader than those of the regular emission lines.
Additionally, these bumps clearly protrude out of the continuum: they
are no normal line blends.
Mrk 231 shows weak unidentified humps in the UV as well
(Veilleux et al.2013), but at different wavelength
positions and at fainter intensities relative to PG0043+039.
3.2 Cyclotron emission lines in PG0043+039
Besides known UV emission lines, such as as Ly and O vi other broad line humps are to be seen in the UV spectrum of PG0043+039. One possible explanation for these lines it that we assigned these emission lines to cyclotron emission lines. A modeling of the observed features with cyclotron emission lines should simultaneously explain the wavelength positions, the relative distances between the lines, the relative intensities of the lines, and the widths of the lines.
Cyclotron emission lines have been established so far in the UV, optical, and infrared (IR) spectra of AM Herculis stars - so-called polars hosting strongly magnetic white dwarfs, as well as in intermediate polars. Typical magnetic field strengths are on the order of B = G in the inner magnetic accretion regions. Examples of observed and modeled cyclotron lines in AM Her stars are shown, for example, in Schwope et at. (2006), Campbell et al. (2008), and references therein. In the standard model for accretion onto a magnetic white dwarf (e.g., Lamb and Masters 1979) an adiabatic standing shock forms in the accretion column above the surface of the white dwarf at highly supersonic speeds. In the shock region, the kinetic energy is transformed into thermal energy, and the matter is slowed down into a subsonic settling flow. During this process the matter in the settling flow is heated to a shock temperature of K. The hot matter in the settling flow is then cooled down by thermal bremsstrahlung and/or cyclotron radiation in the UV-to-near-IR wavelength range. Cyclotron lines are emitted by nonrelativistic electrons in strong magnetic fields. Cyclotron emission occurs at the fundamental frequency that is given by and its higher harmonics n, where B is the magnetic field strength, and e and are charge and mass of the electron (e.g., Fischer & Beuermann 2001, and references therein). A broadening of the cyclotron spikes is caused, among others, by the high temperatures of the plasma and/or orientation or gradients in the magnetic field.
Magnetohydrodynamical shock formation is possible, for example, in equatorial/non-equatorial plasma flows close to the black-hole event horizon (Fukumura et al.2007, and references therein). Shocks in these MHD plasmas might be responsible for creating very hot T K and/or strongly magnetized plasma regions. These shocks could be the origin of cyclotron radiation similar to the origin of cyclotron radiation connected to shocks in CV stars.
We carried out various tests of whether it is possible to model the observed humps in the UV spectrum of PG0043+039 with cyclotron emission lines and their harmonics. We used a program described by Fischer & Beuermann (2001) originally developed for cyclotron radiation emitted from standing shocks above accreting magnetic white dwarfs. The physical parameters that affect the pattern of the cyclotron emission lines are the magnetic field strength B of the line emitting region, as well as their temperature T. An additional argument for modeling the lines is the dimensionless parameter with e ne l / B, where ne is the electron density and l is the size of the line emitting region. At the end we needed two cyclotron line systems that we called A and B systems for modeling the UV emission humps in PG0043+039. We show in Fig. 1 the computed wavelength position of the two cyclotron systems (A, B) with their second to seventh harmonics.
Our best fit to the observations yields plasma temperatures of T = 3.8 keV (A) (T K) and T = 1.9 keV (B) (T K) and field strengths of B = 1.95 (A) and 1.45 (B) G and log values of 4 and 7. This corresponds to line emitting region sizes of - cm2 for assumed density values of n. We did not correct for gravitational redshift or other relativistic effects. Since there is no theory for the formation of cyclotron lines originating in hot and highly magnetized plasma in the vicinity of super-massive black holes our solution is only a first-order approximation. On the other hand, it gives the first direct measurement of the magnetic field next to a black hole. The two observed systems might be explained by line emission from both magnetic poles. Two poles accretion configurations are known in a few cases for AM Her stars as well (e.g., Schwope et al. 1999). The underlying broad absorption feature of the line might be responsible for the overestimated cyclotron lines intensities at 1419 and 1521 Å in Fig. 1. A final confirmation of the presence of cyclotron lines in the UV spectra of AGN could be achieved through spectropolarimetry.
4 Summary
The extreme X-ray faint quasar PG0043+039 has finally been detected in a deep X-ray exposure with XMM-Newton as part of a multifrequency campaign. The far-UV spectrum, which was taken with the HST, turned out to be very peculiar in terms of showing various broad humps in addition to the normal emission lines. A modeling of these observed emission humps with cyclotron lines can explain the wavelength positions and their relative distances, as well as their relative intensities. We derived plasma temperatures of T 3 keV and magnetic field strengths of B = 2 G for the line emitting regions close to the black hole.
Acknowledgements.
This paper is based on observations taken with the XMM-Newton, HST, SALT, and HET Telescopes. We thank Klaus Reinsch and Axel Schwope for their advice on cyclotron line emission. We thank David Meier for valuable suggestions. This work has been supported by DFG grant Ko 857/32-2.References
- (1) Baskin, A., Laor, A., & Hamann, F. 2013, MNRAS, 432, 1525
- (2) Boksenberg, A., Carswell, R. F., Allen, D. A., et al. 1977, MNRAS, 178, 451
- (3) Brandt, W. N., Espey, B. R., Kopko, JR., M., et al. 2000, ApJ, 528, 637
- (4) Campbell, R. K., Harrison, T. E., Schwope, A. D. et al.. 2008, ApJ, 672, 531
- (5) Czerny, B., Siemiginowska, A., Janiuk, A. et al.. 2008, MNRAS, 386, 1557
- (6) Fischer, A., & Beuermann, K. 2001, A&A, 373, 211
- (7) Fukumura, K., Takahashi, M., Tsuruta, S. 2007, ApJ, 657, 415
- (8) Hall, P. B., Anderson, S. F., Strauss, M. A. et al. 2002, ApJS, 141, 267
- (9) Kollatschny, W., Bischoff, K., Robinson, E. L., et al. 2001, A&A, 379, 125
- (10) Kollatschny, W., Schartel, N., Zetzl, M., et al. 2015b, A&A, in prep.
- (11) Lamb, D. Q., Masters, A. R. 1979, ApJ, 234, 117
- (12) Laor, A., Jannuzi, B. T., Green, R. F., et al. 1997, ApJ, 489, 656
- (13) Luo, B., Brandt, W. N., Alexander, D. M., et al. 2014, ApJ, 794, 70
- (14) Lipari, S., Sanchez, S. F., Bergmann, M., et al. 2009, MNRAS, 392, 1295
- (15) Piconcelli, A., Jiménez-Bailón, E., Guanazzi,M. et al. 2005, A&A, 432, 15
- (16) Richards, G. T., et al., 2006, ApJS, 166, 470
- (17) Saez, C., Brandt, W. N., Gallagher, S. C., et al., 2012, ApJ, 759, 42
- (18) Schartel, N., Rodríguez-Pascual, P.M., Santos-Lleó, M., et al. 2007, A&A, 474, 431
- (19) Schlafly, E. F., & Finkbeiner D. P. 2011, ApJ., 737, 103
- (20) Schmidt, M., Green, R. F. 1983, ApJ, 269, 352
- (21) Schneider, D. P., et al. 2007, AJ, 134, 102
- (22) Schwope, A. D., Schwarz, R., & Greiner, J. 1999, A&A, 348, 861
- (23) Schwope, A. D., Schreiber, M. R., & Szkody, P. 2006, A&A, 452, 955
- (24) Shull, J. M., Stevans, M., & Danforth, C. W. 2012, ApJ, 752, 162
- (25) Stevans, M., Shull, J. M., & Danforth, C. W., et al. 2014, ApJ, 794, 75
- (26) Turnshek, D. A., Espey, B. R., Kopko, JR., M., et al. 1994, ApJ, 428, 93
- (27) Vanden Berk, D. E., Richards, G. T., Bauer, A., et al. 2001, ApJ, 122, 549
- (28) Veilleux, S., Trippe, M., Hamann, F., et al. 2013, ApJ, 764, 15