The Stellar Spectral Features of Nearby Galaxies in the Near-Infrared: Tracers of Thermally-Pulsing Asymptotic Giant Branch Stars?
Abstract
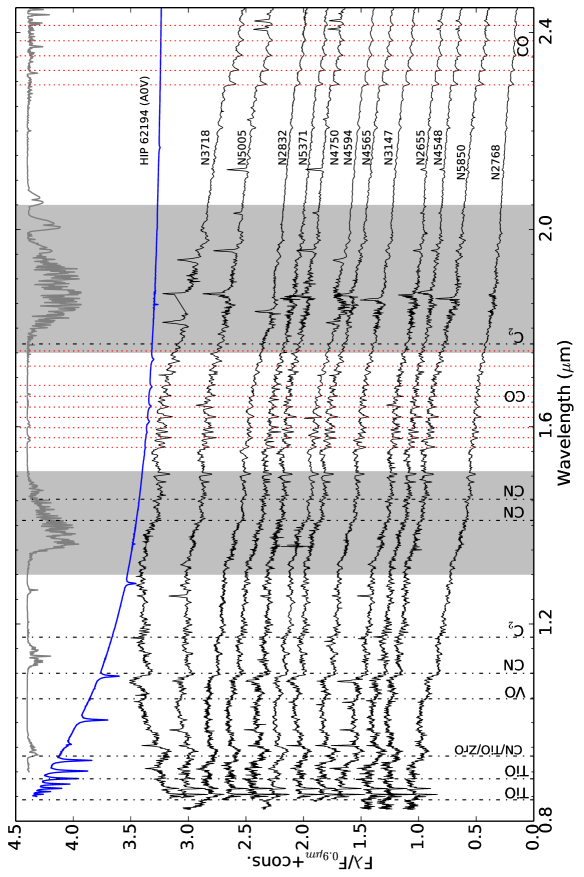
We analyze the stellar absorption features in high signal-to-noise ratio near-infrared (NIR) spectra of the nuclear region of 12 nearby galaxies, mostly spirals. The features detected in some or all of the galaxies in this sample are the TiO (0.843 m and 0.886 m), VO (1.048 m), CN (1.1 m and 1.4 m), H2O (1.4 m and 1.9 m) and CO (1.6 m and 2.3 m) bands. The C2 (1.17 m and 1.76 m) bands are generally weak or absent, although C2 (1.76 m) may be weakly present in the mean galaxy spectrum. A deep feature near 0.93 m, likely caused by CN, TiO and/or ZrO, is also detected in all objects. Fitting a combination of stellar spectra to the mean spectrum shows that the absorption features are produced by evolved stars: cool giants and supergiant stars in the early- or thermally-pulsing asymptotic giant branch (E-AGB or TP-AGB) phases. The high luminosity of TP-AGB stars, and the appearance of VO and ZrO features in the data, suggest that TP-AGB stars dominate these spectral features. However, a contribution from other evolved stars is also likely. Comparison with evolutionary population synthesis models shows that models based on empirical libraries that predict relatively strong NIR features provide a more accurate description of the data. However, none of the models tested accurately reproduces all of the features observed in the spectra. To do so, the models will need to not only improve the treatment of TP-AGB stars, but also include good quality spectra of red giant and E-AGB stars. The uninterrupted wavelength coverage, high S/N, and quantity of features we present here will provide a benchmark for the next generation of models aiming to explain and predict the NIR properties of galaxies.
keywords:
galaxies: bulges — galaxies: active — galaxies: stellar content — stars: AGB and post-AGB1 Introduction
Studying the unresolved stellar content of galaxies generally involves disentangling the various components contributing to the spectral energy distribution (SED), fitting a combination of simple stellar populations (SSPs) to derive information about age, metallicity, and star formation history. In the near-infrared (NIR, 0.85-2.5m), the thermally pulsing asymptotic giant branch (TP-AGB) phase – the last stage of the evolution of intermediate mass stars (M6M) – is a particularly important component of the SSP models. These stars may be able to dominate the emission of stellar populations with ages 0.2 - 2 Gyr (Maraston, 2005, see also Mouhcine & Lançon (2002) and Dottori et al. (2005)) being responsible for roughly half of the luminosity in the K-band (Salaris et al., 2014).
Unfortunately, a correct treatment of the TP-AGB phase is difficult to achieve, since the physics of the evolution of this stellar phase is still poorly known (Maraston, 2005; Marigo et al., 2008; Conroy & Gunn, 2010; Conroy et al., 2013; Kriek et al., 2010; Zibetti et al., 2013; Noël et al., 2013). The complex processes occurring during this phase (mass-loss, changing opacities, dredge-up events, etc.) are difficult to accurately model, and must be anchored with empirical calibrations (e.g. Marigo et al., 2008). The contribution of a population of TP-AGB stars to the light of a galaxy also depends on the duration of this evolutionary stage, which is not yet well constrained. In addition, the features of an observed spectrum of a TP-AGB star depend strongly on its age and metallicity (e.g. Lançon et al., 2001), and we do not have NIR empirical spectra of stars covering the full range of these parameters expected in galaxies.
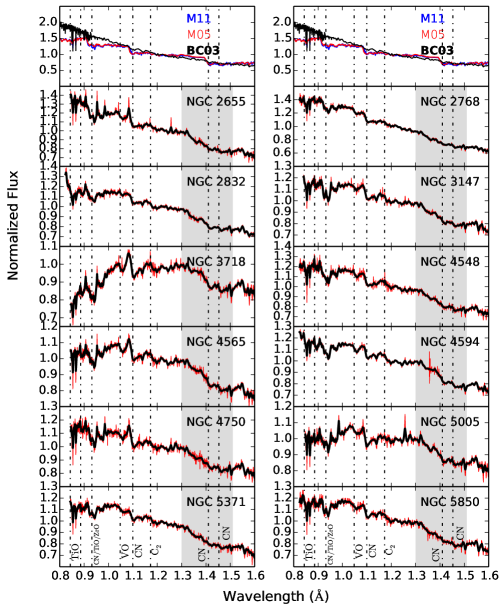
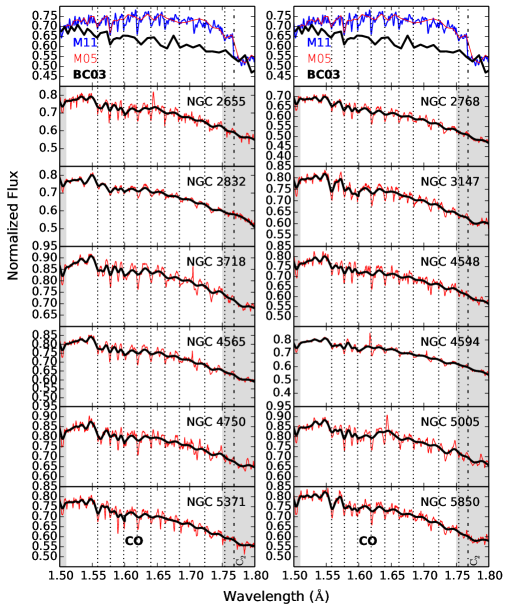
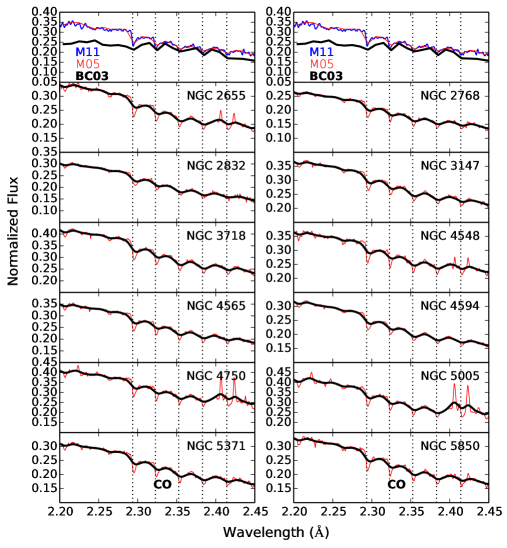
These difficulties have led to the production of models making very different predictions for the NIR spectral region. In contrast to Evolutionary Population Synthesis (EPS) models based on isochrone synthesis, such as those of Bruzual & Charlot (2003, hereafter BC03), the models of Maraston (2005) and Maraston & Strömbäck (2011, hereafter M05 and M11), based on the fuel consumption theory and using empirical spectra of C- and O-Rich stars for the TP-AGB phase, predict the presence of strong NIR molecular features, such as TiO (0.843 m, 0.886 m), CN (1.1 m, 1.4 m), C2 (1.17 m, 1.76 m), H2O (1.4 m, 1.9 m) and CO (1.6 m, 2.3 m) at the ages where these stars are abundant. When applied to galaxy spectra, the M05 models also predict much higher NIR luminosities than the BC03 ones (Maraston et al., 2006). The models are calibrated using Galactic and Magellanic Cloud globular clusters, and have been tested against a variety of astronomical data sets, with somewhat mixed results (Maraston et al., 2006; Riffel et al., 2011b; Lyubenova et al., 2010; Kriek et al., 2010; Lyubenova et al., 2012; Melbourne et al., 2012; Zibetti et al., 2013; Marigo, 2014).
Given the challenges involved in constructing SSPs appropriate to modeling galaxy SEDs based solely on theoretical stellar spectra and/or limited empirical stellar spectra, searches for these bands in galaxies would be a valuable step forward in guiding the development and improvement of the models. Some studies have been carried out in this area. The 1.1 m CN band, for example, has been detected in AGN and starburst galaxies (Riffel et al., 2007; Ramos Almeida et al., 2009), along with the 1.4 m CN band in a single object (Martins et al., 2013b). The CO bandheads near 2.3 m are well known, and the first detection of ZrO features at 0.8 - 1.0 m was recently reported in a sample of starburst nuclei (Martins et al., 2013b). Conversely, Zibetti et al. (2013) do not detect the TP-AGB spectral features predicted by M05 in their spectra of post-starburst galaxies at z0.2.
Here we investigate the origin of the stellar molecular absorption features in NIR spectra of 12 nearby galaxies, and use the spectra to test two current EPS models. The detected bands include CN (1.1 m, 1.4 m), CO (1.6 m, 2.3 m), H2O (1.4 m, 1.9 m), VO (1.048 m) and TiO (0.843 m, 0.886 m). We also detect a feature at 0.93 m which is probably due to a blend of CN, TiO, and ZrO bands. A tentative detection of a C2 (1.76 m) bandhead in the mean spectrum of the whole sample is also reported. While some of these bands have been discussed in previous work, the novelty of this study is the simultaneous detection and analysis of many features over a wide range of wavelengths.
2 Sample and Data
2.1 The Sample
The galaxies in this paper (Table 1) are a subset of those observed for the Palomar XD project (Mason et al., 2015). That program acquired high-quality nuclear NIR spectra of galaxies in the Palomar survey of nearby galaxies (Ho et al., 1995, 1997), using the Gemini Near-Infrared Spectrograph (GNIRS) on the Gemini North telescope (Elias et al., 2006) . The GNIRS sample contains AGNs covering a wide range of luminosity and accretion rate. Of these, a subsample was selected for this study on the basis of high signal-to-noise ratio (S/N) data, strong stellar continuum, weak AGN emission, and excellent cancellation of the strong telluric absorption coincident with the location of the CN and H2O bands around 1.4 m. While some molecular bands are evident in the remaining 38 objects (Mason et al., 2015), we restrict this discussion to the 12 galaxies with the highest-quality data.
It is important to realize that these are not necessarily the galaxies where features due to TP-AGB stars would be expected to be the strongest. That is, no selection due to stellar population properties was made. The galaxies are simply those in which the data permit a close examination of the various bands that have been suggested to be signatures of TP-AGB stars. As shown in Table 1, with the exception of NGC 2832 and NGC 2768, all of the galaxies are spirals. Optical stellar population studies have been carried out for several of the galaxies, and in most cases old ages are suggested (Table 1). Possible exceptions are NGC 2655, NGC 2768, and NGC 5005. The H line index in NGC2655 suggests a mean age of 2 Gyr (Sil’chenko, 2006), while studies disagree about whether old (Sil’chenko, 2006; Zhang et al., 2008) or intermediate-age (Serra et al., 2008; Crocker et al., 2008) stars dominate in NGC 2768. In NGC 5005, Cid Fernandes et al. (2004a) find that an intermediate-age stellar population contributes about 45% of the nuclear optical light.
Inter-comparing stellar ages obtained from different spectral regions, apertures, and line indices/stellar population models can be highly problematic. Nonetheless we use this information in §4, in which we draw some tentative conclusions about the type of stars causing the molecular absorption features observed in this galaxy sample.
2.2 The data
The spectra were obtained using GNIRS’ cross-dispersed mode, which provides simultaneous spectral coverage from 0.8-2.5 m. The 0.3″ slit was used, providing R1200, and was orientated at the mean parallactic angle at the time of the observations. The observations were executed in queue mode (Programs GN-2012B-Q-80, GN-2013A-Q-16) and the observing condition criteria allowed for observations to be taken with thin cirrus and seeing 1″. The data were reduced using standard procedures, described in Mason et al. (2015).
Some stellar features of interest are located in regions of poor atmospheric transmission, in which the telluric cancellation process (dividing by a slightly shifted and scaled spectrum of an A star observed near in time and airmass) may leave artefacts in the spectrum. For instance, the 0.93 m feature lies close to telluric H2O absorption at 0.95 m. The authenticity of this feature was verified in two ways. First, the shifting and scaling applied to the standard star were adjusted, while verifying that the strength and profile of the feature were not significantly affected. Second, a standard star spectrum was reduced using the same procedure applied to the galaxies, showing that no similar feature was produced in the resulting spectrum (Fig. 1). A similar procedure was applied to the H2O absorption regions, indicating that the broad H2O bands apparent in some objects are not artefacts of the data reduction but true stellar features.
| Galaxy | Distancea | Morphologya | AGNa | log a | Age (ref)b | Aperturec | SNRd |
|---|---|---|---|---|---|---|---|
| Mpc | erg s-1 | pc | |||||
| NGC 2655 | 24.4 | Sa | S2 | 39.55 | I (1) | 2782 | 118 |
| NGC 2768 | 23.7 | S0/E6 | L2 | 39.01 | I (1,2), O (3,4) | 2780 | 121 |
| NGC 2832 | 91.6 | E3 | L2 | 38.91 | O (2,5) | 135404 | 160 |
| NGC 3147 | 40.9 | S(s)b I-II | S2 | 39.47 | O (6) | 54163 | 132 |
| NGC 3718 | 17.0 | Sa | L1.9 | 38.46 | – | 1958 | 123 |
| NGC 4548 | 16.8 | SB(sr)b I-II | L2 | 38.46 | O (7) | 928 | 110 |
| NGC 4565 | 9.7 | Sb | S1.9 | 37.97 | – | 2473 | 100 |
| NGC 4594 | 20.0 | Sab | L2 | 39.70 | O (8) | 2163 | 168 |
| NGC 4750 | 26.1 | S(r) | L1.9 | 39.04 | – | 3194 | 119 |
| NGC 5005 | 21.3 | S(s)b II | L1.9 | 39.47 | I/O (9) | 1956 | 119 |
| NGC 5371 | 37.8 | SB(sr)b I | L2 | 39.24 | – | 50149 | 100 |
| NGC 5850 | 28.5 | SB(rs)b I-II | L2 | 38.66 | O (10) | 50149 | 100 |
-
(a) Ho et al. (1997) and references therein. (b) Stellar population age. O = old, age 5 Gyr. I = intermediate-age, age 1-2 Gyr. References: 1- Sil’chenko (2006). 2- Zhang et al. (2008) 3- Serra et al. (2008). 4- Crocker et al. (2008). 5- Loubser et al. (2009). 6- Bruzual & Charlot (2003). 7- Sarzi et al. (2005). 8- Sánchez-Blázquez et al. (2006). 9- Cid Fernandes et al. (2004b). 10- de Lorenzo-Cáceres et al. (2013) (c) Slit width extraction aperture of 0″.3 0″.9. (d) Determined in the range 2.076-2.096 m.
3 Results
3.1 The Spectral Features
The full set of spectra is shown in Figure 1, while Figures 2 - 4 show close-ups of various regions of interest. As can be seen from these figures (see also Fig. 6), the CN (1.1 m, 1.4 m) and CO (1.6 m, 2.3 m) bands are clearly detected in the majority of sources. While the 1.1 m CN band is known in a number of galaxies (Riffel et al., 2007), the CN band at 1.4 m has to date only been detected in NGC 4102 (Martins et al., 2013a). The CN 1.4 m band falls in a region of poor atmospheric transmission and is therefore difficult to detect in low-redshift extragalactic sources. Thanks to the dry conditions under which these data were obtained, however, we detect the 1.4 m CN band in almost all the galaxies of the present sample. According to M05, these bands are strong in TP-AGB stars, whose contribution to the integrated light peaks at intermediate ages.
The H2O 1.4 m band is also detected in almost all sources, while the 1.8 m band is visible only in some (NGC 2655, NGC 2768, NGC 3147, NGC 4548, NGC 5850). C2 lines are weak or absent in the individual galaxy spectra but the 1.76 m band may show up in the mean spectrum (see Fig. 5). These features are present in the IRTF atlas of cool stars ( see Fig. 7 to 34 of Rayner et al., 2009, see also Cushing et al. (2005)), and are also predicted by M05 (their Figures 14 and 15).
A comparison of the GNIRS spectra with the IRTF library shows that, besides the bands predicted by the M05 models, we also detect a VO feature at 1.048 m. A comparison of our Fig. 1 with Fig. 8 of Rayner et al. (2009) shows that the VO band at 1.048 m, detected in many of the galaxies in our sample, most likely originate in late M III stars in the TP-AGB phase. To our knowledge, this is the first time that these bands have been reported in galaxies. A broad feature ranging between 0.93 – 0.95 m is also detected, but the identity of the carrier is uncertain. The feature may be due to a combination of CN (red system, ), TiO ( system, ), and ZrO, which are all strong in the spectra of cool giant stars (Rayner et al., 2009). The 0.886 m band due to the system of TiO () is detected in some of the spectra (NGC 2832, NGC 4594, and perhaps others). Depending on the spectral coverage, the 0.843 m bandheads of the system of TiO are also detected in those objects, blended with the well-known Calcium triplet lines.
We have measured the equivalent widths (EW) of the strongest molecular bands, including the 0.93 m CN/TiO/ZrO and 1.048 m VO bands that are particularly relevant to TP-AGB stars. The measurements were performed using an updated version of the pacce code (Riffel & Vale, 2011). In this code, the continuum uncertainty is taken as the root mean squere of the difference between the linear fit to the pseudo continuum and the observed one. Then a Gaussian distribution of errors, using the above difference as 1-sigma standard deviation, is assumed to simulate new pseudo-continua. Finally, EW uncertainties are assumed to be the standard deviation of 500 measurements of EW using the simulated pseudo continua as continuum points for the linear fit. The line definitions used are listed in Table 2 and the measured values are in Table 3.
As the spectra of the 12 galaxies have rather similar continuum and emission line properties (see Fig. 1), we averaged them to construct a spectrum with very high S/N, allowing further verification that the detected features are real. The spectra were normalized to unity at 1.223 m before computing the mean value of the fluxes, pixel-by-pixel. The resulting spectrum (Fig. 5) supports the conclusion that the features observed in the individual galaxies are real, since they clearly appear in the mean spectrum. As the galaxies are at different redshifts, when they are shifted to the rest frame to create the mean spectrum, any systematic effects are shifted to different positions and will therefore tend to cancel out or be weakened in the mean spectrum. Additionally, (i) reducing a standard star using the same procedures results in a very clean spectrum with few weak telluric line residuals (§2), and (ii) we can fit the observed mean absorption spectrum very well using the IRTF stellar library (§4), thus indicating that the features are real and due to stars.
| ID | line limits | continuum bandpass |
|---|---|---|
| (m) | (m) | |
| CN/TiO/ZrO | 0.9200-0.9500 | 0.8760-0.8800,0.9570-0.9650 |
| VO | 1.0470-1.0650 | 1.0350-10390, 1.0660-1.0740 |
| CN11 () | 1.0900-1.1300 | 1.0660-10740,1.1310-1.1360 |
| CN14a | 1.4050-1.4300 | 1.3950-13990, 1.4340-1.4390, 1.4750-1.4840 |
| CN14b | 1.4500-1.4715 | 1.3950-13990, 1.4340-1.4390, 1.4750-1.4840 |
| CO16a | 1.5735-1.5810 | 1.5110-15170, 1.5390-1.5410, 1.6270-1.6310, 1.6570-1.6580 |
| CO16b() | 1.6175-1.6285 | 1.5110-15170, 1.5390-1.5410, 1.6270-1.6310, 1.6570-1.6580 |
| CO22a() | 2.2910-2.3200 | 2.2690-22790, 2.3950-2.3999 |
| CO22b() | 2.3200-2.3420 | 2.2690-22790, 2.3950-2.3999 |
| CO22c() | 2.3420-2.3695 | 2.2690-22790, 2.3950-2.3999 |
| Galaxy | CN/TiO/ZrO | VO | CN11 | CN14a | CN14b | CO16a | CO16b | CO23a | CO23b | CO23c |
|---|---|---|---|---|---|---|---|---|---|---|
| NGC 2655 | 20.200.50 | 3.660.37 | 12.060.52 | 8.310.50 | 4.710.34 | 4.120.13 | 6.840.19 | 23.310.24 | 22.600.30 | 29.830.42 |
| NGC 2768 | 17.230.53 | 3.750.24 | 11.140.46 | 5.090.58 | 5.880.37 | 3.230.07 | 6.450.11 | 23.970.27 | 22.610.22 | 30.420.33 |
| NGC 2832 | 16.160.49 | 2.170.35 | 11.240.51 | 8.880.34 | 5.000.27 | 4.300.10 | 4.850.27 | 21.590.43 | 21.240.43 | 30.630.68 |
| NGC 3147 | 23.800.41 | 3.230.46 | 9.450.51 | 6.680.42 | 3.620.38 | 2.390.08 | 5.870.16 | 18.920.21 | 17.440.29 | 24.180.40 |
| NGC 3718 | 18.340.58 | 4.920.32 | 9.070.61 | 8.220.49 | 4.920.39 | 3.370.09 | 6.280.19 | 22.360.33 | 20.580.26 | 27.900.37 |
| NGC 4548 | 22.580.75 | 3.940.45 | 10.491.15 | 6.330.70 | 4.740.47 | 3.330.10 | 6.900.17 | 20.330.25 | 18.770.25 | 25.970.36 |
| NGC 4565 | 16.610.44 | 3.430.24 | 9.010.49 | 7.630.49 | 4.160.31 | 3.640.08 | 6.660.17 | 21.980.25 | 20.940.24 | 28.450.42 |
| NGC 4594 | 20.070.40 | 4.810.24 | 8.070.40 | 10.431.02 | 3.740.37 | 3.410.07 | 3.680.16 | 23.800.16 | 22.130.16 | 30.860.32 |
| NGC 4750 | 16.440.61 | 3.980.40 | 8.320.56 | 5.370.55 | 4.430.33 | 1.960.08 | 6.410.15 | 20.860.28 | 20.610.30 | 26.450.48 |
| NGC 5005 | 11.860.41 | 1.700.32 | 10.520.53 | 7.930.23 | 3.390.27 | 4.280.08 | 6.150.13 | 22.800.22 | 23.160.26 | 30.060.48 |
| NGC 5371 | 16.800.48 | 1.750.34 | 7.260.67 | 4.840.38 | 3.810.35 | 1.940.12 | 6.410.21 | 22.650.25 | 20.620.28 | 28.820.44 |
| NGC 5850 | 18.450.51 | 3.110.39 | 10.060.66 | 3.850.44 | 3.870.31 | 3.070.09 | 6.720.14 | 22.580.30 | 21.940.26 | 29.150.34 |
3.2 Stellar population synthesis
Bands from carbon-containing molecules are present in the galaxy spectra in Fig. 1, along with VO and possibly a contribution from ZrO in the band at 0.93 m. The presence of these molecules suggests a significant contribution from TP-AGB stars to the NIR spectra of the galaxies. To further investigate (1) whether these molecular bands really are due to TP-AGB stars, and (2) whether the available stellar population synthesis models are able to reproduce them, we carry out a stellar population synthesis on the mean spectrum using the starlight spectral synthesis code (Cid Fernandes et al., 2004a, 2005a, 2005b; Asari et al., 2007). The procedures followed are described in Riffel et al. (2009) and Dametto et al. (2014), including, for example, the methods used to handle extinction, emission lines and differences in spectral resolution. Briefly, starlight fits an observed spectum with a combination, in different proportions, of SSPs, solving the equation:
| (1) |
where is a model spectrum, is the reddened spectrum of the th SSP normalised at ; is the reddening term; is the theoretical flux at the normalisation wavelength; is the population vector, and is the Gaussian distribution used to model the line-of-sight stellar motions, which is centred at velocity with dispersion . The final fit is carried out searching for the minimum of the equation:
| (2) |
where emission lines and spurious features are masked out by fixing =0. The quality of the fit is accessed by wich is the given by equation 2 divided by the number of points used in the fit and by , which is the percentage mean deviation over all fitted pixels. For a detailed description of starlight see its manual111http://astro.ufsc.br/starlight/. For applications in the optical see Cid Fernandes et al. (2005a), and in the NIR see Riffel et al. (2009).
We use 4 different approaches to define the base set of spectra used by the code, as follows: i) stars approach: a base composed of all the 210 dereddened stars (spectral types F–S/C, F being the hottest available) in the IRTF spectral library (Rayner et al., 2009; Cushing et al., 2005) and ii) stars no TP-AGB approach: the same as in (i) but removing all the TP-AGB stars from the base. iii) M11 approach: EPS models of M11 (an example of models including empirical spectra of C- and O-Rich TP-AGB stars), which consist of theoretical SSPs covering 12 ages ( 0.01,0.03, 0.05, 0.1, 0.3, 0.5, 0.7, 1, 2, 5, 9 and 13 Gyr) at solar metallicity; iv) BC03 approach: SSPs from BC03 (an example of models calibrated with broad band photometry) with the same ages and metallicity as above.
4 Discussion
4.1 Origin of the features
To link the molecular absorption features to the kind of star in which they may arise, we first revisit some relevant aspects of the later stages of stellar evolution.
Once the helium in the core of a star is exhausted, He burning begins in a shell surrounding the core. This marks the arrival of the star on the asymptotic giant branch (AGB). The star starts to expand, becoming cool and luminous, and develops a growing convective outer region. At this stage the second dredge-up occurs, mixing the end points of helium burning, mainly C and O, into the star’s atmosphere. At the end of this phase the s process becomes the dominant mechanism of nuclear fusion, producing elements such as Zr and V (Habing & Olofsson, 2004).
The star then starts to undergo thermal pulses, leaving the E-AGB stage and entering the TP-AGB phase. The third dredge-up takes place, and processed material from the star’s interior is transported into its atmosphere. At this point the spectrum of the star will present evidence of enhanced C and O abundance, along with features due to species containing the newly-formed Zr and V (Habing & Olofsson, 2004). For example, the NIR CN absorption band is particularly enhanced in carbon stars, where there is residual carbon that is not bound with oxygen in CO molecules. As N type carbon stars are produced after the third convective dredge-up along the TP-AGB phase (Habing & Olofsson, 2004), the detection of deep CN features may indicate stellar populations rich in this kind of star (Lançon et al., 2001; Riffel et al., 2007). Similarly, VO and ZrO are produced with the residual oxygen not used in the formation of CO and TiO. Since V and Zr are only produced by the s process, these features are normally only detected in TP-AGB stars.
Below, we relate the spectral features in the galaxies to those observed in various kinds of star. It is therefore necessary to understand the stellar characteristics (spectral types and other traits) that identify a star as being in the TP-AGB phase. Most AGB stars have spectral classes M, S, and C (Habing & Olofsson, 2004). Of the two main types of carbon star, C-N stars are in the TP-AGB phase while C-R stars are not. All the molecular bands in C stars are from carbon-containing molecules. The spectra of early M-type stars contain TiO bands, while VO becomes apparent at later spectral types. S stars, however, are characterized by distinctive ZrO absorption. As noted above, s-process elements such as Zr and V are normally only present in AGB stars in the thermally-pulsing stage.
TP-AGB stars can also be distinguished by the variability caused by their long-period pulsations. The stellar library of Rayner et al. (2009) includes several IR spectra of TP-AGB stars, identified by their characteristic variability types (irregular, semi-regular, and Mira), and their data illustrate the above trends. Inspecting their series of dwarf, giant and supergiant spectra (their Figures 7, 8, and 9) shows that the only molecular features detected in the dwarf stars are TiO, CO, H2O and FeH. CN bands are present in the giants and supergiants, but are most prominent in the late-type supergiants with TP-AGB-like variability characteristics (the K1 Ia-Iab, K5 Ib, M3 Iab-Ia, and M5 Ib-II stars in their Figure 9). ZrO also becomes prominent in the coolest of the TP-AGB supergiants in that figure. In the latest-type of the TP-AGB giants (M4 III, M6 III, M7 III, and M8-9 III in Figure 8 of Rayner et al. 2009), absorption from the VO molecule becomes apparent.
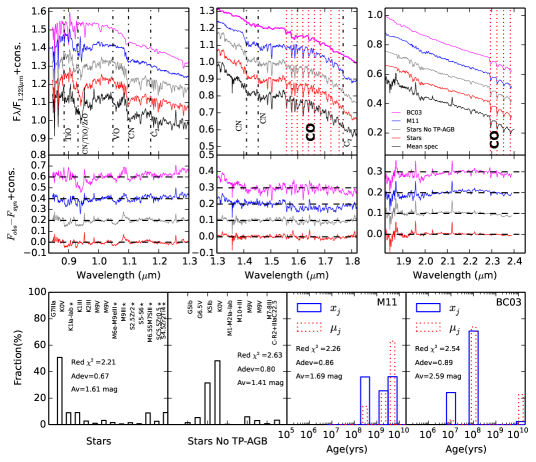
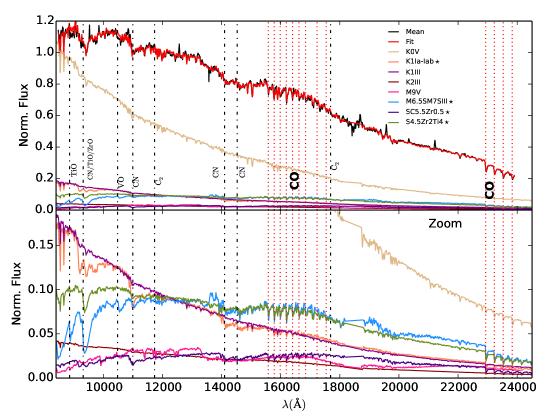
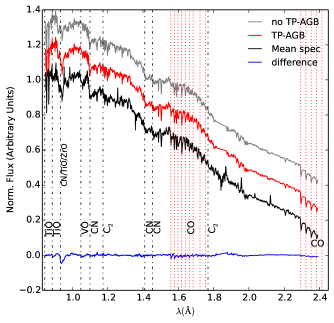
The results of the stellar population synthesis are shown in Figure 5. When using the stars approach the spectrum can be well reproduced, and a significant fraction ( 35%) of the light comes from TP-AGB stars (the stars marked with in the lower left panel of the figure).This is illustrated by Figure 6, which shows that these stars account for the molecular features particularly at the short wavelength end of the spectrum. However, when the TP-AGB stars are removed, the code replaces them with a variety of E-AGB and red giant stars, notably a large contribution from a K5Ib star and a significant contribution from a C-R type carbon star. The quality of the fit is similar overall, with just a small increase in the and 222The percentage mean deviation over all fitted pixels. values.
Taken at face value, this would suggest a degeneracy between R-type carbon rich stars summed with E-AGB stars, and the TP-AGB stars. However, there are two important details that have to be taken into account. First, we are trying to fit a galaxy’s stellar population with the observed spectra of stars from a library which is neither complete nor absolutely flux-calibrated, and most importantly, not constrained by the rules of stellar evolution, which would require the use of an isochrone and an assumption about the initial mass function.This would be the correct approach to create an SSP333Which are the correct inputs for the base of elements in stellar population fitting using the starlight code., where the contribution of each stellar spectral type is weighted by the number and luminosity of the stars. This is a large task in its own right and is well beyond the scope of this paper. This means that although we can reproduce the mean spectrum with both approaches, the results need to be taken with caution. AGB and regular giant stars are short-lived, and their true contribution to a stellar population spectrum of a given age cannot be determined by the approaches we described here.
With that said, TP-AGB stars are very luminous. Despite the fact that they exist only in population components with ages 0.2 - 2 Gyr (M05), they have been shown to account for almost 20% of the 1.6 m flux of nearby galaxies (Melbourne et al., 2012), with much of the remainder likely coming from relatively featureless main sequence stars. In the K-band they may be responsible for roughly half the total luminosity (Salaris et al., 2014). Such luminous stars, with strong absorption features, may be expected to leave an imprint on the NIR spectrum. Also, there is a subtle difference between the two fits in the absorption band at 0.93 m (see Fig. 7). As noted above, this band probably contains contributions from CN, TiO, and ZrO. The fit in this region is improved when TP-AGB stars are included, suggesting that some of the absorption indeed comes from the Zr brought to the surface by the third dredge-up. Combined with the fact that VO is present in the galaxies’ spectra (see Fig. 6, these considerations suggest that TP-AGB stars play a significant role in the features observed in our integrated spectra444We note that the VO feature near 1.05 m is not well reproduced by either the models or the stellar library. The absence of the feature in the model spectra is not surprising, as they do not include the VO molecule. Its weakness in the empirical fit may be a result of incompleteness of the stellar library or the fact we are not constraining it by the rules of stellar evolution. A definite conclusion will require more detailed analysis, and is left for a future paper (R. Riffel et al in preparation).
If TP-AGB stars dominate the NIR spectral features, we might expect to observe stronger features in intermediate-age galaxies that should host larger populations of these stars. This is not obviously the case in this sample. The spectra in Figure 1 are remarkably similar, and there is no clear relationship between the EW values in Table 3 and whether a galaxy is classified as intermediate-age or old in Table 1. Of the galaxies in this sample, NGC 5005 has probably the most secure evidence for a large intermediate-age (45%) stellar population (Cid Fernandes et al., 2004b). Its CN/TiO/ZrO and VO bands, however, are the weakest that we observe (Table 3). Similarly, Mason et al. (2015) examined three galaxies with intermediate-age populations and found them to have weaker molecular absorption bands than older galaxies.
There are several possible reasons for this apparent contradiction. First, stellar populations derived from optical and NIR spectroscopy cannot necessarily be directly compared. Dust can obscure young populations in the optical, and different slit sizes555That might be the case of NGC5005, since the slit used by Cid Fernandes et al. (2004b) is three times wider than ours, thus potentially sampling additional stellar populations. can probe different regions of spatially varied populations (Riffel et al., 2011c; Martins et al., 2013b). Second, the intermediate-age galaxies studied here and in Mason et al. (2015) likely span only limited range of metallicity. As the strength of TP-AGB spectral features depends greatly on their age and metallicity (M05), weak NIR features like those observed in NGC 5005 may not be a universal characteristic of intermediate-age galaxies. Third, intermediate-age galaxies may also contain young stellar populations, whose relatively featureless spectra may dilute the stronger bands of the TP-AGB stars.
Finally, as shown by our model fits, red giants, C-R and E-AGB stars can also produce most of the observed features sometimes attributed to TP-AGB stars. These stars may be important in stellar populations that are both younger than the intermediate-age populations in which TP-AGB stars are believed to be abundant (if R C-rich and E-AGB stars are present in large fractions), or in older populations (which contain large numbers of red giants). This clearly demonstrates that to accurately model a stellar population, all kinds of evolved stars need to be taken into account.
To date, the most targeted search for TP-AGB stars in galaxies is that of Zibetti et al. (2013). They obtained NIR (H and K-band) spectra of 16 post-starburst galaxies, selected partly for the CN (1.41 m) and C2 (1.77 m) bands to be redshifted out of strong telluric absorption (z0.2). Although the stellar ages (0.5 - 1.5 Gyr) of these galaxies correspond to the period of maximum contribution of TP-AGB stars to the integrated spectrum, the depth of absorption features from carbon molecules in these stars was found to be no more than a few per cent of the continuum. Extrapolating from our observations to predict the features expected in post-starburst galaxies is beyond the scope of this paper, but we note that the weak CN and C2 absorptions reported here would not be detected at the resolution (300 versus 1200) and S/N (30 vs 110 in the K band) of the Zibetti et al. (2013) data, and their spectral coverage does not include most of the other features that we report. It is therefore difficult to gauge whether our interpretation of the molecular features as dominated by TP-AGB stars is in conflict with the observations of Zibetti et al. (2013). However, it is clear that the features in the post-starburst galaxies are not as strong as predicted by the M05 models for galaxies of those ages and metallicities.
4.2 Performance of the models
The last two approaches tested in §3.2 (M11 approach and BC03 approach) are intended to show how well different SSP recipes are able to reproduce these features. Fitting the mean spectrum with the M11 models results in a complex star formation history, with similar fractions of young (t 1 Gyr), intermediate-age (t 1 Gyr) and old (t 10 Gyr) SSPs. With the BC03 models, though, starlight includes a young ( yr) component and requires only a very small fraction of old SSPs. This is probably because the BC03 models do not have deep NIR CN bands, causing the code to attempt to fit the 1.1 m CN band with Pa. If such a young component were genuinely present, we would expect to require a significant fraction of F stars (the hottest available in the IRTF library) when fitting the mean spectrum with the stellar library, which is not the case. Furthermore, if we remove the 100 Myr components in the BC03 approach, the best fit is achieved with 35% of the light due to the 1 Gyr and 65% due to the 2 Gyr components, but with a much poorer fit ( 100).
The high (65%) light fraction of stars with ages 0.2 – 3 109 yr in the M11 model fits ostensibly supports our previous interpretation that the molecular bands likely contain a strong contribution from TP-AGB stars, which should dominate the NIR emission of a stellar population of this age. However, this result could be coincidental: the M11 models include empirical spectra with good spectral resolution only for the TP-AGB stars, meaning only the intermediate age stellar population in their models will present these features. As discussed above, most of the features can be reproduced with a mix of E-AGB and R C-rich stars, which means older stellar populations probably also have these features at some level. To avoid misinterpreting NIR galaxy spectra, it is thus of great importance to include high quality empirical spectra of the other evolutionary phases in the EPS models.
While the M11 models qualitatively reproduce several of the broad absorption bands in the mean spectrum (notably CO and CN), these bands are weaker or absent in the BC03 model fit. This is probably not related to the different spectral resolution of the models (, vs in M11) because we find that similar results are obtained from the M11 and M05 models (the latter with in the K-band). The differences are more likely related to uncertainties in the theoretical treatment of AGB and TP-AGB stellar phases and the fact that the M05/M11 models include empirical spectra of C and O-rich stars and therefore better account for these features.
Since the relative band strengths depend on metallicity (M05), we also tried fitting the mean spectrum with BC03 and M05 models including three non-solar metallicities (the M11 models include only solar metallicity for this wavelength range). Similar ages to those derived from the original analysis were obtained in all cases, and changing the metallicity did not significantly improve the fits to the features. This may suggest that the incompleteness in stellar types/phases of the empirical spectra on which the models are based is the first order problem in reproducing the NIR absorption features. At this stage in the development of the models, metallicity probably plays a secondary role in predicting the strength of the features
5 Final Remarks
We have presented high-S/N, 0.85 – 2.5 m spectra of the nuclei of 12 local galaxies. The spectra show indications of numerous weak molecular absorption bands that arise in the atmospheres of cool stars. While several types of evolved stars can exhibit most of the detected features, we argue that the high luminosity of TP-AGB stars, and the fact that the spectra contain VO and likely ZrO, that are only expected in stars undergoing thermal pulses, imply that these features are the long-debated signatures of TP-AGB stars. However, a combination of R-type carbon rich stars and E-AGB stars should not be ruled out as an important contributor to these bands.
In testing two sets of stellar population synthesis models against these spectra, we found that models that include stars with relatively strong absorption bands provide a more accurate representation of the spectra. However, to avoid misinterpreting the data, future models must include high-quality spectra of C-R and E-AGB stars, along with those of TP-AGB stars. Testing the predictions of EPS models has to date been hampered by a lack of high-quality data againstwhich the models can be tested, and we hope that the high S/N and wavelength coverage of the spectra presented here will make them a useful aid to the development of such models. The reduced spectra presented here are available at: http://www.canfar.phys.uvic.ca/vosui/#/karun/xdgnirs_Dec2014/XD_final.
Acknowledgements
We thank the anonymous referee for useful comments. The Brazilian authors thank CNPq and FAPERGS support. RR acknowledges M. Cushing, L. Girardi, C. Maraston, A. Romero and R. P. Schiavon for helpful discussions as well as CNPq and FAPERGS for financial support. LCH acknowledges support by the Chinese Academy of Science through grant No. XDB09030102 (Emergence of Cosmological Structures) from the Strategic Priority Research Program and by the National Natural Science Foundation of China through grant No. 11473002. CRA is supported by a Marie Curie Intra European Fellowship within the 7th European Community Framework Programme (PIEF-GA-2012-327934). Based on observations obtained at the Gemini Observatory, operated by the Association of Universities for Research in Astronomy, Inc., under a cooperative agreement with the NSF on behalf of the Gemini partnership: the National Science Foundation (US), the Science and Technology Facilities Council (UK), the National Research Council (Canada), CONICYT (Chile), the Australian Research Council (Australia), Ministério da Ciência e Tecnologia (Brazil) and Ministerio de Ciencia, Tecnología e Innovación Productiva (Argentina).
References
- Alonso-Herrero et al. (2000) Alonso-Herrero, Almudena; Rieke, Marcia J.; Rieke, George H.; Shields, Joseph C., 2000, ApJ, 530, 688.
- Asari et al. (2007) Asari,N. V., Cid Fernandes, R., Stasińska, G., Torres-Papaqui, J. P., Mateus, A., Sodré, L., Schoenell, W., Gomes, J. M., 2007, MNRAS, 381, 263
- Bruzual & Charlot (2003) Bruzual G., Charlot S., 2003, MNRAS, 344, 1000
- Cid Fernandes et al. (2004a) Cid Fernandes, R., Gu, Q., Melnick, J., Terlevich, E., Terlevich, R., Kunth, D., Rodrigues Lacerda, R., Joguet, B., 2004, MNRAS, 355, 273
- Cid Fernandes et al. (2004b) Cid Fernandes, R.; González Delgado, R. M.; Schmitt, H.; Storchi-Bergmann, T.; Martins, L. P.; Pérez, E.; Heckman, T.; Leitherer, C.; Schaerer, D., 2004, ApJ,605,105.
- Cid Fernandes et al. (2005a) Cid Fernandes, R., Mateus, A., Sodré, Laerte, Stasińska, G., Gomes, J. M., 2005a, MNRAS, 358, 363
- Cid Fernandes et al. (2005b) Cid Fernandes, R., González Delgado, R. M., Storchi-Bergmann, T., Martins, L. Pires & Schmitt, H., 2005b, MNRAS, 356, 270
- Charlot et al. (1996) Charlot, Stephane; Worthey, Guy; Bressan, Alessandro, 1996, ApJ, 457, 625.
- Chisari & Kelson (2012) Chisari, Nora E.& Kelson, Daniel D., 2012, ApJ, 753, 94.
- Crocker et al. (2008) Crocker, A. F., Bureau, M., Young, L. M., Combes, F. 2008, MNRAS, 386, 1811
- Conroy & Gunn (2010) Conroy, Charlie; Gunn, James E., 2010, ApJ, 712, 833.
- Conroy et al. (2013) Conroy C., 2013, ARA&A, 51, 393.
- Cushing et al. (2005) Cushing, M.C. Rayner, J.T., & Vacca, W.D., ApJ, 2005, 623, 1115
- Dametto et al. (2014) Dametto, N. Z.; Riffel, R.; Pastoriza, M. G.; Rodríguez-Ardila, A.; Hernandez-Jimenez, J. A.; Carvalho, E. A., 2014, MNRAS, 443, 1754.
- de Lorenzo-Cáceres et al. (2013) de Lorenzo-Cáceres, A., Falcón-Barroso, J., Vazdekis, A. 2013, MNRAS, 431, 2397
- Dottori et al. (2005) Dottori, H.; Díaz, R. J.; Carranza, G.; Lípari, S.; Santos, J., Jr.
- Elias et al. (2006) Elias, Jonathan H.; Joyce, Richard R.; Liang, Ming; Muller, Gary P.; Hileman, Edward A.; George, James R., 2006, SPIE, 6269E,4CE.
- González Delgado (2004) González Delgado, Rosa M.; Cid Fernandes, Roberto; Pŕez, Enrique; Martins, Lucimara P.; Storchi-Bergmann, Thaisa; Schmitt, Henrique; Heckman, Timothy; Leitherer, Claus, 2004, ApJ, 605, 127.
- Girardi et al. (2013) Girardi, Léo; Marigo, Paola; Bressan, Alessandro; Rosenfield, Philip, 2013, ApJ, 777, 142
- Habing & Olofsson (2004) Habing, H. J & Olofsson, H., 2004, Springer, ISBN: 978-1-4419-1843-7
- Ho et al. (1995) Ho, L. C.; Filippenko, A. V.; Sargent, W. L., 1995, ApJS, 98, 477.
- Ho et al. (1997) Ho, L. C., Filippenko, A. V., & Sargent, W. L. W. 1997, APJS, 112, 31
- Ho (2008) Ho, L. C.,2008, ARA&A, 46, 475.
- Hunt et al. (2003) Hunt, L. K.; Thuan, T. X.; Izotov, Y. I., 2003, ApJ, 588, 281.
- Kelson & Holden (2010) Kelson, Daniel D.; Holden, Bradford P., 2010, ApJ, 713, 28.
- Kriek et al. (2010) Kriek et al., 2010, ApJ, 722L, 64.
- Kuntschner et al. (2010) Kuntschner et al., 2010, MNRAS, 408, 97.
- Lançon & Wood (2000) Lançon, A. & Wood, P. R.Goldader, 2000, A&AS, 146, 217.
- Lançon et al. (2001) Lançon, A., Goldader, J. D., Leitherer, C., & González Delgado, R. M., 2001, ApJ, 552, 150
- Lançon et al. (2007) A. Lançon, P. H. Hauschildt, D. Ladjal & M. Mouhcine, 2007, A&A, 468, 205.
- Loubser et al. (2009) Loubser, S. I., Sánchez-Blázquez, P., Sansom, A. E., Soechting, I. K. 2009, MNRAS, 398, 133
- Lyubenova et al. (2010) Lyubenova M., Kuntschner H., Rejkuba M., Silva D. R., Kissler-Patig M., Tacconi-Garman L. E., Larsen S. S., 2010, A&A, 510, A19
- Lyubenova et al. (2012) Lyubenova M., Kuntschner H., Rejkuba M., Silva D. R., Kissler-Patig M., Tacconi-Garman L. E., 2012, A&A, 543, A75
- Mason et al. (2015) Mason, R. E. et al., 2015, ApJS, 217, 13.
- Maraston (2005) Maraston, C., 2005, MNRAS, 362, 799.
- Maraston et al. (2006) Maraston, C.; Daddi, E.; Renzini, A.; Cimatti, A.; Dickinson, M.; Papovich, C.; Pasquali, A.; Pirzkal, N., 2006, ApJ, 652, 85.
- Maraston & Strömbäck (2011) Maraston, C. & Strömbäck, G., 2011, MNRAS, 418, 2785.
- Marigo et al. (2008) Marigo P., Girardi L., Bressan A., Groenewegen M. A. T., Silva L., Granato G. L., 2008, A&ASS, 482, 883.
- Marigo (2014) Marigo P., 2014, arXiv:1411.3126
- Martins et al. (2010) Martins, Lucimara P.; Riffel, Rogério; Rodríguez-Ardila, Alberto; Gruenwald, Ruth; de Souza, Ronaldo, 2010, MNRAS, 406, 2185
- Martins et al. (2013a) Martins, Lucimara P.; Rodríguez-Ardila, Alberto; Diniz, Suzi; Gruenwald, Ruth; de Souza, Ronaldo, 2013, MNRAS, 431, 1823.
- Martins et al. (2013b) Martins, Lucimara P.; Rodríguez-Ardila, Alberto; Diniz, Suzi; Riffel, Rogério; de Souza, Ronaldo, 2013, MNRAS, tmp, 2233
- Melbourne et al. (2012) Melbourne, J.; Williams, Benjamin F.; Dalcanton, Julianne J.; Rosenfield, Philip; Girardi, Leo; Marigo, P.; Weisz, D.; Dolphin, A.; Boyer, Martha L.; Olsen, Knut; Skillman, E.; Seth, Anil C., 2012, ApJ, 748, 47
- Mouhcine & Lançon (2002) Mouhcine, M. & Lançon, A., 2002, A&A, 393, 149.
- Moorwood & Glass (1982) Moorwood, A. F. M.; Glass, I. S., 1982, A&A, 115, 84
- Noël et al. (2013) Noël, N. E. D.; Greggio, L.; Renzini, A.; Carollo, C. M.; Maraston, C., 2013, ApJ, 772, 58
- Proctor et al. (2000) Proctor, R. N., Sansom, A. E., & Reid, I. N. 2000, MNRAS, 311,37
- Ramos Almeida et al. (2009) Ramos Almeida, C.; Pérez García, A. M.; Acosta-Pulido, J. A., 2009, ApJ, 694, 1379.
- Ramos Almeida et al. (2006) Ramos Almeida, C.; Pérez García,, A. M.; Acosta-Pulido, J. A.; Rodríguez Espinosa, J. M.; Barrena, R.; Manchado, A., 2006, ApJ, 645, 148
- Rieke et al. (1980) Rieke, G. H., Lebofsky, M. J., Thompson, R. I., Low, F. J., Tokunaga, A. T., 1980, ApJ, 238, 24
- Riffel et al. (2007) Riffel R., Pastoriza M. G., RodrŽıguez-Ardila A., Maraston C., 2007, ApJ, 659, L103
- Riffel et al. (2008) Riffel, R., Pastoriza, M. G., Rodríguez-Ardila, A. & C. Maraston, 2008b, MNRAS, 388, 803.
- Riffel et al. (2009) Riffel, R.; Pastoriza, M. G.; Rodríguez-Ardila, A.; Bonatto, C., 2009, MNRAS, 400, 273
- Riffel et al. (2010) Riffel, Rogemar A.; Storchi-Bergmann, Thaisa; Riffel, Rogério; Pastoriza, Miriani G., 2010, ApJ, 713, 469.
- Riffel & Vale (2011) Riffel, R. & Vale, T. B., 2011, Ap&SS,334,351.
- Riffel et al. (2011a) Riffel, Rogŕio; Riffel, Rogemar A.; Ferrari, Fabricio; Storchi-Bergmann, Thaisa, 2011a,MNRAS, 416, 493.
- Riffel et al. (2011b) Riffel, R.; Ruschel-Dutra, D.; Pastoriza, M. G.; RodrÃguez-Ardila, A.; Santos, J. F. C., Jr.; Bonatto, C. J.; Ducati, J. R., 2011b, MNRAS, 410m 2714.
- Riffel et al. (2011c) Riffel, R.; Bonatto, C.; Cid Fernandes, R.; Pastoriza, M. G.; Balbinot, E., 2011c, MNRAS, 411, 1897
- Rayner et al. (2009) Rayner, J.T., Cushing, M.C., & Vacca, W.D., 2009, ApJS, 185, 289
- Salaris et al. (2014) Salaris, M.; Weiss, A.; Cassarà, L. P.; Piovan, L.; Chiosi, C., 2014, A&A, 565.
- Sánchez-Blázquez et al. (2006) Sánchez-Blázquez, P.; Gorgas, J.; Cardiel, N.; González, J. J., A&A, 457,809.
- Sarzi et al. (2005) Sarzi, M., Rix, H.-W., Shields, J. C., Ho, L. C., Barth, A. J.,Rudnick, G., Filippenko, A. V., Sargent, W. L. W. 2005, ApJ, 628, 169
- Serra et al. (2008) Serra, P., Trager, S. C., Oosterloo, T. A.,; Morganti, R. 2008, A&A, 483, 57
- Sil’chenko (2006) Sil’chenko, O. K., 2006,ApJ,641,229.
- Storchi-Bergmann et al. (2012) Storchi-Bergmann, Thaisa; Riffel, Rogemar A.; Riffel, Rogério; Diniz, Marlon R.; Borges Vale, Tibério; McGregor, Peter J., 2012, ApJ, 755, 87.
- Tonini et al. (2009) Tonini, Chiara; Maraston, Claudia; Devriendt, Julien; Thomas, Daniel; Silk, Joseph, 2009, MNRAS, 396, 36.
- van der Wel et al. (2006) van der Wel, A.; Franx, M.; Wuyts, S.; van Dokkum, P. G.; Huang, J.; Rix, H.-W.; Illingworth, G. D., 2006, ApJ, 652, 97
- Zhang et al. (2008) Zhang, Y.; Gu, Q.-S.; Ho, L. C., 2008, A&A, 487, 177.
- Zibetti et al. (2013) Zibetti, Stefano; Gallazzi, Anna; Charlot, Stéphane; Pierini, Daniele; Pasquali, Anna, 2013, MNRAS, 428, 1479.