Discovery of kpc-scale line emission in barred galaxies, not linked to AGN or star formation.
Abstract
We present an analysis of the optical line emission from nearby barred galaxies, and in particular look at the radial range occupied by the bar. In many cases this region is marked by what we term a ‘star formation desert’, with a marked deficit of HII regions in optical narrow-band H imaging. Here we present long-slit spectroscopy revealing that such regions do have line emission, but that it is low-level, spatially smooth and almost ubiquitous. The relative strengths of the H and the spectrally adjacent [NII] lines in the regions are completely discrepant from those associated with star formation regions, and more closely match expectations for ‘LINER’ regions. We quantify the total line emission from these extended, kpc-scale regions, and determine the spurious contribution it would make to the determined star formation rate of these galaxies if interpreted as normal H emission. We concur with previous studies that link this ‘LINER’ emission to old stellar populations, e.g. post-asymptotic giant branch stars, and propose these strongly-barred early-type spirals as a prime location for further tests of such emission.
keywords:
Galaxies : active - galaxies : spiral - galaxies : stellar content - galaxies : structure1 Introduction
Bars are a common feature of spiral galaxies, with near-IR imaging revealing that the majority have some bar structure in their central regions, while strong bars are seen in about one-third of spirals (Knapen et al., 2000; Marinova et al., 2007). They represent the most spectacular example of the complex interplay between stellar and gas kinematics in disk galaxies. They have been implicated in a wide range of evolutionary processes in galaxies, due principally to their being the strongest violation of axial symmetry in otherwise quiescent galaxies. This leads to strong gravitational torques, with consequent changes in the angular momentum of gas and stars that can drive rapid radial motion of material. Thus, bars have been implicated in radial migration and mixing of stars and gas in the outer disk, gas supply to central black holes to fuel AGN activity, and wholesale transport of material from disks to bulges, with (presumed) global increases in global star formation rates, causing ‘secular’ morphological evolution (Kormendy et al., 2004) on timescales of a few Gyr.
Much of the debate relating bars and star formation has concerned the evidence linking strong bars to the increases in the global star formation rate compared with unbarred galaxies with otherwise similar properties. Some studies have found evidence for such a link, with the early study of Heckman (1980) being confirmed by work using IRAS-based measurements of global star formation rates, e.g. Hawarden et al. (1986), Huang et al. (1996) and Aguerri (1999). However, this paper will focus on a little-discussed aspect of bars, which is their ability, in specific but important environments, to suppress star formation. This suppression was pointed out by Tubbs (1982), and explored observationally by the present authors in James et al. (2009), where we noted several strongly-barred galaxies that had strong dips in their radial H line emission profiles, in the radial range where their unbarred counterparts hosted their strongest star formation activity. In this paper, we explore this result in more detail using long-slit spectroscopy, and use these galaxies as probes of possible sources of line emission other than star formation, including ‘LINER-type’ emission and H emission from diffuse interstellar gas (DIG).
1.1 Effects of bars on patterns of star formation in galaxy disks


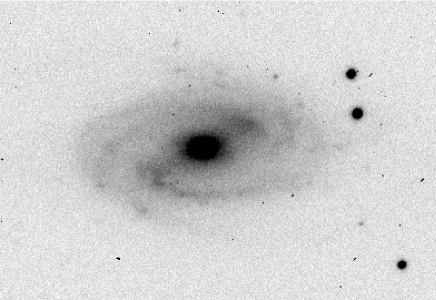
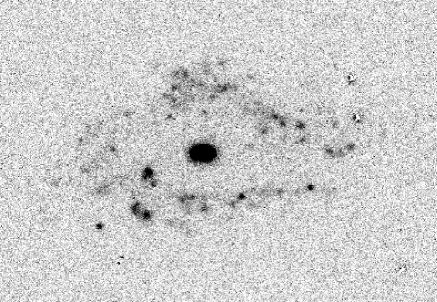
The initial motivation for the present study came from an analysis of the star formation properties of 200 barred and unbarred disk galaxies (James et al., 2009) using H imaging data from the HGS survey (James et al., 2004). Part of this analysis looked at the radial profiles of H [Nii] emission, averaged over all galaxies of a given Hubble type. This analysis uncovered a characteristic pattern in the SBb galaxies (and to some extent in SBbc and SBc galaxies), as shown in Fig. 1. The upper frame in this figure shows the average radial H profile for all SBb galaxies in the HGS sample, with no other imposed selection criteria. The vertical axis is the fraction of the total galaxy-wide emission-line flux contributed by annular regions; the horizontal axis is the radial size of each annular region, which is normalised by the -band 24 mag./sq.arcsec isophotal radius of the galaxy, R24, prior to averaging. Note that the values are not normalised by the area of each annulus, and hence differ from more frequently used surface brightness profiles. Figure 1 (upper frame) shows a characteristic dip in SF at intermediate radii. Figure 2 shows an example of one of the galaxies contributing to the mean SBb H profile, where the images shown are the -band light in the upper frame, and continuum-subtracted H (including the surrounding [NII] lines) in the lower. This illustrates clearly the reason for these distinctive profiles in the barred galaxies; the narrow-band H image shows strong emission both in a central peak, and within a ring lying just outside the ends of the bar (the bar itself is evident in the -band image, but not in line emission). Between these lies a region swept out by the bar which has greatly suppressed line emission, but that shows significant continuum emission in the -band, which we have termed the ‘star formation desert’, which will be abbreviated henceforth as ‘SFD’ where appropriate. This is the feature which we analyse in the present paper.
Note that this pattern of SF is not seen in unbarred early-type spiral galaxies. This is shown in the lower frame of Fig. 1, which is calculated in exactly the same way as the upper frame, but for galaxies classified as being unbarred. Here all galaxies of types Sab, Sb and Sbc have been included to give comparable numbers to the SBb profile, but otherwise no selection has been imposed in making this unbarred profile. The most interesting point in this comparison is that the ‘desert’ region in the SBb profiles matches very closely with the radial range (0.2–0.4 times the R24 isophotal radius) that makes the strongest contribution to the total star-formation activity in the unbarred galaxies.
Contrary to a popular view, the strong bulges of Sa-type galaxies are not elliptical-galaxy like regions, devoid of SF. In fact, in James et al. (2009), we showed that S0a and Sa galaxies had the most centrally-concentrated star formation of all spiral types, although the overall star formation rate per unit stellar is lower than in later-type spiral galaxies. So, these SF desert regions provide an unusually clean window to study the central few kpc of bright spiral galaxies, uncontaminated by emission lines from HII regions.
Fig. 1 (upper frame) shows that the dip in the mean emission line profile for SBb galaxies does not fall to zero emission-line flux, raising the question of how completely the bars suppress star formation; is this an artefact of averaging over multiple galaxy profiles, is there residual star formation in some or all of these barred galaxies, or is there some other explanation, unrelated to star formation, for this residual flux in these regions? This is one of several questions addressed in the present paper.
1.2 Sources of emission lines
In the context of the current paper, it is important to consider other possible sources of emission lines, apart from star formation. In the central region, AGN-type emission can dominate, powered by activity associated with a central super-massive black hole. This type of emission is generally quite cleanly distinguished from that associated with star formation, both by its spatial distribution, and by the very different line ratios resulting from the much harder ionising spectrum from AGN, resulting in line ratio diagnostics pioneered by Baldwin, Phillips, & Terlevich (1981). More problematic, and interesting from the perspective of the current paper, is the ‘LINER’ (for ‘Low Ionization Nuclear Emission-line Regions’) emission, first studied in detail by Heckman (1980). This emission has characteristically strong emission lines from low-ionisation states, including [OII]3727, [OI]6300, [NII]6548 & 6584 and [SII]6717 & 6731, relative to the Balmer emission lines including H 6563 and H 4861. Heckman (1980) interpreted the LINERs as a low-luminosity extrapolation of AGN, and this interpretation was explored in more detail by Dopita & Sutherland (1995), who modeled the line emission in these systems as shock-excited gas, powered either by AGN jets or accretion-driven flows. However, Stasińska et al. (2008) conclude, from a population synthesis study of 105 galaxies from the Sloan Digital Sky Survey (SDSS), that the majority of those showing LINER-type emission can be explained through purely stellar emission, on the assumption that these are post-starburst galaxies, termed ‘retired’ galaxies by Stasińska et al. (2008).
Other evidence for diffuse emission lines is found in the analysis of 11 spiral galaxies within 10 Mpc by Thilker et al. (2002). After excluding the emission from discrete regions of H [NII] emission, typically 45% of the total remains as a diffuse component, which they conclude is partially, but not completely, explained by the leakage of ionising photons from HII regions.
In a recent study, Bremer et al. (2013) find LINER-type emission over the central 4 kpc region of the strongly-barred nearby SBb galaxy NGC 5850. They follow Stasińska et al. (2008) in ascribing this emission to a purely stellar origin, and particularly post-Asymptotic Giant Branch (p-AGB) stars. However, NGC 5850 may have recently had a high-velocity encounter with the nearby elliptical galaxy NGC 5846 (Higdon, Buta, & Purcell, 1998) raising the possibility that shock excitation may also be involved.
Thus, the major questions addressed in the present paper are as follows:
-
•
Are the apparent ‘desert’ regions seen in narrow-band imaging completely devoid of line emission?
-
•
If weak lines are found, are the line ratios consistent with star formation, LINER-type emission, or a combination of the two?
-
•
Does line emission correlate in intensity with the surface brightness of the underlying stellar population, as expected for lines resulting from an evolved stellar population (e.g. p-AGB stars)?
-
•
Are the velocities of any lines consistent with their coming from a rotating disk population?
The structure of the paper is as follows. The main properties of the observed galaxy sample are introduced, and the spectroscopic observations and their reduction are described in section 2. Section 3 includes the main results in terms of emission line detections, the comparison of line ratios from ‘desert’ and star formation regions, and a brief discussion of the kinematics of the detected emission. Section 4 presents a discussion of the interpretation of the observations in terms of the likely origin of the line emission. The main conclusions are then summarised in section 5.
Throughout the paper, galaxy distances are calculated assuming a Hubble constant of 68 km s-1 Mpc-1 (Planck Collaboration et al., 2013) and the Virgo-infall-only model from the NASA Extragalactic Database (NED), for galaxies with recession velocities greater than 2000 km s-1. Below this limit, values based on redshift-independent distance indicators (e.g. Cepheids or type Ia supernovae), also taken from NED, were used.
2 Observations
Observations are presented here for 15 low-redshift barred spiral galaxies. The sample is not in any sense claimed to be a complete or statistically representative sample of galaxies, with the main criterion for selection being that we have narrow-band H imaging which shows evidence for a clear ‘desert’ over a radial range corresponding to a clearly visible bar. Note that the evidence for a bar comes from broad-band imaging, as bars themselves are generally not visible in H imaging, as shown in Fig. 2. The major properties of the 15 galaxies are listed in Table 1. Ten are classified as strongly-barred (SB) types, with the remaining 5 having SAB classifications. In terms of Hubble classification, 8 are Sb types, with the remainder being spread between Sa and Scd. Column 3 of Table 1 lists any classifications or comments in NED relating to the nuclear properties of the galaxies; 7 have no relevant comments, 5 have been noted as AGN or Seyferts, and 3 have nuclear regions dominated by star formation activity. All of these galaxies except UGC 3685 are within the footprint of the SDSS, and seven have nuclear spectral data from SDSS enabling classifications of the dominant nuclear ionisation source using the methods of Baldwin, Phillips, & Terlevich (1981). These are listed in column 4, where ‘Comp’ indicates a composite spectrum with evidence for both AGN and stellar contributions to the ionising flux. Recession velocities in km s-1 are given in column 5, and the adopted galaxy distances in Mpc in column 6. All 15 galaxies in the present sample are viewed at moderate inclinations, in the range 29∘ - 60∘, as listed in column 7. The position angle (PA) of the galaxy major axis is in column 8 and the orientation of the bar, measured from our own imaging, is in column 9.
The new observations presented here are long-slit optical spectra, taken with the Intermediate Dispersion Spectrograph (IDS) on the Cassegrain focus of the 2.5-metre Isaac Newton Telescope (INT) at the Roque de Los Muchachos Observatory on La Palma in the Canary Islands. The observing time was allocated by the UK Panel for the Allocation of Telescope Time to proposal I/2014A/08. Most of the observations presented here were taken between the 4th and 8th February 2014, using the R1200Y grating, the RED2 CCD detector and a 1.5′′ slit. This combination gives a dispersion of 0.53 Å pixel-1, an unvignetted wavelength range of 1166 Å and the slit width projects to an effective resolution of 1.19 Å. The integration times were usually 31200 s; the actual values are listed in Table 1 (col. 10), which also lists the night on which the observation was made (col. 9) and the position angle in degrees E of N (col. 11). The slit angle was generally chosen so as to maximise the area of star formation desert region contained within the slit and thus was not, in general, at the parallactic angle. However, atmospheric refraction effects are not a problem for the present study since the only line ratios we are interested in are H and the surrounding [NII] lines, which cover a very small wavelength range making differential refraction negligible. The final column in Table 1 is the outer radial limit used for the extraction of the SFD region spectra in kpc.
Spectrophotometric standards taken from the Isaac Newton Group list (available at http://catserver.ing.iac.es/landscape/tn065-100/workflux.php) were observed on all nights at a range of airmasses to enable flux calibration. All observations were taken in clear, photometric conditions, with seeing generally between 1.2 and 2.0′′.
| Name | Classn. | Nucl. | Nucl. | Vel | Dist | Inc | PA | Bar | Date obs | Int time | Slit | RMAX |
|---|---|---|---|---|---|---|---|---|---|---|---|---|
| NED | SDSS | Mpc | s | kpc | ||||||||
| NGC 864 | SAB(rs)c | 1562 | 18.2 | 41 | 20 | 95 | 20140206 | 2x1200 | 55 | 3.0 | ||
| NGC 2268 | SAB(r)bc | 2222 | 37.6 | 52 | 66 | 40 | 20140204 | 3x1200 | 3 | 1.3 | ||
| UGC 3685 | SB(rs)b | 1797 | 27.9 | 34 | 135 | 131 | 20140205 | 3x1200 | 0 | 2.4 | ||
| NGC 2543 | SB(s)b | SF | 2471 | 38.6 | 55 | 45 | 90 | 20140204 | 1x1200 | 0 | 4.5 | |
| NGC 2595 | SAB(rs)c | Comp | 4330 | 64.4 | 41 | 45 | 158 | 20140205 | 3x1200 | 80 | 8.3 | |
| NGC 2712 | SB(r)b | 1815 | 31.2 | 57 | 178 | 28 | 20140207 | 3x1200 | 170 | 3.3 | ||
| NGC 3185 | (R)SB(r)a | Sy 2 | Sy 2 | 1217 | 23.4 | 47 | 130 | 113 | 20140204 | 3x1200 | 140 | 3.3 |
| NGC 3351 | SB(r)b | Starburst | 778 | 10.2 | 47 | 13 | 110 | 20140205 | 3x1200 | 20 | 2.5 | |
| NGC 3367 | SB(rs)c | Sy,LINER | 3040 | 46.6 | 29 | 5-70 | 72 | 20140206 | 3x1200 | 170 | 2.3 | |
| NGC 3811 | SB(r)cd | Starburst | 3105 | 49.8 | 41 | 160 | 30 | 20140210 | 3x1000 | 87 | 2.6 | |
| NGC 4051 | SAB(rs)bc | Sy1.2/1.5 | 700 | 14.8 | 42 | 135 | 128 | 20130113 | 2x1200 | 117 | 2.3 | |
| NGC 4210 | SB(r)b | LINER | 2732 | 45.1 | 39 | 105 | 45 | 20140206 | 3x1200 | 170 | 1.3 | |
| NGC 5698 | SBb | HII | SF | 3679 | 58.8 | 60 | 70 | 168 | 20140208 | 3x1200 | 70 | 6.3 |
| NGC 5806 | SAB(s)b | Sy2,AGN | Comp | 1359 | 25.5 | 59 | 170 | 172 | 20140207 | 3x1100 | 30 | 1.6 |
| UGC 10888 | (R’)SB(r)b | AGN | Comp | 6149 | 95.5 | 52 | 149 | 69 | 20140208 | 3x1000 | 120 | 4.3 |
2.1 Data reduction
Data reduction was performed using Starlink software. Most of the reduction, including bias subtraction, flat fielding, correction of spectra for minor rotation and spatial distortion effects, and sky background subtraction, was completely standard and will not be described in detail here. Wavelength calibration was performed using arc lamp spectra taken with the light from a copper neonargon arc lamp, taken immediately before or after the galaxy spectrum and hence with the telescope in the same position, to avoid flexure errors. The spectra were flux calibrated from the spectrophotometric standard observations from the appropriate night.
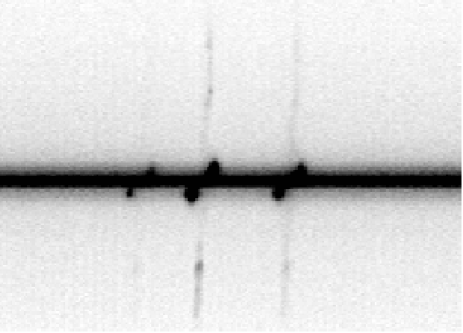
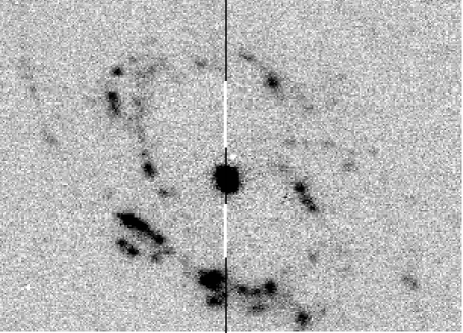
Once the reduced two-dimensional spectra had been produced (see an example in Fig. 3), the next task was to decide on the region of slit from which the star formation desert spectra were to be extracted. This process was aided by our having continuum-subtracted narrow-band H imaging for all of our target galaxies (see Fig. 2, lower frame and Fig. 4 for examples), which were inspected with a superposed line at the observed position angle. This slit position is illustrated by the vertical line in Fig. 4, which also highlights in white the two parts of the slit used to extract desert regions spectra. The nuclear regions of this galaxy, NGC 2543, are strongly emitting and must obviously be carefully excluded from the desert region analysis; this is always the case in the galaxies in the present study, giving two desert regions for each, one on either side of the nucleus. However, the large size of one of the galaxies, NGC 4051, meant that the slit was offset to include just the nucleus and one half of the disk, to ensure that the slit reached a ‘sky’ area off the edge of the disk, and hence only one desert region was observed. (Note also that NGC 4051 was observed in an earlier observing run than that for all other data presented here, with a slightly different observational set-up.) The outer limits of the extracted desert area were defined by inspection of the narrow band images, again as shown in Fig. 4. The result of this process was 29 spectra from the 15 galaxies listed in Table 1; these spectra are listed in Table 2. In addition, a region of strong line emission, corresponding to a star formation region lying outside the desert region, and not in the nucleus, was also defined for each galaxy. These gave us reference regions from within the same galaxy sample with which to compare the line ratios measured for the star formation desert regions. The reference region spectral properties are also listed in Table 2, and identified as ‘HII’ in the second column.
The main properties that were extracted from these spectra were line fluxes, line widths and central wavelengths for the H 6563Å line, and the same parameters for the stronger of the two [NII] lines at 6584Å. The line-fitting process also yielded a true continuum value, enabling equivalent widths to be calculated for both lines. The one complicated case was a Seyfert galaxy, NGC 3367, where the SFD regions showed narrow lines sitting on an extremely broad emission line, where the latter is presumably associated with the central AGN. Here, the line fluxes for the narrow H and [NII] lines were calculated relative to a very local continuum level, effectively removing the contribution of the broad line emission. In addition, a true stellar continuum level was also measured from spectral regions flanking the broad line, for use in later analysis where we investigate correlations between line strengths and the stellar continuum level.
| Name | Region | EWHα | Err | EW[NII] | Err | [NII]/H | [NII]/H | Err | Radial range (′′) | Direction |
|---|---|---|---|---|---|---|---|---|---|---|
| NGC 864 | SFD1 | — | — | 0.88 | 0.16 | 1 | 0.801 | 0.214 | 10.12-32.12 | NE |
| NGC 864 | SFD2 | 1.31 | 0.16 | — | — | 0.000 | 0.000 | — | 19.36-33.88 | SW |
| NGC 864 | HII | 93.18 | 0.93 | 20.81 | 0.84 | 0.223 | 0.221 | 0.009 | 67.76-73.92 | NE |
| NGC 2268 | SFD1 | 1.94 | 0.12 | 2.46 | 0.16 | 1.267 | 0.808 | 0.083 | 3.08-4.84 | N |
| NGC 2268 | SFD2 | 2.81 | 0.09 | 2.85 | 0.13 | 1.017 | 0.730 | 0.055 | 3.96-7.04 | S |
| NGC 2268 | HII | 72.14 | 1.03 | 25.32 | 0.51 | 0.351 | 0.346 | 0.009 | 8.36-11.44 | S |
| UGC 3685 | SFD1 | 0.83 | 0.15 | 1.72 | 0.28 | 2.076 | 0.889 | 0.186 | 7.48-17.60 | N |
| UGC 3685 | SFD2 | 1.60 | 0.13 | 1.44 | 0.21 | 0.895 | 0.530 | 0.092 | 7.48-17.60 | S |
| UGC 3685 | HII | 48.09 | 0.69 | 13.63 | 0.45 | 0.283 | 0.277 | 0.010 | 30.80-36.08 | S |
| NGC 2543 | SFD1 | 1.19 | 0.21 | 1.17 | 0.31 | 0.983 | 0.509 | 0.149 | 7.48-24.20 | N |
| NGC 2543 | SFD2 | 1.67 | 0.20 | 1.88 | 0.37 | 1.125 | 0.677 | 0.151 | 6.60-19.80 | S |
| NGC 2543 | HII | 86.41 | 1.73 | 26.75 | 0.77 | 0.310 | 0.306 | 0.011 | 23.32-26.40 | S |
| NGC 2595 | SFD1 | — | — | — | — | NA | 0.000 | — | 9.68-19.36 | E |
| NGC 2595 | SFD2 | 2.59 | 0.29 | 1.79 | 0.30 | 0.693 | 0.486 | 0.094 | 13.20-26.40 | W |
| NGC 2595 | HII | 26.31 | 0.34 | 10.72 | 0.25 | 0.408 | 0.391 | 0.011 | 23.76-29.92 | E |
| NGC 2712 | SFD1 | 1.00 | 0.11 | 1.44 | 0.16 | 1.441 | 0.686 | 0.107 | 6.16-21.56 | S |
| NGC 2712 | SFD2 | 1.49 | 0.10 | 1.59 | 0.15 | 1.069 | 0.614 | 0.082 | 7.48-20.68 | N |
| NGC 2712 | HII | 19.66 | 0.33 | 7.58 | 0.23 | 0.385 | 0.365 | 0.013 | 33.00-44.44 | N |
| NGC 3185 | SFD1 | 0.39 | 0.13 | 1.14 | 0.11 | 2.908 | 0.763 | 0.149 | 9.68-21.56 | SE |
| NGC 3185 | SFD2 | 0.45 | 0.11 | 0.84 | 0.12 | 1.862 | 0.538 | 0.112 | 11.44-29.04 | NW |
| NGC 3185 | HII | 10.83 | 0.21 | 4.34 | 0.18 | 0.401 | 0.364 | 0.018 | 33.44-42.68 | NW |
| NGC 3351 | SFD1 | — | — | 1.95 | 0.42 | 1 | 1.767 | 0.512 | 27.28-51.48 | NNE |
| NGC 3351 | SFD2 | — | — | 1.33 | 0.13 | 1 | 1.208 | 0.261 | 25.52-40.92 | SSW |
| NGC 3351 | HII | 16.37 | 0.40 | 4.99 | 0.35 | 0.305 | 0.285 | 0.022 | 73.48-58.08 | NNE |
| NGC 3367 | SFD1 | 2.71 | 0.25 | 3.45 | 0.26 | 1.271 | 0.904 | 0.071 | 5.28-9.68 | N |
| NGC 3367 | SFD2 | 3.21 | 0.24 | 3.94 | 0.28 | 1.226 | 0.913 | 0.094 | 5.72-10.12 | S |
| NGC 3367 | HII | 46.25 | 0.58 | 13.55 | 0.25 | 0.293 | 0.286 | 0.006 | 11.88-16.28 | N |
| NGC 3811 | SFD1 | 1.13 | 0.11 | 1.07 | 0.13 | 0.950 | 0.481 | 0.078 | 5.28-10.56 | W |
| NGC 3811 | SFD2 | 0.35 | 0.10 | 1.24 | 0.13 | 3.581 | 0.857 | 0.163 | 5.28-10.56 | E |
| NGC 3811 | HII | 103.17 | 2.43 | 33.05 | 0.92 | 0.320 | 0.317 | 0.012 | 21.56-24.64 | W |
| NGC 4051 | SFD | 0.19 | 0.04 | 0.56 | 0.04 | 2.897 | 0.723 | 0.125 | 12.76-32.12 | NW |
| NGC 4051 | HII | 34.88 | 0.92 | 11.49 | 0.35 | 0.329 | 0.324 | 0.013 | 71.28-81.84 | NW |
| NGC 4210 | SFD1 | 0.65 | 0.11 | 1.30 | 0.11 | 2.017 | 0.745 | 0.119 | 3.08-5.72 | N |
| NGC 4210 | SFD2 | — | — | 1.07 | 0.14 | 1 | 0.967 | 0.226 | 3.52-6.16 | S |
| NGC 4210 | HII | 15.99 | 0.08 | 6.15 | 0.20 | 0.385 | 0.360 | 0.013 | 11.00-15.40 | N |
| NGC 5698 | SFD1 | 1.05 | 0.25 | 1.93 | 0.24 | 1.831 | 0.894 | 0.176 | 6.16-22.00 | WSW |
| NGC 5698 | SFD2 | — | — | 2.64 | 0.20 | 1 | 2.394 | 0.494 | 7.04-19.36 | ENE |
| NGC 5698 | HII | 74.92 | 0.63 | 24.39 | 0.56 | 0.326 | 0.321 | 0.008 | 33.88-37.84 | ENE |
| NGC 5806 | SFD1 | 0.84 | 0.07 | 1.74 | 0.13 | 2.072 | 0.895 | 0.123 | 6.60-13.20 | SW |
| NGC 5806 | SFD2 | 0.60 | 0.09 | 1.65 | 0.12 | 2.744 | 0.967 | 0.150 | 6.60-11.44 | NE |
| NGC 5806 | HII | 6.65 | 0.16 | 2.92 | 0.14 | 0.440 | 0.378 | 0.022 | 15.40-24.20 | NE |
| UGC 10888 | SFD1 | 0.89 | 0.16 | 2.08 | 0.38 | 2.332 | 1.044 | 0.237 | 3.96-9.24 | NW |
| UGC 10888 | SFD2 | — | — | 0.92 | 0.15 | 1 | 0.837 | 0.213 | 3.96-8.80 | SE |
| UGC 10888 | HII | 22.08 | 0.32 | 9.42 | 0.29 | 0.427 | 0.406 | 0.014 | 10.56-18.48 | NW |
3 Results
The first result that is apparent from Table 2 is that the desert regions are, in fact, far from devoid of line emission. Of the 29 regions observed, only one, SFD1 in NGC 2595, had no detectable flux at expected locations of either H or of the stronger of the [NII] lines at 6584 Å. (References to [NII] detections, fluxes, and equivalent widths henceforth will always refer to this line.) One additional region was not detected in the [NII] line only, and 6 gave no detectable H emission. The remaining 21 regions had detections of both lines, at a minimum of a 3- level. The emission is typically diffuse and extended, at least at the spatial resolution of our spectral data, as shown for one representative case in Fig. 3. As can be seen from the final column of Table 1, the SFD region observations extend out to several kpc from the galaxy nuclei, so this is genuinely kpc-scale diffuse emission.
Fig. 5 shows the distribution of values of the observed
[NII]/H line ratio. Ratios derived from SFD regions are shown as the solid
histogram, while the corresponding values for the comparison HII regions are shown
using dashed lines.
For the latter, the ratios form a very tight distribution
around the values typical of excitation by star formation as found by numerous
authors, e.g. Baldwin, Phillips,
& Terlevich (1981). For the 15 HII regions in the present sample, the mean
observed [NII]/H
ratio is 0.3460.016, median 0.330. For the SFD regions,
the ratios are much larger on average, and for
6 of these regions, only [NII] is detected. The latter are plotted in Fig. 5
to the right of the dotted line, at an arbitrary value for the line ratio of 4.5; in fact, only lower limits
can be placed for these regions.
There is additionally one SFD region in which a detection was
made of H but not [NII], and in NGC 2595, as noted above, neither line was
detected.
Neglecting the 7 regions for which the H line was not detected leaves 22 SFD regions for which we can derive emission line ratios. For these 22, the mean observed [NII]/H ratio is 1.650.19, median 1.36. A Kolmogorov-Smirnov (K-S) test gives a maximum value of 0.9545 for the SFD and HII region distributions, which strongly excludes the possibility (formal probability 0.000 to three significant figures) that the SFD and HII region values are selected from the same parent distribution. The 6 regions with [NII] line detections and no H only add weight to this conclusion.

3.1 Correction for underlying H absorption
One possible explanation of the relatively weak H emission lines is that the measured flux is reduced due to the presence of H absorption features. This is a particular problem in the case of this ‘star formation desert’ analysis due to the low equivalent width of the detected emission features, which can potentially be much more strongly affected by absorption than is the case for strong lines from star formation regions, in which context H absorption is often neglected as being unimportant compared with, for example, the effects of extinction. However, it is not trivial to correct for such absorption effects. In their pioneering study of LINER emission, Ho, Filippenko, & Sargent (1993) subtracted the spectrum of a non-star-forming template galaxy to correct for the underlying continuum shape, but the ubiquity of the line emission found in the present sample must cast doubt on whether any observed stellar population can safely concluded to be free of emission lines. Thus, in the present study, we instead use simulated, theoretical stellar populations, with suitably conservative assumptions about the uncertainties inherent in such modelling.
We predict the underlying absorption features using simple stellar population (SSP) models from the BaSTI database (Percival et al., 2009), which were used to produce simulated spectra at a resolution of 1 Å pixel-1 for population ages from 50 Myr to 10 Gyr. The equivalent width of the H absorption line was measured in each of the resulting spectra, using the same 8 Å bandpass and continuum ranges as was used to measure H emission line fluxes in the observed galaxy spectra. The resulting equivalent widths are plotted in Fig. 6, which shows the well-established peak in Balmer line strengths for intermediate-age stellar populations; in these models and passband definitions, the highest equivalent width is 2.465 Å for a 500 Myr. For ages greater than 2 Myr, the equivalent width is approximately stable at 1 Å.

On inspection of the BaSTI SSP spectra, it was clear that the younger models with strong H features showed strong wings to their absorption lines which were not apparent in the observed spectra. Figure 7 shows an example of one of the few observed spectra with some evidence for a broad absorption feature around the H emission line (region SFD1 in NGC 4210). Even in this case, it is apparent that the 0.5 and 1 Gyr SSP spectra significantly over-estimate the strength of the absorption feature that is present in this spectrum, while 2 and 4 Gyr populations reproduce its strength reasonably well. Given that this is a conservative estimate, with all other observed spectra showing even less evidence for absorption than is seen in region NGC 4210 SFD1, we conclude that the underlying spectra could be represented by SSPs with ages anywhere between 2 and 10 Gyr. This corresponds to an H equivalent width between 1.315 and 0.891 Å, with an average value of 1.1030.21 Å. We adopt these values as the most likely value, and associated uncertainty, of the H absorption equivalent width from the underlying stellar population. This corresponds to an SSP of age3.5 Gyr. An equivalent width of 2.465 Å, corresponding to the 0.5 Gyr population, can be taken as a physical upper limit to any absorption correction, although we note again that such a strong feature should be easily seen in our spectra, and is never apparent.
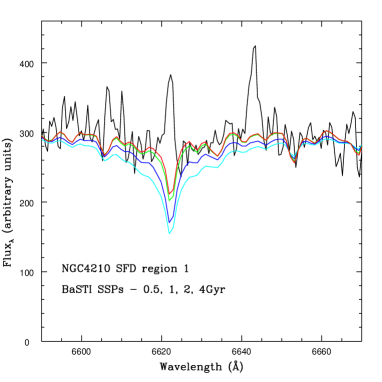
Figure 8 shows the effect on [NII]/H line ratios of boosting the H fluxes by an amount corresponding to the 1.103 Å equivalent width correction. This correction has only a small effect on the HII region ratios, again shown by the dashed histogram. For the star formation desert regions, the main effect is to tighten up the distribution with most of the regions detected in both lines having ratios between 0.4 and 1.0. There are some additional regions contributing to Fig. 8 compared to Fig. 5 as we have now included regions previously undetected in H line emission. These are now given emission line fluxes corresponding to the absorption correction. This adds in one more point with a ratio of 0.0 (previously undetected in both lines, now considered just an H detection), and gives defined ratios for the 6 regions plotted as lower limits to the right of the dotted line in Fig. 5. All 4 ratios higher than 1.0 in Fig. 8 correspond to regions previously undetected in H.
A K-S test performed on the emission line ratios after correction for 1.103 Å of underlying H absorption shows that the distributions for HII and star formation desert regions are still very different. The 15 HII regions now have a mean [NII]/H ratio of 0.3300.013, with a median value of 0.325. For 29 star formation desert regions, the mean ratio is 0.8140.083 with a median of 0.801. The K-S test now finds a maximum fractional difference in the two cumulative distributions D0.931, which still indicates a vanishingly small probability of their being drawn from the same parent distribution: P0.000, to 3 significant figures.
For completeness, we performed the same test using a maximal absorption correction of 2.465 Å, even though such a strong effect is inconsistent with the observed spectra. The 15 HII regions have a mean [NII]/H ratio of 0.3140.011, median 0.320, after this correction. For 29 star formation desert regions, the mean ratio becomes 0.4580.039, median 0.433. The K-S D value is reduced to 0.694, but the distributions are still formally different with the P value remaining 0.000 to 3 significant figures.

An alternative way of demonstrating the different emission-line properties of SFD and HII regions is shown in Fig. 9. Here the [NII] emission-line surface brightness of the 29 SFD regions is plotted against their H surface brightness, where the latter has been corrected for an underlying absorption line with an equivalent width of 1.103 Å, as was used in constructing Fig. 8. The dashed line is the regression relation of the plotted values on values; this regression line has a slope of 0.794, a intercept of –0.030, and a Pearson correlation coefficient of 0.983. The Spearman rank correlation coefficient, which is less sensitive to extreme outliers, has a value of 0.835, confirming that the values are significantly correlated. The solid line in Fig. 9 corresponds to the mean line ratio found for the 15 HII regions in the same sample of galaxies, i.e. . Note that the points corresponding to individual HII regions cannot be plotted on Fig. 9 as their line surface brightnesses are orders of magnitude higher than those of any of the SFD regions.
Figure 9 shows clearly that the H and [NII] line strengths are strongly correlated in the SFD regions, and that most of the scatter and all the strong outliers seen in the line ratios plotted in Fig. 8 are due the regions with the weakest line emission, which is barely detected in some cases. The strong correlation between the line strengths at least implies a common source driving the emission in the two lines. However, it also appears very unlikely that this source is star formation, e.g. from a population of low-luminosity, individually undetected HII regions, as the ratio of [NII] to H line strengths is significantly higher in virtually all of the SFD regions than the very narrow range of ratios found for HII regions. Thus other sources must be sought for the ionising radiation in these regions.

3.2 Rotational velocities
In order to test whether this emission is closely linked to the underlying stellar population in galaxy disks, it is useful to test whether the line emission from the desert regions shares the rotational velocity of other disk components. This might not be the case, for example, were the emitting gas to be located in galaxy haloes. We selected the galaxy NGC 2712 (shown in Fig. 2) for this test as it is one of the more significantly inclined galaxies in the present study, and the slit angle differs by only 8∘ from the galaxy major axis, with both factors maximising the rotation signal. For this test, five velocities were calculated from different regions of our long slit spectrum, corresponding to the nucleus, to the star formation desert regions to the north and south of the nucleus (SFD1 and SFD2 respectively), and to star formation regions lying just beyond each of the desert regions. Velocities were calculated from the centroids of gaussian profiles fitted to the H lines from each of the above regions. The resulting velocities are shown in Table 3.
| Region | Wavelength | Velocity | V |
|---|---|---|---|
| Å | km s-1 | km s-1 | |
| Nucleus | 6602.53 | 1815.0 | 0.0 |
| SFD1 | 6599.88 | 1693.8 | 121.2 |
| HII1 | 6599.40 | 1672.0 | 143.0 |
| SFD2 | 6605.60 | 1955.3 | 140.3 |
| HII2 | 6605.23 | 1938.4 | 123.4 |
This analysis makes clear that the line emission from the two star formation desert regions shares fully in the rotational velocity of the disk of NGC 2712. In one case, SFD1 to the north of the nucleus, the rotation is 20 km s-1 slower than that of the HII region lying just outside it; but in SFD2, south of the nucleus, the pattern is reversed, and in any case most rotation curves show fluctuations of at least 20 km s-1. So it is clear that whatever drives the SFD line emission, it is linked to the rotating disk component.
3.3 Diffuse line emission and the old stellar population
We next perform a simple test motivated by the possibility that the diffuse line emission is causally linked to the old stellar population present in the SFD regions, for example if the emission is due to p-AGB stars. If this is the case, there should be a correlation between the strength of the diffuse line emission and the continuum surface brightness in the same regions, since the latter can most plausibly be assumed to be due to the old stellar population, in the absence of ongoing or recent star formation. Figures 10 and 11 illustrate a simple test of this possibility, where line surface brightness in W m-2 sq. arcsec-1 in the H and [NII] lines respectively are plotted against the red-light continuum flux measured from the same spectra, in W m-2 Å-1 sq. arcsec-1. Both figures show good correlations between line strength and old stellar continuum, with Pearson correlation coefficients of 0.930 in both cases, and Spearman rank correlation coefficients of 0.836 and 0.846 for Figures 10 and 11 respectively. While such correlation does not constitute proof, it is at least consistent with a link between this line emission and the old stellar population.


3.4 The galaxy-wide importance of diffuse line emission
Given that we have identified near-ubiquitous diffuse line emission, it is of interest to investigate how significant this component is relative to the global emission-line activity of the galaxies in which it occurs. For example, it would be useful to know what fraction of the total galaxy line flux, when imaged in a narrow-band filter, would be contributed by this diffuse component. To address this question, we have estimated the line fluxes integrated over these areas based on an estimated total H [NII] line flux. To simulate narrow-band filter observations, this total comprised the sum of the H line flux, without correction for absorption, and the [NII] 6584 Å flux multiplied by a factor to account for the weaker [NII] line at 6548 Å, following the [NII] line ratios estimated by Acker et al. (1989). The individual galaxy surface brightnesses were then integrated over the SFD areas of their galaxies in arcsec2, and converted into star formation rates in units of solar masses per year, using the conversion formula of Kennicutt (1998), giving a mean of 0.0408 and a median of 0.0327 M⊙ yr-1 over the 15 galaxies. To be clear, we only calculate these numbers for comparison purposes, and do not consider that ionisation by young stars is a likely explanation for this emission. The numbers presented have not been corrected for any internal extinction; using the correction preferred by Kennicutt (1998) for bright spiral galaxies would increase these rates by a factor 2.8, but it is far from clear that these SFD regions contain significant amounts of dust.
In any case, only one conclusion can be drawn from these equivalent star formation rates; the diffuse line emission we find in these barred galaxies is not a major contributor to the global line emission from these galaxies. The total inferred SF rates can be compared with global rates derived from narrow-band imaging for 7 of the present sample in James et al. (2004), which have a mean value of 2.02 M⊙yr-1. So the diffuse emission from the SFD regions only comprises a few per cent of the total emission in these lines from these bright barred galaxies. Future observations are planned to explore this conclusion further in different types of galaxies.
4 Discussion
In the analysis presented in this paper, we have used new spectroscopic data to investigate a region that is characteristic of a large fraction of strongly barred galaxies, which we have dubbed the star formation desert or SFD. In earlier papers, we claimed that this region, which covers the radial range swept out by the bar, is devoid of line emission and hence star formation. Using more sensitive long-slit spectroscopy, we have shown in the present paper that the first of these claims was incorrect, and in fact almost all of the SFD regions have detectable H and [NII] emission. However, this emission is diffuse and at a low surface brightness which accounts for its non-detection in previous narrow-band imaging studies. The second claim appears to be correct, in that the emission line ratios appear to be inconsistent with those expected for star formation, with the [NII] line being relatively much stronger than is found in any star formation regions in this study, or indeed in the very extensive previous literature in this area.
We have put some additional constraints on the processes driving the diffuse line emission by the observation that the emission co-rotates at a rate that is closely coupled with the stellar disk, which argues against this being a very extended warm diffuse halo component, or shocked infalling or outflowing gas (Dopita & Sutherland, 1995). The strength of the emission in both H and [NII] correlates strongly with the strength of the underlying stellar continuum, which favours a link with p-AGB stars, which have been proposed in several previous studies as a source of diffuse line emission in normal, and particularly early-type galaxies with little or no star formation, e.g. Stasińska et al. (2008); Sarzi et al. (2010); Yan & Blanton (2012); Bremer et al. (2013); Singh et al. (2013). We note that AGN do not seem a likely source of this emission, since many of the 15 galaxies have no indications of AGN activity. In columns 3 and 4 of Table 1, 7 are listed as having AGN, LINER or composite nuclei, 4 are dominated by star formation and the remaining 4 have no specific nuclear classifications. In any case the emission is observed over several kpc which would argue against a single central ionising source. Given the extent of the SFD regions, leakage of ionising photons from HII regions also seems to be ruled out. However, there are some other intriguing possibilities for extended line emission which cannot be ruled out at present and should be mentioned for completeness. Shock excitation of the gas is an interesting possibility, and we note that Galarza, Walterbos, & Braun (1999), in a study of emission-line regions in M 31, found that supernova remnants which are believed to be dominated by shock excitation, showed [NII]/H ratios in the range 0.48 - 1.2, mean 0.707, very similar to those of the SFD regions of the present galaxy sample, after application of the H absorption correction. Another possible source of shocks is of course the bar itself, which motivates a further study of the strength of this diffuse emission as a function of angular separation from the bar axis. Unfortunately this cannot be done with the present data set, due to only having single long-slit observations of each galaxy.
The recent study by Singh et al. (2013) provides a particularly interesting source of comparison for the present work, as it reached very similar overall conclusions, but by quite different methods. Singh et al. (2013) looked at 48 galaxies classified as showing LINER emission from within the CALIFA survey (Sánchez et al., 2012), an integral field study of 600 galaxies in the low-redshift (0.005 z 0.03) Universe. Singh et al. (2013) show convincingly that, while the LINER classifications are based on spectra extracted from a central region 3′′ in diameter, the lines contributing to the LINER-type ratios fall off much more slowly than would be expected were they to be driven by a single nuclear source such as an AGN. Thus they strongly prefer a stellar explanation, such as p-AGB stars. It is also interesting to compare our results directly with two of the galaxies shown as examples in Figure 2 of Singh et al. (2013). This figure includes two star forming spiral galaxies, the first of which, NGC 4210, is also in the present study. The emission-line spatial distribution of this galaxy, as found by Singh et al. (2013) very nicely matches the central peak/star formation desert/outer star formation ring pattern found here. Interestingly, Singh et al. (2013) find a perfect trend for LINER-type line ratios in the central peak and star-formation line ratios in the outer disk, but they do not apparently detect any emission from the intermediate SFD region itself. We do detect SFD emission in this galaxy; while not one of the strongest, [NII] emission is clearly detected in both SFD regions analysed, and H emission is seen from one of them. The other spiral galaxy shown in Fig. 2 of Singh et al. (2013) is also very interesting. This galaxy, UGC 11680, shows clear Seyfert-type emission from its nuclear region in the CALIFA data, with star-formation ratios in the spiral arms, and LINER-type ratios scattered across an extended region of the disk, in the interarm regions. This extended LINER emission is very similar to that found in the present paper. However, it is not clear whether UGC 11680 is directly comparable, as it may not be barred (the central bulge shows an extended morphology that is consistent with a weak bar, but the NED classification is Scd), and it is also undergoing a strong interaction with an early-type companion, which complicates the interpretation.
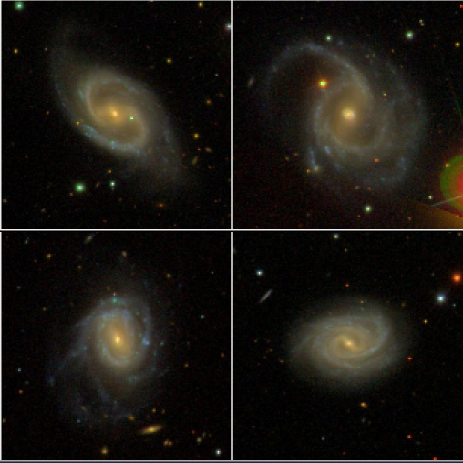
One other area requiring further study is the range of galaxies exhibiting this behaviour, as this study has quite explicitly made use of galaxies with carefully defined properties. The 15 galaxies studied are all clearly barred, with 10 having strong-bar SB classifications and the remaining 5 being SAB types, and they are generally bright and massive spiral galaxies. Most are quite early type spirals, with SBb being the most common type, and here it is relevant to mention the bimodality of barred galaxies discussed by Nair & Abraham (2010); Hakobyan et al. (2014) (and confirmed by our analysis of galaxies from the HGS survey). These authors separate out two types of bars: dynamically strong bars in early-type disk galaxies with dominant old, red stellar populations; and dynamically weaker bars in late-type, low-mass, gas-rich spirals. Analysis of the colour images produced from the multi-passband SDSS galaxy images illustrates this point well. As noted above, all but one of the present sample lie within the SDSS footprint, making such images available (Ahn et al., 2014), and an illustrative subset is shown in Fig. 12. These images clearly show that the radial range swept out by the bar has red colours, indicating that an old stellar population is dominant, while the disk regions outside this region have blue colours indicative of ongoing star formation. This pattern is not seen for late-type barred galaxies of type SBd or similar, where the bar regions also show blue colours. If this bimodality in the effects of early- and late-type bars is real, the activity we are investigating in the present paper appears to be linked with the early-type hosts, and to be most marked in SBb types (range SBa - SBc approximately). This raises obvious questions about whether the activity we find in the SFD regions of these galaxies is occurring in galaxies with later-type bars, and indeed in galaxies generally.
The SDSS images also enable checks to be made of the environment of our galaxies. Overall, they confirm that this is predominantly a sample of very isolated galaxies. NGC 3185 is considered a member of the NGC 3190 group of galaxies, but it is well separated (11′ - 17′ projected separation) from the other three bright members of this group. NGC 5806 is a member of the NGC 5846 group, but again is well separated (21′) from the nearest group member. Finally, NGC 3367 is apparently close to the Leo group of galaxies, but is considered to be in the background due to a much higher redshift (3040 km s-1 c.f. 910 km s-1 for the group). Thus we conclude that none of the present sample has evidence for a close companion which could be causing significant tidal disturbance, or other interaction effects which might cause shock excitation of gas.
We note that galaxies showing the characteristic SFD identified here give a particularly clean view of emission lines not associated with SF, in a region which is not accessible in unbarred galaxies, i.e. away from the nucleus, but within the central few kpc. In unbarred spiral galaxies, this region is host to the dominant SF activity (in surface density, and as a fraction of the total SF activity in these galaxies), making it impossible to detect low-level diffuse activity. The SFDs are an excellent environment for further study of these anomalous line ratios, being a clean stellar population with little contamination from either AGN or SF activity.
5 Conclusions
The main conclusions of the present study are as follows:
-
•
Barred galaxies, at least of earlier Hubble types, have strongly suppressed star formation in the radial range swept out by their bars.
-
•
These extended ‘star formation desert’ regions do however show line emission, with H and/or the [NII] 6584 Å line being detected in virtually all of the barred galaxies in the present study.
-
•
The observed line ratios are not consistent with expectations for star formation regions, but have high [NII]/H ratios more characteristic of LINER-type emission. This conclusion holds regardless of the adopted correction for underlying stellar absorption at H.
-
•
The spatial distribution of line emission is also not consistent with expectations of star-forming regions, being low surface brightness diffuse emission extended on scales of several kpc.
-
•
The diffuse emission lines show a strong rotation signal consistent with the kinematics of the stellar disk.
-
•
The strength of the diffuse components in both H and [NII] emission is correlated with the red continuum from the local old stellar population.
-
•
The total emission integrated over the SFD region is typically only a few per cent of the line emission of the whole galaxy in which it sits.
-
•
Our preferred model is that this emission is powered by p-AGB stars from the old stellar population; AGN and leakage from HII regions do not seem plausible explanations, but shock processes cannot be ruled out and merit further investigation.
Acknowledgments
The Isaac Newton Telescope is operated on the island of La Palma by the Isaac Newton Group in the Spanish Observatorio del Roque de los Muchachos of the Instituto de Astrofísica de Canarias. We are happy to acknowledge support and assistance at the INT from Nicola Gentile, James McCormac and other ING staff. The referee, Artur A. Hakobyan, is thanked for a particularly thoughtful and helpful report, which included many suggestions that improved the content and clarity of this paper. This research has made use of the NASA/IPAC Extragalactic Database (NED) which is operated by the Jet Propulsion Laboratory, California Institute of Technology, under contract with the National Aeronautics and Space Administration. Funding for the SDSS has been provided by the Alfred P. Sloan Foundation, the Participating Institutions, the National Science Foundation, the U.S. Department of Energy, the National Aeronautics and Space Administration, the Japanese Monbukagakusho, the Max Planck Society, and the Higher Education Funding Council for England. The SDSS Web Site is http://www.sdss.org/. The SDSS is managed by the Astrophysical Research Consortium for the Participating Institutions. The Participating Institutions are the American Museum of Natural History, Astrophysical Institute Potsdam, University of Basel, University of Cambridge, Case Western Reserve University, University of Chicago, Drexel University, Fermilab, the Institute for Advanced Study, the Japan Participation Group, Johns Hopkins University, the Joint Institute for Nuclear Astrophysics, the Kavli Institute for Particle Astrophysics and Cosmology, the Korean Scientist Group, the Chinese Academy of Sciences (LAMOST), Los Alamos National Laboratory, the Max-Planck-Institute for Astronomy (MPIA), the Max-Planck-Institute for Astrophysics (MPA), New Mexico State University, Ohio State University, University of Pittsburgh, University of Portsmouth, Princeton University, the United States Naval Observatory, and the University of Washington.
References
- Acker et al. (1989) Acker A., Köppen J., Samland M., Stenholm B., 1989, Msngr, 58, 44
- Aguerri (1999) Aguerri J. A. L., 1999, A&A, 351, 43
- Ahn et al. (2014) Ahn C. P., et al., 2014, ApJS, 211, 17
- Baldwin, Phillips, & Terlevich (1981) Baldwin J. A., Phillips M. M., Terlevich R., 1981, PASP, 93, 5
- Bremer et al. (2013) Bremer M., Scharwächter J., Eckart A., Valencia-S. M., Zuther J., Combes F., Garcia-Burillo S., Fischer S., 2013, A&A, 558, A34
- Dopita & Sutherland (1995) Dopita M. A., Sutherland R. S., 1995, ApJ, 455, 468
- Ellison et al. (2011) Ellison S. L., Nair P., Patton D. R., Scudder J. M., Mendel J. T., Simard L., 2011, MNRAS, 416, 2182
- Galarza, Walterbos, & Braun (1999) Galarza V. C., Walterbos R. A. M., Braun R., 1999, AJ, 118, 277
- Hakobyan et al. (2014) Hakobyan A. A., et al., 2014, MNRAS, 444, 2428
- Hawarden et al. (1986) Hawarden T. G., Mountain C. M., Leggett S. K., Puxley P. J., 1986, MNRAS, 221, 41P
- Heckman (1980) Heckman T. M., 1980, A&A, 87, 152
- Higdon, Buta, & Purcell (1998) Higdon J. L., Buta R. J., Purcell G. B., 1998, AJ, 115, 80
- Ho, Filippenko, & Sargent (1993) Ho L. C., Filippenko A. V., Sargent W. L. W., 1993, ApJ, 417, 63
- Huang et al. (1996) Huang J. H., Gu Q. S., Su H. J., Hawarden T. G., Liao X. H., Wu G. X., 1996, A&A, 313, 13
- James et al. (2004) James, P. A. et al., 2004, A&A, 414, 23
- James et al. (2009) James P. A., Bretherton C. F. & Knapen J. H., 2009, A&A, 501, 207
- Kennicutt (1998) Kennicutt R. C., 1998, ARAA, 36, 1089
- Knapen et al. (2000) Knapen J. H., Shlosman I. & Peletier R., 2000, ApJ, 529, 93
- Kormendy et al. (2004) Kormendy J., & Kennicutt R. C., 2004, ARAA, 42, 603
- Marinova et al. (2007) Marinova I., & Jogee S., 2007, ApJ, 659, 1176
- Nair & Abraham (2010) Nair P. B., Abraham R. G., 2010, ApJ, 714, L260
- Percival et al. (2009) Percival S. M., Salaris M., Cassisi S. & Pietrinferni A.,2009, ApJ, 690, 427
- Planck Collaboration et al. (2013) Planck Collaboration, Ade, P. A. R., Aghanim, N., et al. 2013, arXiv:1303.5062
- Sánchez et al. (2012) Sánchez S. F., et al., 2012, A&A, 538, AA8
- Sarzi et al. (2010) Sarzi M., et al., 2010, MNRAS, 402, 2187
- Singh et al. (2013) Singh R., et al., 2013, A&A, 558, AA43
- Stasińska et al. (2008) Stasińska G., et al., 2008, MNRAS, 391, L29
- Thilker et al. (2002) Thilker D. A., Walterbos R. A. M., Braun R., Hoopes C. G., 2002, AJ, 124, 3118
- Tubbs (1982) Tubbs A. D., 1982, ApJ, 255, 458
- Yan & Blanton (2012) Yan R., Blanton M. R., 2012, ApJ, 747, 61