The role of curvature anisotropy in the ordering of spheres on an ellipsoid
Abstract
Non-spherical emulsion droplets can be stabilized by densely packed colloidal particles adsorbed at their surface. In order to understand the microstructure of these surface packings, the ordering of hard spheres on ellipsoidal surfaces is determined through large scale computer simulations. Defects in the packing are shown generically to occur most often in regions of strong curvature; however, the relationship between defects and curvature is nontrivial, and the distribution of defects shows secondary maxima for ellipsoids of sufficiently high aspect ratio. As with packings on spherical surfaces, additional defects beyond those required by topology are observed as chains or “scars”. The transition point, however, is found to be softened by the anisotropic curvature which also partially orients the scars. A rich library of symmetric commensurate packings are identified for low particle number. We verify experimentally that ellipsoidal droplets of varying aspect ratio can be arrested by surface-adsorbed colloids.
Significance statement
Emulsions, combinations of immiscible fluids such as oil and water, comprise a variety of commercially relevant systems, from ice cream to cosmetics. Individual droplets in these emulsions can be stabilized by the presence of colloidal particles and nonspherical droplets can be produced by a mechanism of arrested relaxation, where particles adsorbed at the droplet interface become crowded and obstruct further evolution of the surface toward the spherical ground state. The particles tend to have a high degree of crystalline order, but the curvature of the surface frustrates this order and introduces defects. In this paper we study the defect structures that form in packings of hard particles on ellipsoidal surfaces, providing insight into the microstructure and stability of arrested systems.
I Introduction
Emulsions—mixtures of two immiscible fluids—are ubiquitous systems with many applications in the food, oil, and cosmetics industries. At the microscopic level, an emulsion consists of droplets of one fluid embedded in a host fluid; the droplets are held in an equilibrium spherical shape by the interfacial tension between the two fluids. Emulsions with anisotropic droplets are of interest because for some applications, e.g. particle filtering in porous mediaWeiss1995 , performance is improved with increasing aspect ratio. Anisotropic particles are also known to be more easily absorbed by cells, thus being effective as drug delivery systemsChampion2006 ; Gratton2008 . Additionally, ellipsoids fill space more efficiently than spheresDonev2004a , and through chemical functionalization, are a valuable component in the nano-architecture of hierarchical structuresNelson2002 .
A mechanism for sculpting stable shaped droplets exists in Pickering emulsions, where the constituent droplets are stabilized by colloidal particles adsorbed at the interfacePickering1907 . The particles are strongly bound to the surface because they reduce the interfacial tension between the two immiscible phasesBinks2002 . Non-spherical shapes can be produced by a sequence of deformation, adsorption, relaxation and arrest as follows: Following an initial deformation, for example by an applied electric fieldCui2013 or by the coalescence of two dropletsPawar2011 ; during this process additional particles may become adsorbed on the interface from the host fluid. The droplet then relaxes towards the equilibrium spherical shape, reducing the surface area and causing the particles to become more densely packed. If the surface coverage of colloids is sufficiently high, they will become crowded and arrest the shape evolution of the droplet before a spherical shape is reachedCheng2009 ; Pawar2011 .
The purpose of this paper is to identify the role that the anisotropic curvature present in an ellipsoid plays on the ordering of the particles. We assume the particles interact purely through volume exclusion. The quality of the packing of the final state, measured globally by coverage fraction as well as locally by coordination number, depends on this ratio: As , the particles are unable to rearrange themselves significantly and may get trapped in a glassy state, while for , the relaxation proceeds slowly and the situation resembles a classical sphere packing problem. It is this latter quasi-static limit of the relaxation process that we shall examine in this work.
Since the colloids are confined to a 2D surface, the arrested states tend to be quite crystalline as has been shown for spherical droplets or colloidosomesDinsmore2002 . These structures should, therefore, exhibit properties similar to 2D elastic crystalline membranesSeung1988 ; Perez-Garrido1997 ; Bowick2000 ; Bowick2001 ; Bausch2003 ; Einert2005 ; Vitelli2006 ; Giomi2007 ; Giomi2008 ; Irvine2010 ; Bendito2013 . The presence of curvature frustrates the crystalline order and induces defects: particles which have more or fewer than six neighbors, and whose deviation from six-fold order can be quantified as a topological charge: particles with coordination number lower than six have positive charge and vice versa. Lone defects of positive or negative charge are known as disclinations. The topology of the droplet surface will determine the net defect charge, which is 12 for a spherical topologyHilton1996 . Furthermore, there is a coupling of defects to the Gaussian curvature . Because droplets with non-spherical geometries possess a variation in Gaussian curvature along their surface, the defects should be non-uniformly distributed as theoretical studies have predictedGiomi2007 ; Giomi2008 ; Vitelli2006 .
In addition to the minimal number of defects required by topology, pairs of positive and negative defects called dislocations can occur. Droplets with a large system size , i.e. where the ratio of the droplet size to the particle size is large enough, exhibit chains of defects known as scarsBowick2000 ; Bausch2003 . For spherical droplets, a transition has been shown: is below a critical value only isolated defects occur. Above this ratio, scars appear and increase in length with Bausch2003 .
For surfaces of nonuniform curvature, the placement of the defects is an interesting question. The theory of curved elastic crystalline membranesBowick2000 predicts that defects and Gaussian curvature act as source terms in a biharmonic equation,
| (1) |
where is a stress function and is the defect charge density (a sum of point charges). The energy of such a system is,
| (2) |
which must be minimized with respect to defect number and defect position, with total defect charge conserved according to the surface topology. While this suggests that defect charges will be attracted to areas of like-signed curvature in order to minimize the source term, the fact that these systems are governed by a biharmonic equation suggests that the coupling of defects to curvature is nontrivial. This is in contrast to simpler analogues, for example electrostatics, governed by a Poisson equation.
There are two important differences between an elastic crystalline membrane and a 2D arrested hard sphere system. First, in the hard sphere limit, the in-plane elastic constants of a hard sphere system are infinite. Second, arrested hard sphere systems are not able to explore their full phase space, and so one does not expect to find them in the optimally packed ground state. For these reasons, it should not be expected that a 2D hard sphere system is exactly described by the theory of 2D crystalline membranes, but due to the highly crystalline order that is exhibited, the behavior should be qualitatively similar. Additionally, the relative wetting properties of the two fluids may induce a contact angle, leading to inter-particle interactions that may modify the orderingKralchevsky2000 .
In other systems in the packing limit, e.g. viral capsidsRoos2010 and small clusters of colloidsManoharan2003 , configurations with a high degree of symmetry are typically observed for certain special numbers of particles. Experimentally, these tend to be stable, and so the identification of possible symmetric packings may serve as a guide towards stable self-assembled micro-structures. We therefore examine the packings systematically by aspect ratio and particle number to identify the symmetric configurations.
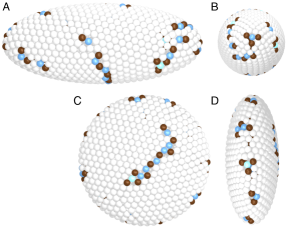
In order to explore the role of surface anisotropy on the ordering of packed particles, we present the results of simulations of hard spheres packed onto ellipsoidal surfaces using an inflation algorithm. Sample results are shown in fig. 1. We investigate the effect of aspect ratio and particle number on the average distribution of defects on our surfaces and the structure of the defects themselves. We also identify highly symmetric configurations. Experimentally, we demonstrate that ellipsoidal droplets can be stabilized by surface-adsorbed colloids, and we compare the spatial distribution of defects in the experiments and simulations. Details of the model and simulations are presented in Methods.
II Results and Discussion
We employ an inflation packing algorithm in order to generate packings of spheres on ellipsoidal surfaces. The centroids of equal sized spheres are bound to a fixed ellipsoidal surface, either prolate or oblate, of aspect ratio . The particles have hard-sphere interactions and diffuse as the particle radius is slowly incremented, until further inflation is precluded. Further details of the algorithm are given in Methods.
Two sets of data were generated from which we obtained our results. One data set was used for studying the curvature-defect coupling and scar length, which consisted of packings with aspect ratio varying from 1.2 to 4.0 in increments of 0.2 (for both the prolate and oblate cases: we consider the aspect ratio to be the ratio of the semi-major to semi-minor axis.) The particle number was varied from 10 to 800 in increments of 10. Additional prolate packings were generated to study scar orientation, from aspect ratio 4.2 to 8.0 in increments of 0.2, from particle number 710 to 800 in increments of 10. 50 configurations were generated for each pair of parameters. The second data set was used for studying symmetry, where we are interested in lower particle numbers and a more fine-grained search of the parameter space. This data set consisted of packings with aspect ratio varying from 1.1 to 4.0 in increments of 0.1, and particle number varying from 3 to 200 in increments of unity. 80 configurations were generated for each pair of parameters.
II.1 Defect Distribution
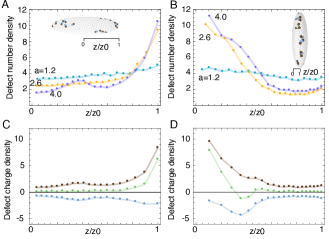
We first examined the distribution of the defects as a function of the aspect ratio. Defect locations were determined by assigning a defect charge to each particle, where was the coordination number determined from the Delaunay triangulation of the particle positions (see Methods). The surface was partitioned into equal-area axisymmetric regions and the number of defects in each region counted. Each segment has a different average Gaussian curvature with regions near the poles having larger curvature for prolate and the reverse for oblate ellipsoids. In fig. 2A for prolates and fig. 2B for oblates, the defect number density is shown as a function of the axial position averaged over the ensemble of simulations at fixed aspect ratio and particle numbers ranging from . Generically, it is apparent that defect number density increases with the Gaussian curvature, as expected. For prolate ellipsoids at low aspect ratio, the defect number density increases monotonically with respect to . At higher aspect ratios, there is a small secondary peak in segments with low Gaussian curvature. We verified this occurs for other ranges of particle numbers .
In order to understand this, we plot separate defect charge densities for positive and negative defects in fig. 2C, as well as the net defect charge density. The anomalous peak is apparent in both the separate positive and negative defect charge densities, but not in the net defect charge density, indicating that the excess defects are taking the form of neutral dislocations or scars.
In fig. 2B, we see that for oblate ellipsoids, the defect density again increases near the more highly curved regions. Fig. 2D reveals, however, that the coupling between defect charge and curvature is again complicated: while there is a peak in positive defects at the highly positively curved edge of the surface, there is a high density of negative defects surrounding this, and the net defect charge density is actually negative near .
These results display a non-trivial interaction between defects and curvature. While the regions of highest Gaussian curvature contain the highest density of defects, the defect density is not a simple monotonic function of Gaussian curvature. This is apparent in the defect number density in the prolate case, and in the defect charge density in the oblate case. The fact that the defect charge density can be negative in regions of positive Gaussian curvature is especially surprising. However, this is not necessarily inconsistent with eqs. 1 and 2, which imply complex defect behavior. Further investigation is warranted to confirm whether the continuum elastic theory gives results similar to the hard sphere packings here.
II.2 Scar Orientation
We next determined whether the scars are oriented by the curvature anisotropy of the surface. To do so, we consider a local scar orientational distribution function (ODF) where the angle is measured locally in the tangent plane relative to the uniaxial axis of the ellipsoid. The ODF may be expanded as a Fourier series,
| (3) |
The average value of the first two non-zero coefficients, and , were calculated for our ensemble of packings. These quantities are order parameters for orientational order as they vanish if the scars align isotropically with the curvature. quantifies nematic order, i.e. uniaxial orientational order and quantifies quadrupolar order.
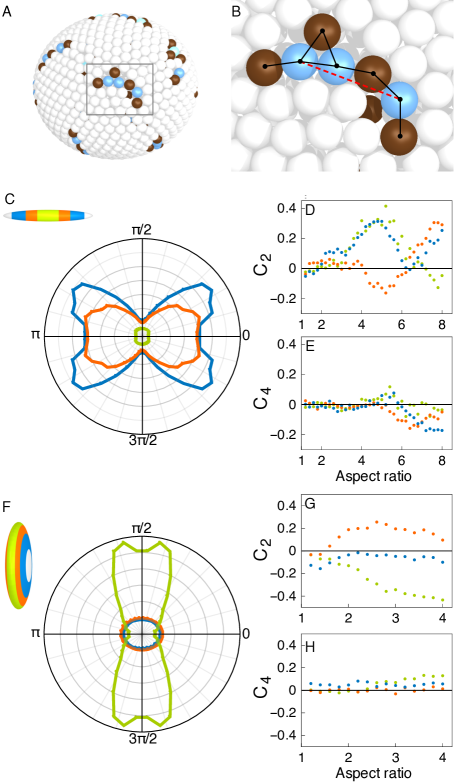
To determine the scar orientation, we studied contiguous chains of defects as shown in fig. 3A and B. Given a packing and its Delaunay triangulation, the neighboring defects around each defect are identified. These adjacent pairs become the edges of graphs of contiguous defects. Two defects are identified as the ends of a chain of length if they are within a connected graph of defects and the shortest path between them contains edges. Once a chain of length is identified, its orientation relative to the local principal directions—i.e. the polar and azimuthal tangent vectors and , respectively (see eq. 7 in the Appendix for the parametrization of the surface)—is calculated thus: given a pair of chain endpoints, their separation vector is projected onto the surface at each endpoint, giving components along and . These components are then averaged between the endpoints, and the angle that the resulting vector makes with is recorded as the orientation of the chain. The -component of the midpoint of each chain is recorded as its position and is used to examine how the coupling varies across the surface.
The analysis was applied to an ensemble of simulation results as follows: For a given aspect ratio, the orientations of all chains of length are collected across simulations with in increments of =10 (with 50 results at each resulting in 500 simulations). Order parameters and are then calculated from this ensemble. Because the curvature anisotropy varies with the -coordinate along the surface, results can be divided according to their position. In our analysis, we exclude scars in the regions near the poles which make up 10% of the surface area as here the curvature tensor is degenerate and the alignment is undefined. The rest of the surface is broken into six equal-area, azimuthally symmetric regions, as illustrated in the insets of fig. 3 C and F, and data from symmetric regions on opposite halves of the ellipsoid are combined. A chain length of =3 was used as this is long enough to capture scar behavior while having enough chains for statistical purposes. Shorter chain lengths show a weaker tendency to orient.
The behavior exhibited by prolate ellipsoids is rather complicated, as seen in the plots of order parameter versus aspect ratio in fig. 3 D and E. In the center region near the equator, scars are nematic along the direction between aspect ratio 3.6 and 6. At higher aspect ratio this center region is very flat, leading to fewer scars, and so any orientational order is insignificant. In the mid-regions between the equator and poles, scars become nematic along the direction at aspect ratio 4.4, and then transition to nematic along the direction at aspect ratio 6.4. Scars near the poles show nematic order along above aspect ratio 2, although this order peaks near aspect ratio 5, then drops to =0 at aspect ratio 6.4 before increasing again. Interestingly, scars on highly prolate ellipsoids can also show order. This appears in the mid regions above aspect ratio 5.2, and in the end regions above aspect ratio 6.
The chain ODFs for prolate ellipsoids of aspect ratio in fig. 3C illustrate the trends that appear at high aspect ratio. It is apparent from the green curve that that there are few chains in the relatively flat center of the ellipsoid. The orange curve shows a high degree of nematic order directed along the polar direction in the mid-region, and the blue curve for the ends shows nematic order along the polar direction, as well as a peak between the directions of principal curvature, which is indicative of negative order.
The case of scar orientation on oblate ellipsoids is more straightforward. The order parameters are plotted as a function of aspect ratio for different azimuthally symmetric regions across the surface, in fig. 3 G and H. Scars at the equator exhibit a high degree of nematic order in the direction, which increases linearly with aspect ratio up to . This is unsurprising, because the curvature on highly oblate ellipsoids is localized to a nearly one-dimensional region around the equator of the ellipsoid, and so one expects the scars to form there, aligned along the equator. There is also a small degree of ordering. In the regions midway between the equator and poles, there is a weak coupling of scars along the direction. These trends are illustrated for in fig. 3F:the green curve for the edges displays a peak near the azimuthal direction, whereas the orange and blue curves show that there are fewer chains without much order in the flatter regions.
While the scar orientation results for the oblate case are easily understood, the ordering of the scar orientation on prolate ellipsoids is far more complicated. The orientation varies greatly depending on chain position and ellipsoid aspect ratio. Especially surprising is the emergence of ordering, which corresponds to a tendency for chains to align in a direction intermediate to the directions of principal curvatures.
II.3 Scar Transition
As is well known from previous workBowick2000 ; Bausch2003 , packings of spheres on spherical surfaces exhibit a transition: For low particle numbers, only the twelve defects required by topology are present; above a critical particle number , it is favorable for larger defect structures to occur, typically chains of scars extending from a core disclination. Increasing above leads to a monotonic increase in average scar length.
From our simulation results of packings with , we calculated the average number of excess dislocations per topologically required disclination for each . Defects were weighted in the analysis by the absolute value of their charge. Given that there are two disclinations per dislocation, and 12 core disclinations, the number of excess dislocations per scar is calculated thus,
| (4) |
where the sum is taken over all defects. This quantity captures the same information as the scar length but is easier to calculate, as individual scars are often not well defined.
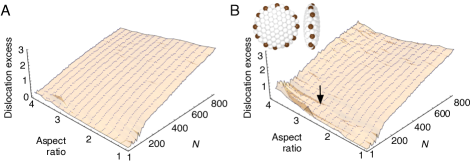
Results of the analysis are displayed in fig. 4. Prolate ellipsoids [fig. 4A] show the experimentally observed behavior for low aspect ratio: for particles there are few excess defects, but at higher particle numbers there is a roughly linear increase in the number of excess defects. As aspect ratio increases, however, the transition is softened such that there is a smooth increase in excess defects with . This is reminiscent of how applied fields soften phase transitionsLandau ; here the anisotropy of the curvature seems to play a similar role.
The oblate packings show the same trends [fig. 4B]. There is, however, an additional feature that stands out. At , , there is a set of nearly scar-free configurations. This is due to commensurability as the particle number and surface geometry for these cases are compatible with a highly symmetric packing with only the minimally required defects, as seen in the inset of fig. 4B. Similar commensurability issues occur in other systems, e.g. sphere packings on cylindersWood2013 .
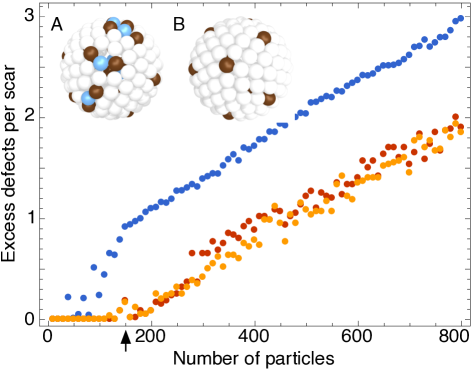
A striking difference between these results and those from a previous study is that here, for hard particles, the transition occurs at a lower particle number; in ref. Bausch2003 it was seen at using colloidal particles with a soft repulsive interaction. We therefore performed simulations (see Methods) using two different potentials, and (where is the interparticle separation), the results of which are shown in fig. 5. For soft particle packings, we take the average scar length of the five lowest energy configurations obtained out of an ensemble of 50. For the hard spheres, , while for the two soft potentials the transition occurs around (which appears to be within the uncertainty of the result presented in ref. Bausch2003 ). The defect number increases at the same rate with respect to particle number for both soft potentials. This supports the conclusion in ref. Bausch2003 that, for soft particles, the scar transition does not depend on the specific form of the particle potential. For hard particles we have quantitatively different behavior. Visual inspection of hard and soft sphere configurations reveals that hard sphere configurations possess gaps (fig. 5A). It is rare to find a lone disclination; it is much more common to find a disclination attached to one dislocation (i.e. a small 5-7-5 scar) adjacent to a gap in the packing. This isn’t seen in soft particle configurations (fig. 5B), as the energy penalty is too high, rather a particle can be squeezed to fill in the gaps. The fact that hard particle packings tend to have gaps makes them especially suitable for chemical functionalization as described in ref. Nelson2002 .
II.4 Packing Fraction and Symmetry
We now turn to how the packing fraction varies with respect to particle number and ellipsoid aspect ratio. To simplify the calculation we make the approximation, valid for large , that the area covered by a particle is its projection onto a flat 2D surface,
| (5) |
where is the area of the underlying surface. We checked the validity of this estimate by numerically integrating the area of intersection between the surface and the spheres on oblate surfaces of aspect ratio 4.0, and found that the difference between our estimate and the true value is very small: using the projected area underestimates the packing fraction by approximately 1% for packings with and 0.1% for packings with .
For large , the packing fraction increases slightly with aspect ratio. This is because for large the curvature—and hence the defects—are mainly localized to the poles on prolate surfaces or the equator on oblate surfaces and so more of the surface can be covered by the planar hexagonal packing, consistent with the results of the above subsections on the Defect Distribution and Scar Transition. For low , the opposite tends to be true; the packing fraction decreases with aspect ratio. However, the trend is more complex and the packing fraction is sensitive to both and at low . Visual inspection of these configurations reveals that for specific combinations of and , the packings have a high degree of symmetry, suggesting a commensurability effect, such as that seen in the Scar Transition subsection above.
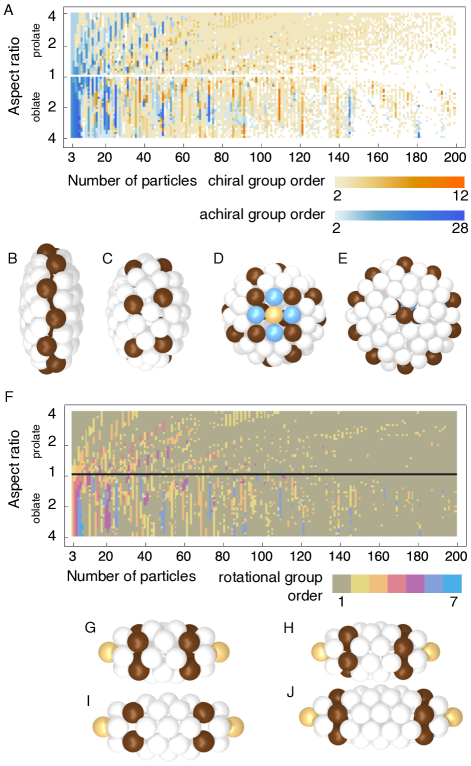
To identify these commensurate combinations, we conducted a more thorough search for symmetric packings using the second data set. An arbitrary packing must break the ellipsoidal symmetry group of the surface and hence must belong to some finite subgroup of ; most packings at high particle number do so trivially, retaining only the identity element. Defining a suitable inner product that measures the distance between two packings, a packing possesses a symmetry if where is a group element of . The elements can be constructed from the group generators: i) an infinitesimal rotation about the ellipsoid symmetry axis; ii) spatial inversion, and iii) a rotation by about an axis perpendicular to the symmetry axis.
We used a norm defined such that,
| (6) |
where the and are the positions of particles in packings A and B, respectively: for each particle in , the closest particle in is found and the separations between these pairs are divided by the particle radius. The root mean square of these normalized separations is then taken as the inner product. From this, together with the group generators, all symmetries such that ,a threshold separation were found. From this catalog of symmetries, for a particular configuration the appropriate group was determined. From a collection of configurations with a given , the most symmetric configuration was chosen by the following procedure. First, the configurations with the largest symmetry group were identified. Then, for each of these configurations, the symmetry group element with the highest symmetry norm was identified. Finally,the configuration with the minimum highest symmetry norm was chosen as the most symmetric.
The results of this analysis are displayed in fig. 6A showing the order and chirality of the symmetry group of the best packing for each combination of particle number and aspect ratio. The degree of rotational symmetry for each packing is shown in fig. 6F. One striking feature is that, for certain particle numbers, long vertical stripes appear in the plots representing commensurate aspect ratios for that particle number. Furthermore, low favors achiral packing while chiral packings occur more often for higher particle number. For prolates the stripes occupy a narrow range of aspect ratio and occur in band-like sequences described by a straight line with slope . Each of these sequences corresponds to a different degree of rotational symmetry , and the particle numbers in the sequence are separated by . Inspecting the configurations in a single sequence, the difference between a configuration with particles and the next with particles is that an additional row of particles has been inserted in the space created by the longer aspect ratio. This is illustrated by a sequence of configurations with fourfold rotational symmetry in fig. 6 G-J.
For oblate ellipsoids, the symmetric configurations for particles occur at a much broader range of aspect ratios and symmetric configurations are observed at much higher and tend to have six-fold rotational symmetry. The reason for this is that the high curvature at the end of the prolate ellipsoids accommodates -fold defects at the poles, and these appear to determine the rotational symmetry for the entire configuration; for oblates, the poles have low curvature and promote hexagonal packing, hence causing six-fold rotational symmetry to be more common. Interestingly, other degrees are present including and and these configurations contain regions of highly oblique packings (fig. 6 D and E).
In general, these symmetric packings are notable because they contain a high degree of hexagonal ordering over much of their surface, with evenly spaced defects throughout. This high degree of regularity should provide stability to the packed structure, and reduce the likelihood of failure from irregularly spaced defects.
III Experiment
An experimental realization of ellipsoidal arrested droplets was performed to confirm the stability of these structures. Ellipsoidal droplets with arrested interfaces are produced by preparing a Pickering emulsion and then mixing the emulsion to deform and arrest the droplets in an elongated shape. Details are given in Methods.
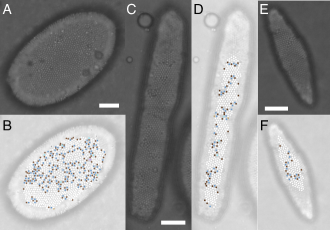
Fig. 7 shows several examples of the arrested droplets observed. Because the curvature of a droplet is significant across its surface, several focal planes have been combined in the images in order to study the packing of spheres on the drop surface. Particle coordinates are determined by finding the local brightness maxima in the image, recording their coordinates, and correcting for any unrealistic results via direct comparison with the experimental images.
Arrest is able to preserve shapes identical to intermediate states of droplets in an elongation field Tjahjadi1994 , as seen in the fig 7A and 7C, and even shapes resembling sections of such shapes as in the case of 7E. While the dynamical formation of these shapes was not studied, it is clear that a wide range of geometries can be formed. We note that the droplet of aspect ratio 5.1 has a spherocylindrical geometry, as opposed to ellipsoidal.
Fig. 7 B, D, and F shows the results of a Delaunay triangulation of the sphere coordinates. We do not display particles at the boundary of the triangulation, as they include spurious edge defects identified as a result of the boundary rather than the ordering of the particles. In each case the arrested state of the interfacially adsorbed spheres is evident from the visible regions of crystalline order. Generally, however, the experimental droplets contain more defects than the simulated packings. In fig. 7B a high degree of hexagonal close-packing is noted near the ends of the droplet, while the center of the structure is more disordered with a higher defect density. Three important factors present in the experiment that are not accounted for in the simulation may contribute to this. First, the evolution of the surface as it relaxes will influence particle rearrangement. Different parts of the surface will grow or shrink at varying rates, affecting where crowding first occurs. Second, particles adsorbed at an interface will not act as purely hard spheres. Capillary interactions caused by the deformation of the surface by the particles will lead to attractive interactions between particlesKralchevsky2000 . This may lead to aggregation of particles during relaxation and is likely to influence the final ordering of the arrested state. Finally, as discussed in the introduction, the experimental relaxation does not take place quasistatically, as is posited by studying the packing limit; it is highly likely that the particles are arrested in a nonoptimal and possibly metastable glassy state. A study of the role of these dynamical influences on the order is in preparation.
IV Conclusion
In this paper, we show that defects in the packing of hard spheres onto an ellipsoidal surface couple nontrivially to the curvature. For low aspect ratios, the defects occur at regions of high curvature as predicted by previous studies; additional secondary peaks in the defect distribution occur in less-curved regions for prolate ellipsoids of sufficiently high aspect ratio. As previously observed for packings on a spherical surface, above a critical particle number the defects take the form of chains or “scars” rather than isolated defects. This scar transition occurs at a lower particle number than the previously studied case for soft interparticle interactions, and is softened by the presence of anisotropic curvature. The alignment of the scars with the curvature is more complicated: in flat regions, there is no alignment; in intermediate regions, there is weak uniaxial alignment with the minimum curvature; in regions of strong curvature, quadrupolar alignment is seen. We identified a rich catalog of symmetric configurations from our simulations, each belonging to a subgroup of the ellipsoidal symmetry group. Plotting the subgroup order in space reveals commensurate surfaces that promote symmetric packings. Finally, we were able to use the mechanism of arrest to sculpt ellipsoidal Pickering emulsion droplets of varying aspect ratio, demonstrating the validity of the fundamental idea. While careful analysis of these experimental packings reveals scars as predicted, the defects appear to agglomerate in regions other than those of strongest curvature, suggesting that dynamical effects play a significant role in the ordering as well as the geometric effects studied here.
Acknowledgements.
TJA and CJB were funded by a Tufts International Research grant to conduct part of this research at UNSW, Australia. CJB was partly funded by a Tufts Collaborates! and a Tufts Innovates! grant. ZW was funded by a UNSW Faculty of Engineering Taste of Research Summer Scholarship. We would like to thank Marco Caggioni (Procter & Gamble Co.) for fruitful discussions about emulsion arrest.Methods
Experimental preparation of arrested droplets
Emulsions are first prepared by mixing 3% w/w monodisperse 1.5 μm diameter precipitated silica particles (Nippon-Shokubai KE-P150) into hexadecane (Sigma-Aldrich, 99%)Pawar2011 . A volume of the silica-hexadecane dispersion is then emulsified into an equal volume of deionized water by manual shaking for three minutes. The emulsion was then aged for 24 hours and inspection revealed a small fraction of elongated droplets. Imaging of the droplets is carried out on a Leica DM2500M light microscope using phase contrast optics.
Hard-sphere simulations
We employ a stochastic inflation packing algorithm inspired by the Lubachevsky-Stillinger algorithm, which is known to yield packings of high coverage fractionLubachevsky1990 . In each packing simulation, a fixed ellipsoidal surface, either prolate or oblate, is chosen with aspect ratio and the length of the semi-minor axis is fixed to be unity in dimensionless units. Particles are modeled as monodisperse hard spheres of radius that is slowly increased during the simulation. The number of particles is specified and particles are deposited at the start of the simulation by random sequential adsorption such that the center of each particle is constrained to lie on the surface of the ellipsoid. Initially, is such that the packing fraction is .
The algorithm proceeds by two kinds of moves: i) Monte Carlo diffusion steps where particles are moved randomly along the surface and ii) inflation steps where the radius of all particles is increased by . In each diffusion step, individual Monte Carlo moves of randomly chosen particles are attempted. The step size is chosen randomly using a Gaussian distribution, as described below. Only moves that do not result in overlap are accepted, with overlaps checked for in the 3D configuration frame.
The moves are performed in the 2D space of conformal surface parameters , hence yielding a radially symmetric probability distribution of moving a certain arclength in any tangential direction from the current location. The surface is parametrized as,
| (7) |
where , for prolate surfaces and , for oblate surfaces. The determinant of the metric is,
| (8) |
and the conformal parameter is given by the integral of the conformal factor,
| (9) |
which can be inverted to find . We do an approximate inversion by calculating for values of from to in increments of and using a high order polynomial least squares fit on these points, enforcing equality between the fit and exact values at the endpoints and . The conformal coordinate is simply .
Given the definitions above, diffusion steps are taken as follows. An unscaled step size is chosen for each direction, and , from a normal distribution with variance 1. These are scaled by the simulation step size and by the inverse of the conformal factor to give step sizes in the conformal space:
| (10) | |||||
| (11) |
These steps are used to update the previous and coordinates of the particle, which are then transformed to the and coordinates as explained above. Finally, the surface parametrization eq. 7 is used give the particle coordinates in the 3D configuration space.
Because must have a value between and , we take the following step if it falls outside this range at any point. If is greater than (less than ), we set () and , i.e. we allow the particle to pass over the coordinate singularity at the poles of the surface.
As the particles diffuse, is varied in order to more efficiently explore relevant areas of configuration space (leading to large steps when the configuration is loosely packed and smaller, more relevant steps when tightly packed.) The initial value of scales with the square root of the ellipsoid surface area , . After each time step, the fraction of attempted moves that were accepted is calculated. The length scale is then decreased by if the acceptance fraction is and increased by 1% otherwise; is reset after each inflation (described below) to its initial value. Bounds are imposed such that . Adjusting leads to improved performance of the algorithm as the particles can diffuse more when they are less densely packed and take smaller steps (which are more likely to be accepted) when they are more densely packed. We do this as it is known that adaptive algorithms lead to packings of higher densityTorquato2010 . We emphasize that in this work the Monte Carlo approach is used as an optimization strategy; it is not intended to, and indeed cannot, replicate the physical process by which the structures form since the updates are non-Markovian.
After diffusion steps, an inflation step is performed where the particle radius is increased slightly (“inflated”) either by a specified fixed amount or by the half of the largest amount allowed that would not result in the overlap of any pair of particles, whichever is smaller.
The halting criteria for these simulations is as follows: every inflation steps, the relative change in coverage fraction is calculated. If this is less than a specified value then the simulation halts.
Soft particle simulations
In order to compare our results regarding scar formation in hard particle packings to other work involving particles with soft interactions, we performed a set of simulations using a modified Monte Carlo algorithm which incorporates a soft interparticle potential. In order to test potentials of different softness, the interparticle potentials are set as either or (where is the center-to-center distance between particles). The particles diffuse similarly to the hard particle simulation with two differences: the average step size is constant for all moves, and moves are accepted or rejected using a Metropolis schemenumerical_recipes , with acceptance probability
| (12) |
where is the change in the system energy after a single particle move. The initial temperature is set by using a rough estimate of what the energy of a single particle in the final configuration will be assuming six-fold ordering and that nearest neighbor interactions dominate: , where is an estimate of the average particle separation. The system is annealed by multiplying the temperature by 0.99 after every 100 sets of diffusion moves until within machine precision. After every 100 sets of diffusion moves, the change in energy is recorded and the simulation halts once this change in energy is less than .
Defect analysis of simulations
To analyze defects in the simulated configurations, we use a ball-pivoting algorithmBernardini1999 in the mesh-generation software Meshlab to generate triangulations of the particle centroids. These triangles are then equiangulated by a custom script to remove narrow triangles. Edges are flipped in random order and accepted if they improve the triangulation; this is repeated until a full sweep of the mesh yields no further improvements. From these optimized triangulations, the coordination number of each particle is given by the number of particles to which it is connected.
References
- (1) Weiss, T. H, Mills, a. L, Hornberger, G. M, & Herman, J. S. (1995) Effect of bacterial cell shape on transport of bacteria in porous media. Environmental science & technology 29, 1737–40.
- (2) Champion, J. A & Mitragotri, S. (2006) Role of target geometry in phagocytosis. Proceedings of the National Academy of Sciences of the United States of America 103, 4930–4934.
- (3) Gratton, S. E. A, Ropp, P. A, Pohlhaus, P. D, Luft, J. C, Madden, V. J, Napier, M. E, & DeSimone, J. M. (2008) The effect of particle design on cellular internalization pathways. Proceedings of the National Academy of Sciences of the United States of America 105, 11613–11618.
- (4) Donev, A, Cisse, I, Sachs, D, Variano, E. A, Stillinger, F. H, Connelly, R, Torquato, S, & Chaikin, P. (2004) Improving the density of jammed disordered packings using ellipsoids. Science (New York, N.Y.) 303, 990–993.
- (5) Nelson, D. R. (2002) Toward a Tetravalent Chemistry of Colloids. Nano Letters 2, 1125–1129.
- (6) Pickering, S. U. (1907) Emulsions. Journal of the Chemical Society 91, 2001–2021.
- (7) Binks, B. P. (2002) Particles as surfactants - similarities and differences. Current Opinion in Colloid & Interface Science 7, 21–41.
- (8) Cui, M, Emrick, T, & Russell, T. (2013) Stabilizing Liquid Drops in Nonequilibrium Shapes by the Interfacial Jamming of Nanoparticles. Science 342, 460–463.
- (9) Pawar, A. B, Caggioni, M, Ergun, R, Hartel, R. W, & Spicer, P. T. (2011) Arrested coalescence in Pickering emulsions. Soft Matter 7, 7710–7716.
- (10) Cheng, H.-L & Velankar, S. S. (2009) Controlled jamming of particle-laden interfaces using a spinning drop tensiometer. Langmuir : the ACS journal of surfaces and colloids 25, 4412–20.
- (11) Dinsmore, A, Hsu, M. F, Nikolaides, M, Marquez, M, Bausch, A, & Weitz, D. (2002) Colloidosomes: selectively permeable capsules composed of colloidal particles. Science (New York, N.Y.) 298, 1006–1009.
- (12) Seung, H & Nelson, D. (1988) Defects in flexible membranes with crystalline order. Physical Review A 38, 1005–1018.
- (13) Pérez-Garrido, A, Dodgson, M, & Moore, M. (1997) Influence of dislocations in Thomson’s problem. Physical Review B 56, 3640–3643.
- (14) Bowick, M, Nelson, D, & Travesset, A. (2000) Interacting topological defects on frozen topographies. Physical Review B 62, 8738–8751.
- (15) Bowick, M & Travesset, A. (2001) The geometrical structure of 2D bond-orientational order. Journal of Physics A: Mathematical and General 34, 1535–1548.
- (16) Bausch, A, Bowick, M, Cacciuto, A, Dinsmore, A, Hsu, M, Nelson, D, Nikolaides, M, Travesset, A, & Weitz, D. (2003) Grain boundary scars and spherical crystallography. Science (New York, N.Y.) 299, 1716–1718.
- (17) Einert, T, Lipowsky, P, Schilling, J, Bowick, M. J, & Bausch, A. R. (2005) Grain boundary scars on spherical crystals. Langmuir : the ACS journal of surfaces and colloids 21, 12076–12079.
- (18) Vitelli, V, Lucks, J, & Nelson, D. (2006) Crystallography on curved surfaces. Proceedings of the National Academy of Sciences of the United States of America 103, 12323–12328.
- (19) Giomi, L & Bowick, M. (2007) Crystalline order on Riemannian manifolds with variable Gaussian curvature and boundary. Physical Review B 76, 054106.
- (20) Giomi, L & Bowick, M. (2008) Defective ground states of toroidal crystals. Physical Review E 78, 010601.
- (21) Irvine, W. T. M, Vitelli, V, & Chaikin, P. M. (2010) Pleats in crystals on curved surfaces. Nature 468, 947–951.
- (22) Bendito, E, Bowick, M. J, Medina, A, & Yao, Z. (2013) Crystalline particle packings on constant mean curvature (Delaunay) surfaces. Physical Review E 88, 012405.
- (23) Hilton, P & Pedersen, J. (1996) The Euler Characteristic and Polya’s Dream. The American Mathematical Monthly 103, 121–131.
- (24) Kralchevsky, P. A & Nagayama, K. (2000) Capillary interactions between particles bound to interfaces, liquid films and biomembranes. Advances in Colloid and Interface Science 85, 145–192.
- (25) Roos, W, Bruinsma, R, & Wuite, G. (2010) Physical virology. Nature Physics 6, 733–743.
- (26) Manoharan, V. N, Elsesser, M. T, & Pine, D. J. (2003) Dense Packing and Symmetry in Small Clusters of Microspheres. Science (New York, N.Y.) 301, 483–487.
- (27) Landau, L. D & Lifshitz, E. M. (1980) Statistical Physics. (Butterworth-Heinemann).
- (28) Wood, D, Santangelo, C, & Dinsmore, A. (2013) Self-assembly on a cylinder: a model system for understanding the constraint of commensurability. Soft Matter 9, 10016–10024.
- (29) Tjahjadi, M, Ottino, J. M, & Stone, H. a. (1994) Estimating interfacial tension via relaxation of drop shapes and filament breakup. AIChE Journal 40, 385–394.
- (30) Lubachevsky, B & Stillinger, F. (1990) Geometric properties of random disk packings. Journal of Statistical Physics 60, 561–583.
- (31) Torquato, S & Jiao, Y. (2010) Robust algorithm to generate a diverse class of dense disordered and ordered sphere packings via linear programming. Physical Review E - Statistical, Nonlinear, and Soft Matter Physics 82, 1–14.
- (32) Flannery, B. P, Teukolsky, S, Press, W. H, & Vetterling, W. T. (2007) Numerical Recipes in C: The Art of Scientific Computing. (Cambridge University Press).
- (33) Bernardini, F, Mittleman, J, Rushmeier, H, Silva, C, & Taubin, G. (1999) The ball-pivoting algorithm for surface reconstruction. IEEE Transactions on Visualization and Computer Graphics 5, 349–359.