EMBRACE@Nançay: An Ultra Wide Field of View Prototype for the SKA
Abstract
A revolution in radio receiving technology is underway with the development of densely packed phased arrays for radio astronomy. This technology can provide an exceptionally large field of view, while at the same time sampling the sky with high angular resolution. Such an instrument, with a field of view of over 100 square degrees, is ideal for performing fast, all-sky, surveys, such as the “intensity mapping” experiment to measure the signature of Baryonic Acoustic Oscillations in the HI mass distribution at cosmological redshifts. The SKA, built with this technology, will be able to do a billion galaxy survey. I will present a very brief introduction to radio interferometry, as well as an overview of the Square Kilometre Array project. This will be followed by a description of the EMBRACE prototype and a discussion of results and future plans.
keywords:
radio astronomy; interferometry; Square Kilometre Array1 Introduction
The Square Kilometre Array (SKA) [2] will be the largest radio astronomy facility ever built with more than 10 times the equivalent collecting area of currently available facilities. The SKA will primarily be a survey instrument with exquisite sensitivity and an extensive field of view providing an unprecedented mapping speed. This capability will enormously advance our understanding in fundamental physics including gravitation, the formation of the first stars, the origin of magnetic fields, and it will give us a new look at the Universe in the time domain with a survey of transient phenomena.
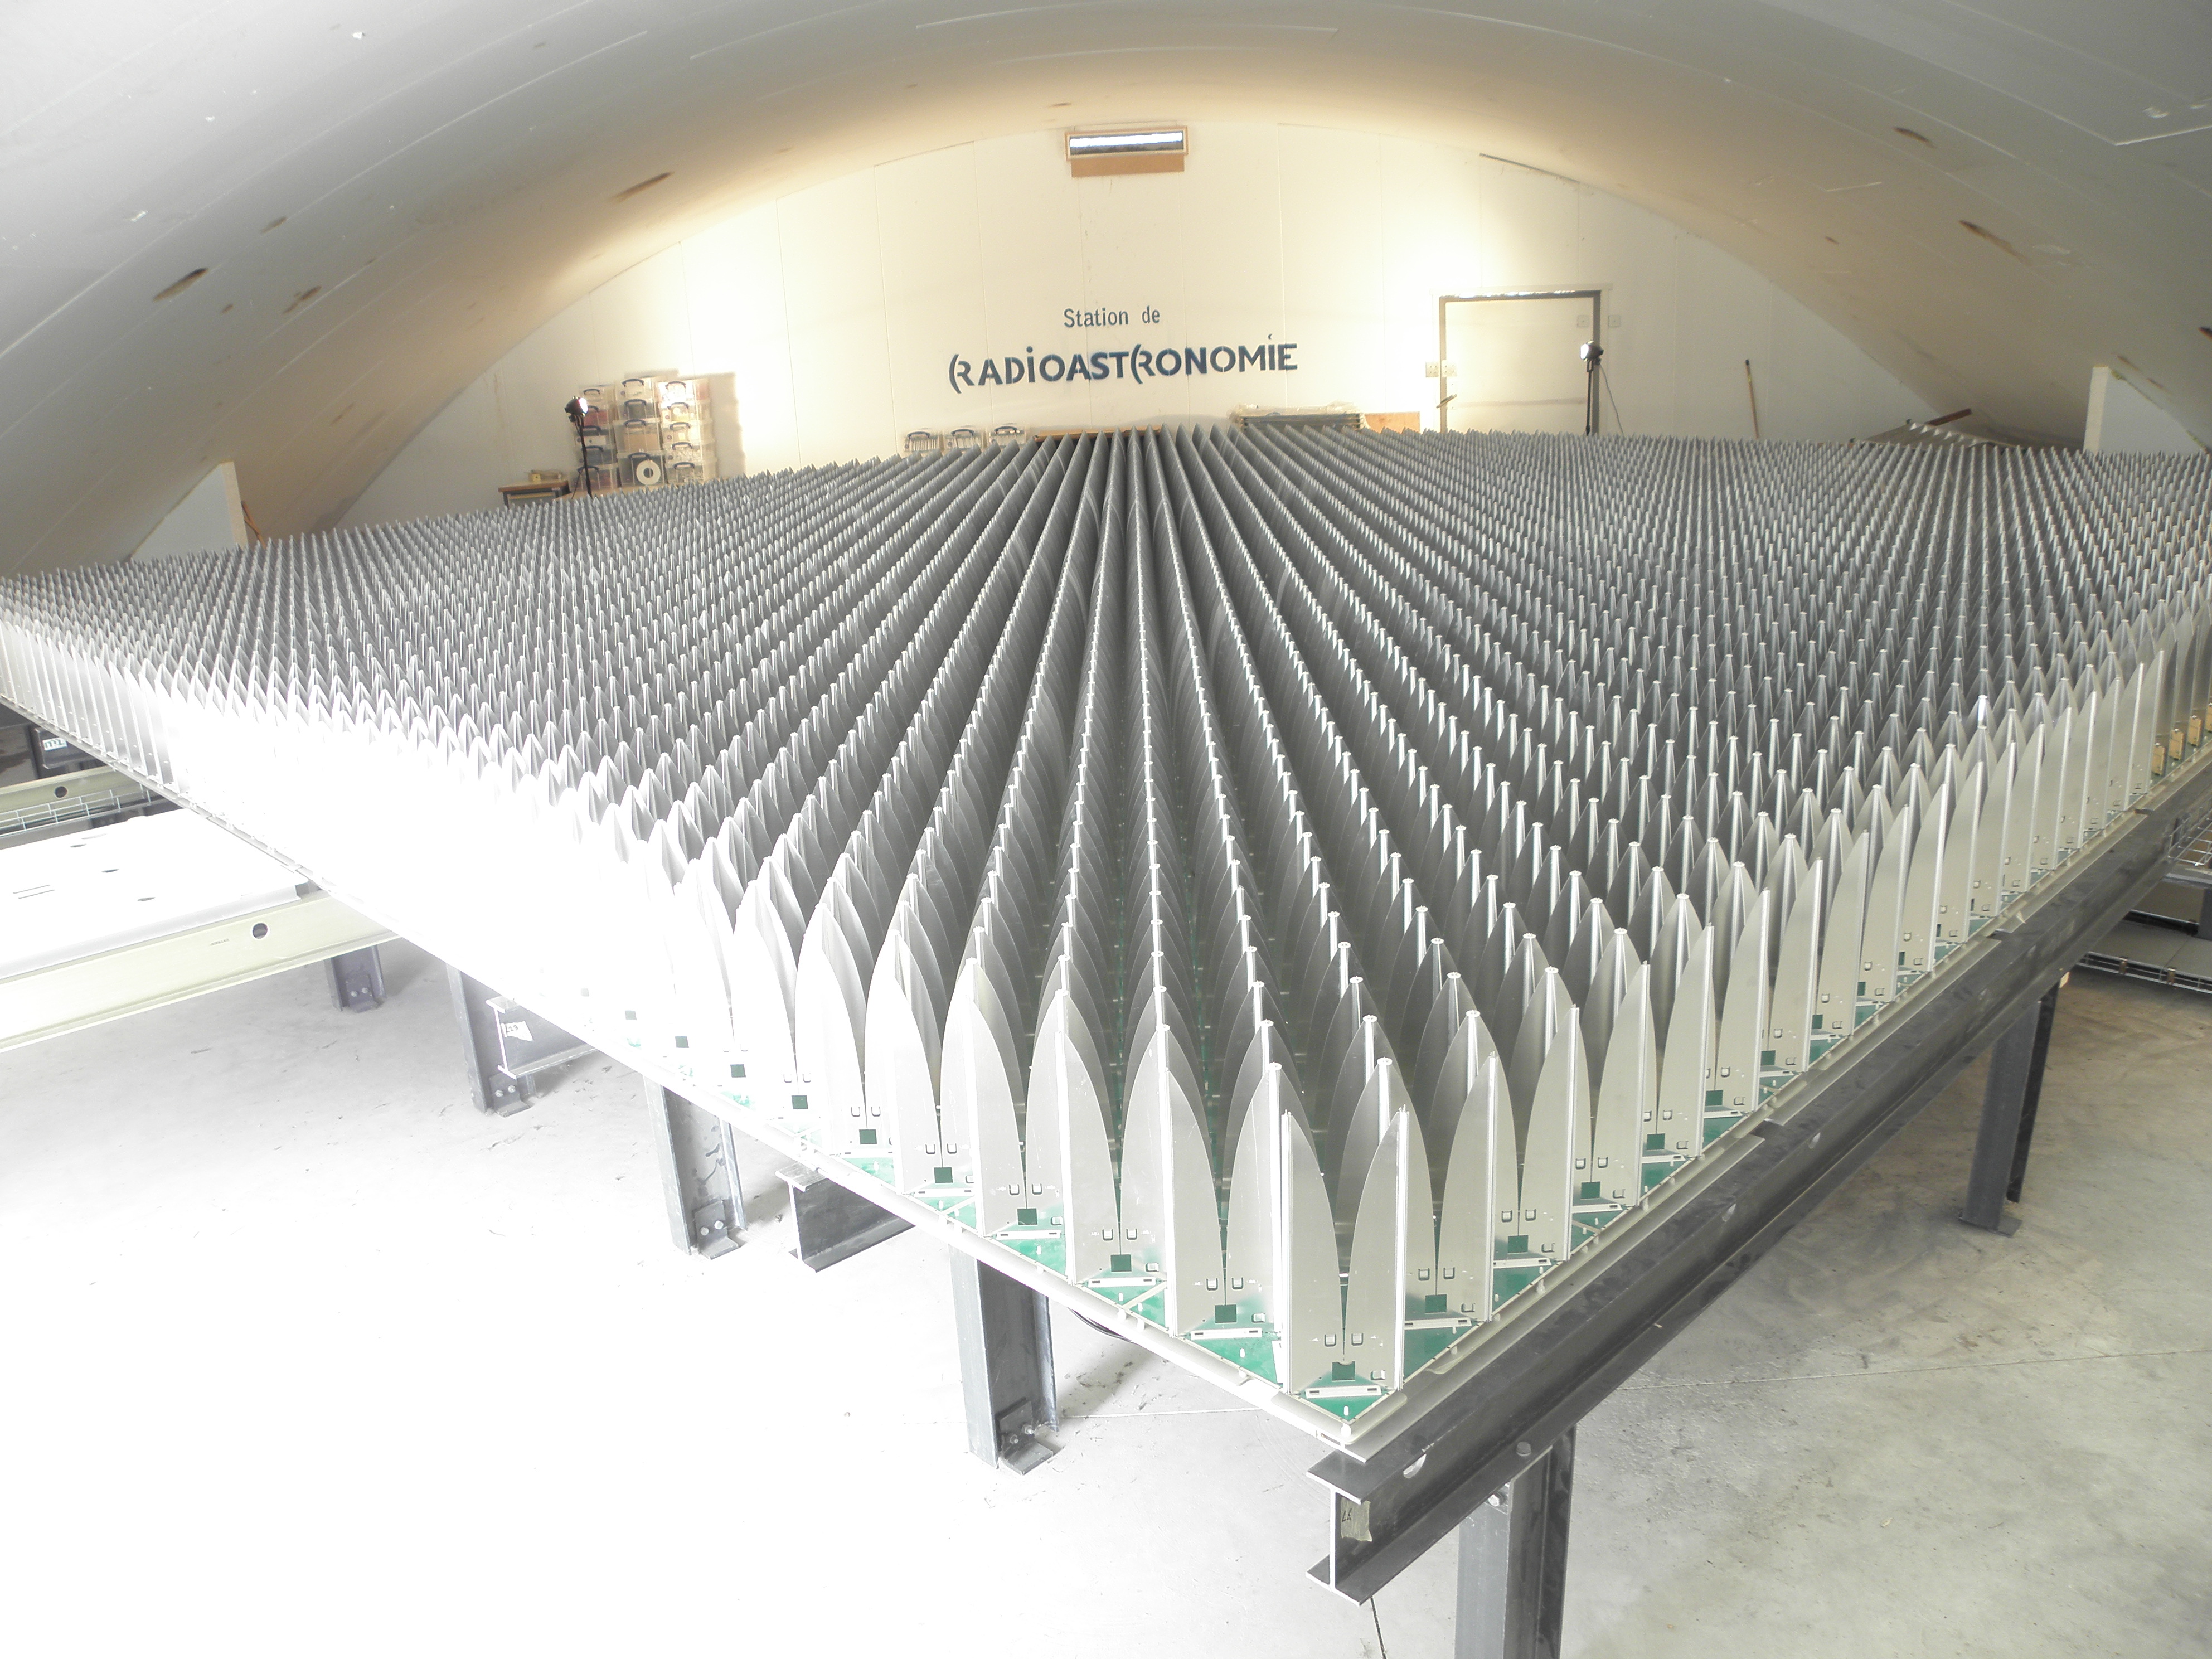
A revolution in radio receiving technology is underway with the development of densely packed phased arrays. This technology can provide an exceptionally large field of view, while at the same time sampling the sky with high angular resolution. In addition to vastly increased survey speed compared to traditional dish interferometers, the aperture array technology provides the operational advantage associated with a structure having no moving parts. This is an important consideration for the long term maintenance and operation of a very large scale instrument like the SKA. The Nançay radio observatory is a major partner in the development of dense phased arrays for radio astronomy, working closely with The Netherlands Institute for Radio Astronomy (ASTRON). The joint project is called EMBRACE (Electronic MultiBeam Radio Astronomy Concept). Two EMBRACE prototypes have been built. One at Westerbork in The Netherlands, and one at Nançay (see Figure 1). The EMBRACE prototypes are recognized as “Pathfinders” for the SKA project and both of them are currently being extensively characterized and tested at the two sites. Conclusions from the EMBRACE testing will directly feed into the SKA and will have a decisive impact on whether or not dense array technology is used for the SKA.
The date for selection of technology for the SKA is 2016. If dense arrays are not selected for the SKA, then the SKA will have a much reduced mapping speed compared to what has come to be expected by the astronomical community. It is therefore of crucial strategic importance that work on EMBRACE succeeds in showing the viability of dense arrays for radio astronomy.
The two EMBRACE stations began with an initial period of engineering testing on the partially complete arrays [3, 4]. EMBRACE@Nançay has been fully operational since 2011 and now performs regularly scheduled astronomical observations such as pulsar observations and extragalactic spectral line observing [5]. EMBRACE system characteristics such as beam main lobe and system temperature are behaving as expected. EMBRACE has long term stability, and after four years of operation continues to prove itself as a robust and reliable system capable of sophisticated radio astronomy observations.
2 Science Goals for SKA using EMBRACE Technology
Aperture Arrays are the enabling technology which will lead to fulfilling the promise of SKA as a transformational survey machine. The Field of View offered by an aperture array is well beyond that possible with any other technology. At the frequencies in the mid range of SKA, an aperture array based on EMBRACE technology will have a Field of View on the order of 100 square degrees. It is primarily the science objectives which require large surveys of the sky which will benefit most from the aperture array technology.
The speed at which the sky can be mapped depends on the sensitivity of the instrument and also on the field of view. It is possible to be equally fast with a very sensitive telescope and a small field of view, compared to a less sensitive telescope with a large field of view. The parameter known as the “survey speed” measures how fast a telescope can survey the sky, but there is a basic assumption that the sky does not change, and repointing the telescope to fill-in the map can be done at any time. This is not the case for a study of transient phenomena.
2.1 Dark Energy
The original science driver for the SKA is the measurement of the mass distribution at cosmological epochs by tracing the neutral hydrogen gas (HI) at different redshifts [6]. Neutral hydrogen is the most abundant material in the Universe, and a survey of its distribution clearly gives information on the overall geometry and evolution of the Universe. However, the signal from HI is very weak, and the radio sky is very noisy, and the only way to detect weak signals in a noisy background is to have an extremely sensitive telescope. This fact was already recognized nearly fifty years ago by Heidmann [7]. Heidmann not only understood the importance of detecting HI at cosmological distances, but he also calculated that a radio telescope of nearly a square kilometre collecting area was necessary to detect nearly a million extragalactic sources. This remains the primary objective of the Square Kilometre Array.
With the discovery that the Universe is expanding at an accelerating rate [8], the quest to understand Dark Energy became preeminent in the physics community. The effect of Dark Energy on the geometry of the Universe can be traced by detections of the signature of Baryonic Acoustic Oscillations (BAO) in measurements of the galaxy distribution at different cosmological epochs [9]. The galaxy distribution can be measured using radio emission at the wavelength of 21 cm produced during hyperfine transition of neutral hydrogen, and this has the advantage of measuring both the position and redshift of galaxies in a single observation, making the SKA the most reliable instrument to perform the so-called “wiggles” experiment [6].
A galaxy survey in the redshift range between z=0.5 to z=3 is optimum for the BAO experiment. This corresponds to frequencies in the range 350 MHz to 1000 MHz, and continues naturally from the optimum high frequency of the SKA Low Frequency Aperture Array.
Moreover, a field of view on the order of 100’s of square degrees, and high angular resolution given by the km baseline, makes the SKA mid frequency aperture array the only instrument capable of performing this experiment after only a few years observing. The SKA catalog of over a billion galaxies, with both their angular position and redshift, will be the ultimate database for BAO analysis. This will give exquisite constraints on the Equation of State of the Universe, and may well indicate that Einstein’s Theory of General Relativity, together with a Cosmological Constant, is insufficient to explain Dark Energy.
An intermediate experiment can be performed to make a statistical detection of the BAO signature using the “Intensity Mapping” technique [10, 11]. Instead of detecting individual galaxies, and creating a catalog from which to perform the analysis, it is sufficient to map the distribution of HI at different epochs (i.e. different frequency bins). The method is analogous to the observational method used in Cosmology on measurements of the anisotropy of the Cosmic Microwave Background. The gas content in the volume covered by a telescope beam in a given frequency band (i.e. redshift bin) is correlated with measurements across the entire sky giving a statistical detection of the BAO signature in the power spectrum. In this case, an equivalent collecting area of several thousand square metres gives sufficient sensitivity to perform the experiment provided the sky can be mapped rapidly (i.e. multibeam observations, see [12]). A beamsize on the order of a few arcminutes is sufficent angular resolution, and indeed, to measure the first peak in the BAO signature, a beamsize of 1 degree is all that is necessary.
An precursor to the mid frequency aperture array would be ideally suited to do the HI Intensity Mapping experiment. Such an instrument would have a collecting area of several thousand square metres, possibly organized in stations, and confined to a core within a diameter of a few hundred metres. The mid frequency aperture array precursor, operational in the same timeline as SKA Phase 1, could potentially deliver the first detection of BAO, directly detected in HI which is the primordial material of the Universe.
2.2 Pulsars and Transients
Pulsar science can be broadly categorized into two areas: searches for new pulsars and studies of known pulsars. Searches rely on two things, raw sensitivity and sky coverage, which a dense aperture array can provide as described already. Studies of known pulsars, also commonly referred to as timing, rely on additional properties of the array, such as timing/clock stability and polarization purity. These are essential parameters for using pulsar observations as tests of theories of gravitation [13]. Clock stability has already been demonstrated on the LOFAR high-band antennas. Polarization purity is a topic of active study, to ensure that observations off the dipole axis are still calibratable to the extent required for pulsar timing.
The main advantage of a dense aperture array comes in its ability to form large numbers of tied array beams across the sky. This would allow a very efficient pulsar timing programme of newly discovered millisecond pulsars, alleviating the issues faced by dish arrays that can only simultaneously form tied-array beams within the primary beam of a dish (see for example [14]).
The sky is filled with sources which are periodic, such as pulsars, or are one-time catastrophic events such as merger events, accretion events, supernovae, (see eg. [13, 15]) or the enigmatic “Fast Radio Bursts” first discovered by Lorimer et al. [16] (see also [17]). In order to observe such an event, the telescope must be pointing in the right direction at the right time. It’s not possible to move the telescope around to “fill-in” the sky. The only way to maximize the likelihood of detecting a transient event is to point as long as possible in as many directions as possible, or in other words, to have a very large field of view. A large, dense aperture array using EMBRACE type technology is therefore the ideal instrument to make a survey of transient events.
2.3 The Unknown
Opening up phase space leads to new discoveries [18] and in fact, most telescopes have made unexpected discoveries completely outside the domain for which they were designed [19].
The “exploration of the unknown” is more than just an exploration of the time domain. The aperture array technology provides an improvement all across parameter-space: spectral coverage, field of view, time domain. There may well be surprises not only in time varying sources, but also in unexplored parts of the spectrum, and in correlation across the sky. An example from history is the discovery of the cosmic microwave background. It was not identified until it was measured across the sky, even though we can see now that there were in fact measurements of the CMB as early as 1940 [20], well before the famous detection by Penzias & Wilson in 1965 [21], but pointed measurements were not enough to make people see that something important had been measured. It had to be seen at many, widely separated, positions on the sky. The wide field of view of aperture arrays may well come up with similar surprises in the future, which are not necessarily time domain related.
3 A Very Brief Reminder of Interferometry
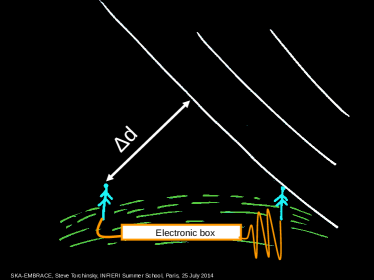
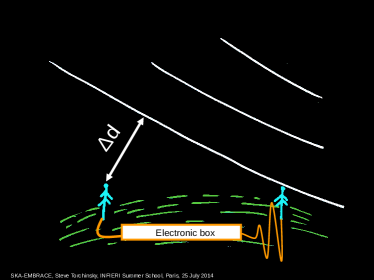
The basic principle of interferometry is the combination of signals from different antennas in such a way that the result is effectively an instrument with a total collecting area equivalent to the combined areas of all the antennas involved, and pointed in the desired direction. Figure 2 illustrates how this can be done in the simplest case of two antennas. A plane wave from a distant source arrives at the Earth and the wavefront is first detected by one antenna, and then by the next one. The difference in the path length between the two receivers is dependent on the direction of arrival of the incident wavefront. The path length difference can be compensated in electronics simply by adding a length of cable corresponding to the desired path length difference. By switching in and out cables of different lengths, the array of antennas are effectively pointing in different directions. This is called “beamforming”.
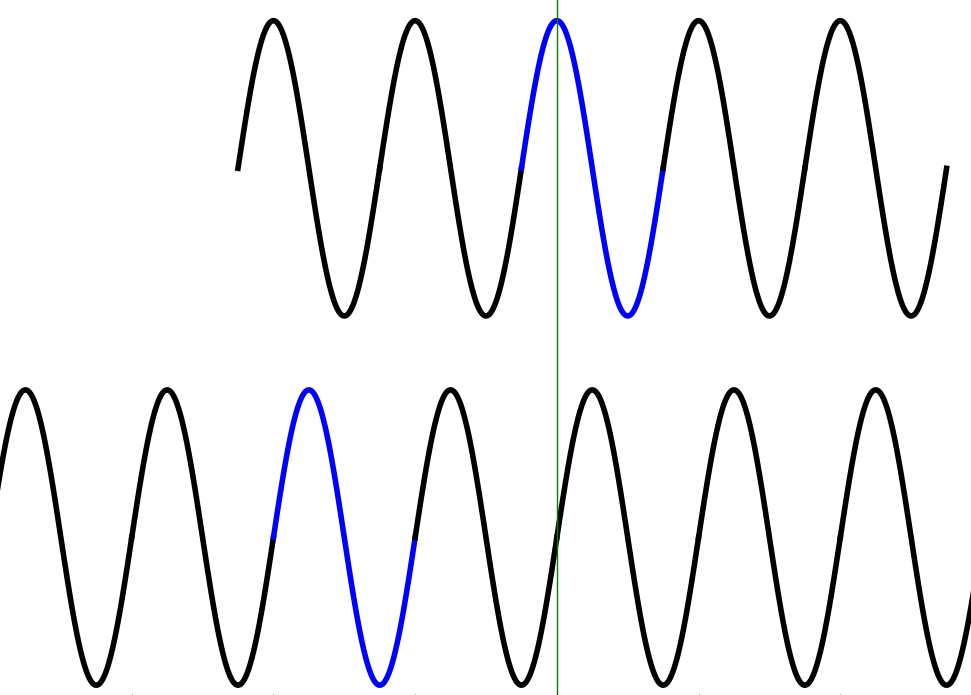
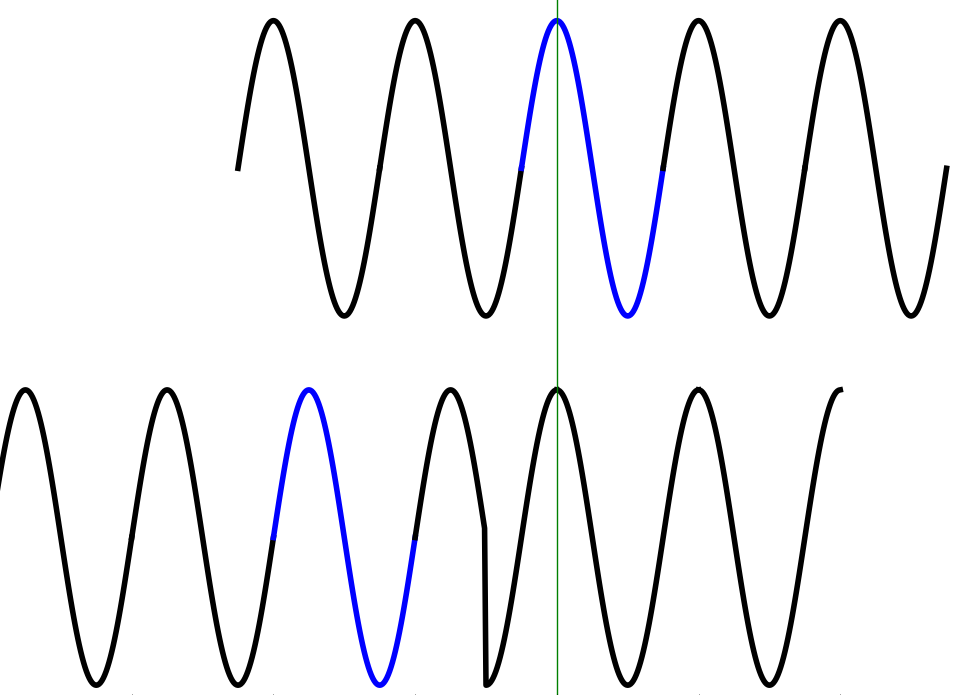
Instead of switching in and out cables, it is possible to make an electronic circuit which makes a phase shift on the signal. Figure 3 shows two signals which are not in phase. Figure 4 shows a phase shift applied to the second signal such that the signals are in phase and can be combined. We note however that the signals are combined but not at the same wavefront (shown in blue). This is permitted as long as the separation between the wavefronts is within the “coherence length” which is defined as the inverse of the bandpass multiplied by the speed of light. For EMBRACE with frequency channels of 195 kHz, the coherence length is on the order of 1.5 km, so using phase shifting instead of a delay line is permitted.
For a detailed introduction and explanation of radio interferometry and aperture synthesis, the reader is strongly recommended to refer to the book by Thompson, Moran, and Swenson [22].
4 EMBRACE System Description
EMBRACE@Nançay is a phased-array of 4608 densely packed antenna elements (64 tiles of 72 elements each). For mechanical, and electromagnetic performance reasons, EMBRACE@Nançay has, in fact, 9216 antenna elements, but only one polarization (4608 elements) have fully populated signal chains. The orientation of the linear polarized elements at Nançay is with the electric field sensitivity in the North-South direction. For more details on EMBRACE architecture see [23, 24]
4.1 Hierarchical Analogue Beam Forming
EMBRACE@Nançay uses a hierarchy of four levels of analogue beamforming leading to 16 inputs to the LOFAR [25] backend system used for digital beamforming.
The first level of beamforming is done for four Vivaldi elements within the integrated circuit “beamformer chip” developed at Nançay [26]. This chip applies the phase shifts necessary to four antenna elements to achieve pointing in the desired direction. The phase shift required for each Vivaldi element is calculated from the array geometry of a tile for a given pointing direction [27].
The beamformer chip forms two independent beams for each set of four antenna elements. The beamformer chip splits the analogue signal from the antennas into two signals and then applies different sets of phase shift parameters to each signal. The beamformer chip therefore has four inputs for four Vivaldi antennas, and two independent outputs. The independent outputs is what makes it possible for EMBRACE to have two independent Fields of View, often referred to as “RF Beams”, which are named Beam-A and Beam-B.
The output of 3 beamformer chips is summed together on a “hexboard” and 6 hexboards make a tile. The EMBRACE array at Nançay has a further analog summing stage with 4 tiles making a tileset. This final stage is done on the Control and Down Conversion (CDC) card in the shielded container which is connected to the tiles via 25 m long coaxial cables.
4.2 Control and Down Conversion
The CDC cards are responsible for three important tasks [28, 29]: 1) Frequency mixing the Radio Frequency (RF) for conversion to a 100 MHz bandwidth centred at 150 MHz; 2) 48 Volt Power distribution to the tiles; 3) Distribution of command and housekeeping data communication to the tiles. The RF, 48 Volt power supply, and ethernet protocol monitoring and control communication are all multiplexed on the coaxial cables connecting the tiles to the CDC cards [30].
4.3 Digital Processing
The output of the tilesets is fed into a LOFAR-type digital Receiver Unit (RCU) and Remote Station Processing (RSP) system for digital beamforming [31]. The RSP performs the digital beamforming of the entire array, producing pencil beams which are usually called “digital beams” in LOFAR parlance. These digital beams can have pointings within the beam produced by the individual inputs to the RCU. For EMBRACE@Nançay, the inputs to each RCU is the signal from a tileset with a beam width of approximately 8.5∘.
EMBRACE is a single polarization instrument but the LOFAR RSP system has the capacity to produce two outputs per digital beam which correspond to the two orthogonal linear polarizations in LOFAR. These are called the “X” and “Y” beams. For EMBRACE, “X” and “Y” are two, possibly different, pointing directions within the field of view (the RF beam).
Fast data acquisition from the RSP boards is done by the backend called the Advanced Radio Transient Event Monitor and Identification System (ARTEMIS) developed at Oxford University [32].
The ARTEMIS hardware is also used for recording raw data packets from the RSP boards giving the digitized beam formed wavefront data. This is used for the high spectral resolution observation of the extra galactic source M33.
4.3.1 Statistics Data
In addition to the high rate beamformed data produced by the RSP system, there are also slower cadence data produced at a rate of once per second: the crosslet statistics, the beamlet statistics, and the subband statistics.
The LOFAR RCU system digitizes and channelizes the 100 MHz wide RF bandpass into 512 so-called subbands, each of 195.3125 kHz bandwidth. The cross correlations of all tilesets are calculated once per second and are called crosslets. The default mode of operation for LOFAR is to calculate the crosslets for each subband in succession such that it takes 512 seconds to cycle through the full RF band.
Another possibility is to request a given subband, and the crosslets are calculated each second for the same subband. This is the mode of operation used most often at EMBRACE@Nançay. The subband statistics is simply the 100 MHz bandpass for each tileset. The beamlet statistics, called beamlets, are the beamformed data for the full array (16 inputs for EMBRACE@Nançay) dumped at 1 second intervals, and are identical to the fast data integrated over 1 second.
4.4 EMBRACE Monitoring and Control Software
The Monitoring and Control software for EMBRACE was developed at Nançay. An extensive Python package library on the SCU (Station Control Unit) computer gives scripting functionality for users to easily setup and run observations depending on e.g. type of the target. Integrated statistics data are acquired from the LCU (Local Control Unit) and saved into FITS files including header information with essential meta data including pointing information, timestamp, frequencies, etc. Raw data (beamlets) are captured from LCU Ethernet 1 Gbps outputs and saved into binary files [33].
5 Observations with EMBRACE@Nançay
5.1 Multibeams with EMBRACE@Nançay
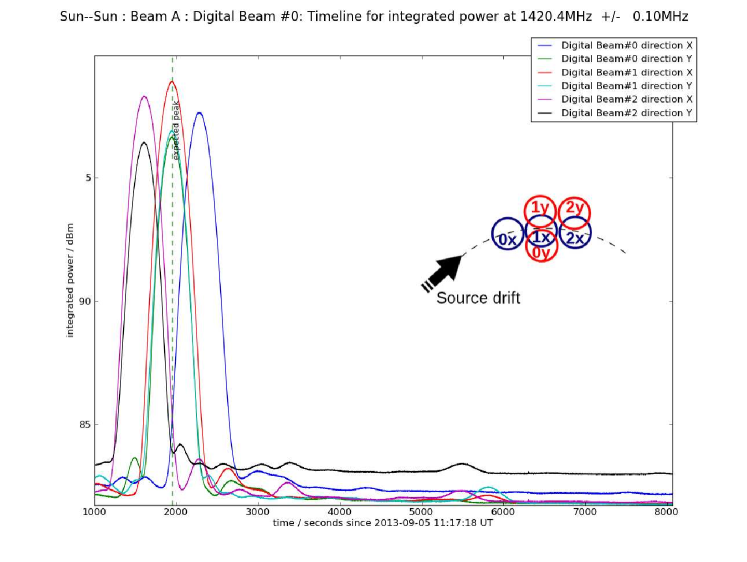
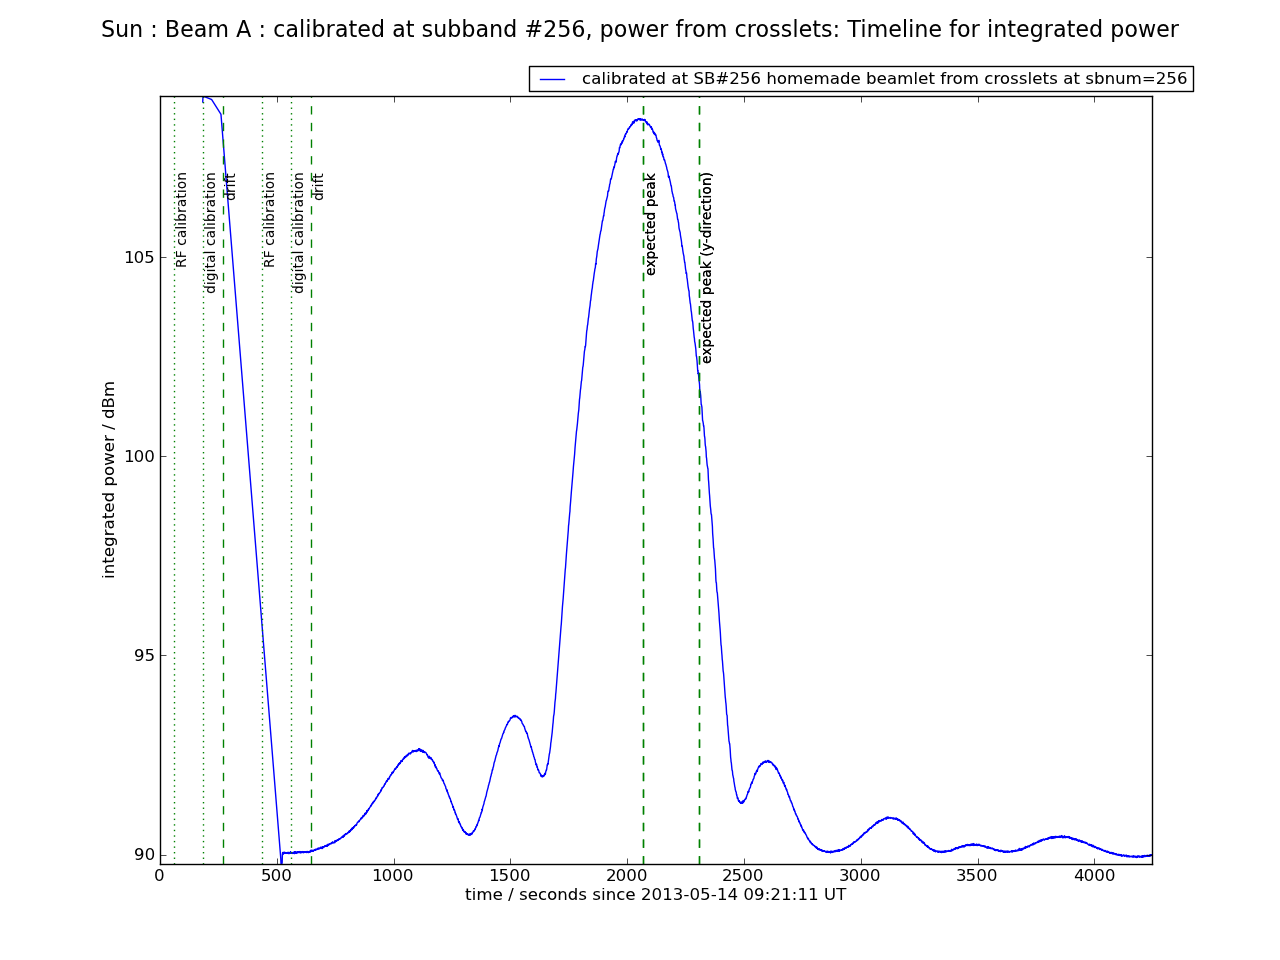
Figure 5 shows a drift scan of the Sun using the multibeam capability of EMBRACE@Nançay. Six beams were pointed on the sky along the trajectory of the Sun, including three partially overlapping beams. The result shows the Sun entering and exiting each beam and the off-pointed beams are 3 dB down from the peak, as expected.
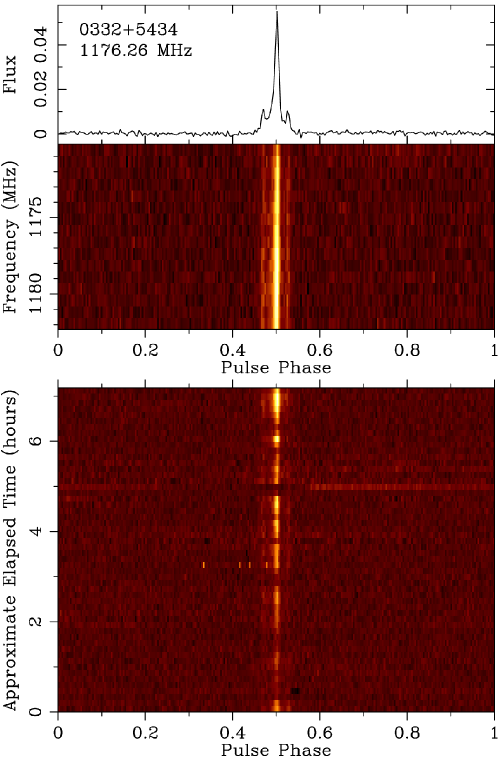
5.2 Pulsar B0329+54
Figure 7 demonstrates over 9 hours of tracking the pulsar B0329+54. Its pulsed signal is clearly detected after several minutes, and the array continues tracking, measuring continuously the pulsar, except where RFI has been filtered at 21500 seconds. The array was configured with a bandwidth of 12 MHz (62 beamlets) centred at 1176.45 MHz.
In November 2013, EMBRACE@Nançay began a long term campaign of observation of pulsar B0329+54. EMBRACE@Nançay has been running autonomously, and performing the pulsar observation every day. Figure 8 shows the Dispersion Measure (DM) towards B0329+54 as determined during each daily observation over the course of 16 months. The annual variation of DM is consistent with what is expected by the Doppler Effect due to the movement of the Earth in orbit around the Sun.
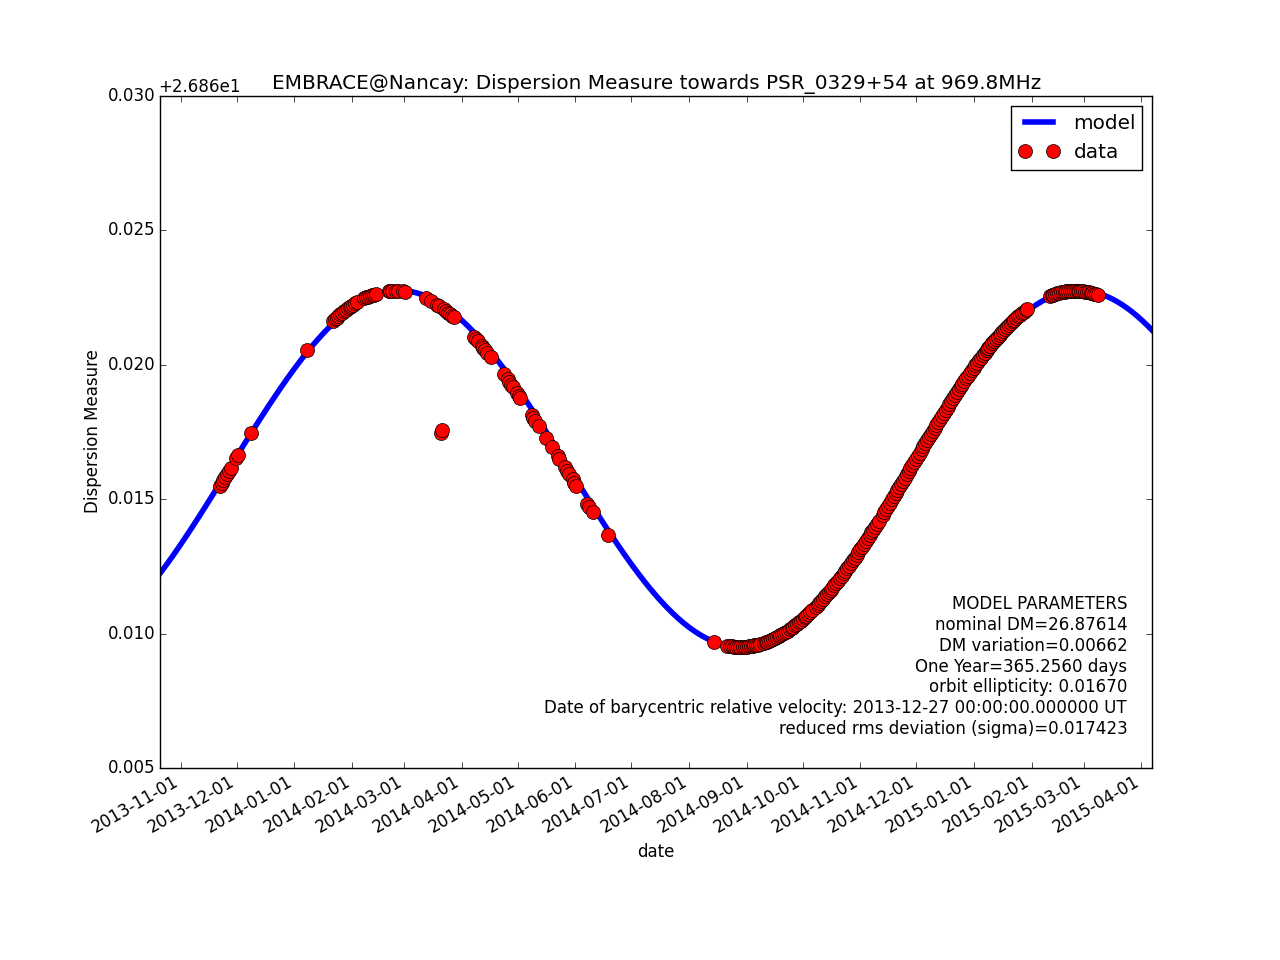
Radiation traveling through the Interstellar Medium (ISM) between a source object, such as a pulsar, and the Earth, is subject to a retarding effect due to the plasma in interstellar space. The ISM behaves as a refractive medium which is slowing the propagation of the electromagnetic wave in a manner which is inversely dependent on the square of the frequency (see for example [36]).
The movement of the Earth due to its orbit around the Sun introduces a Doppler Effect which modifies the signal frequency measured at the telescope compared to its value in the ISM.
The delay between reception of the high and low frequencies is also subject to the Doppler effect due to the Earth’s motion. The Earth is “catching up” or “moving away” from the signal, and so the time between reception of the high and low frequencies is reduced or delayed.
The value of the Dispersion Measure varies throughout the year due to the Earth’s orbit around the Sun
as a function of the projected velocity onto the line of site to the pulsar. Taking the Earth’s elliptical orbit into consideration, and the direction of pulsar B0329+54, gives a variation of Dispersion Measure of 0.0066 on a nominal value of . The model and data points are plotted in Figure 8. Dispersion Measure was calculated from the ARTEMIS filterbank files using the PRESTO suite of tools [37].
5.3 The Triangulum Galaxy: Messier 33
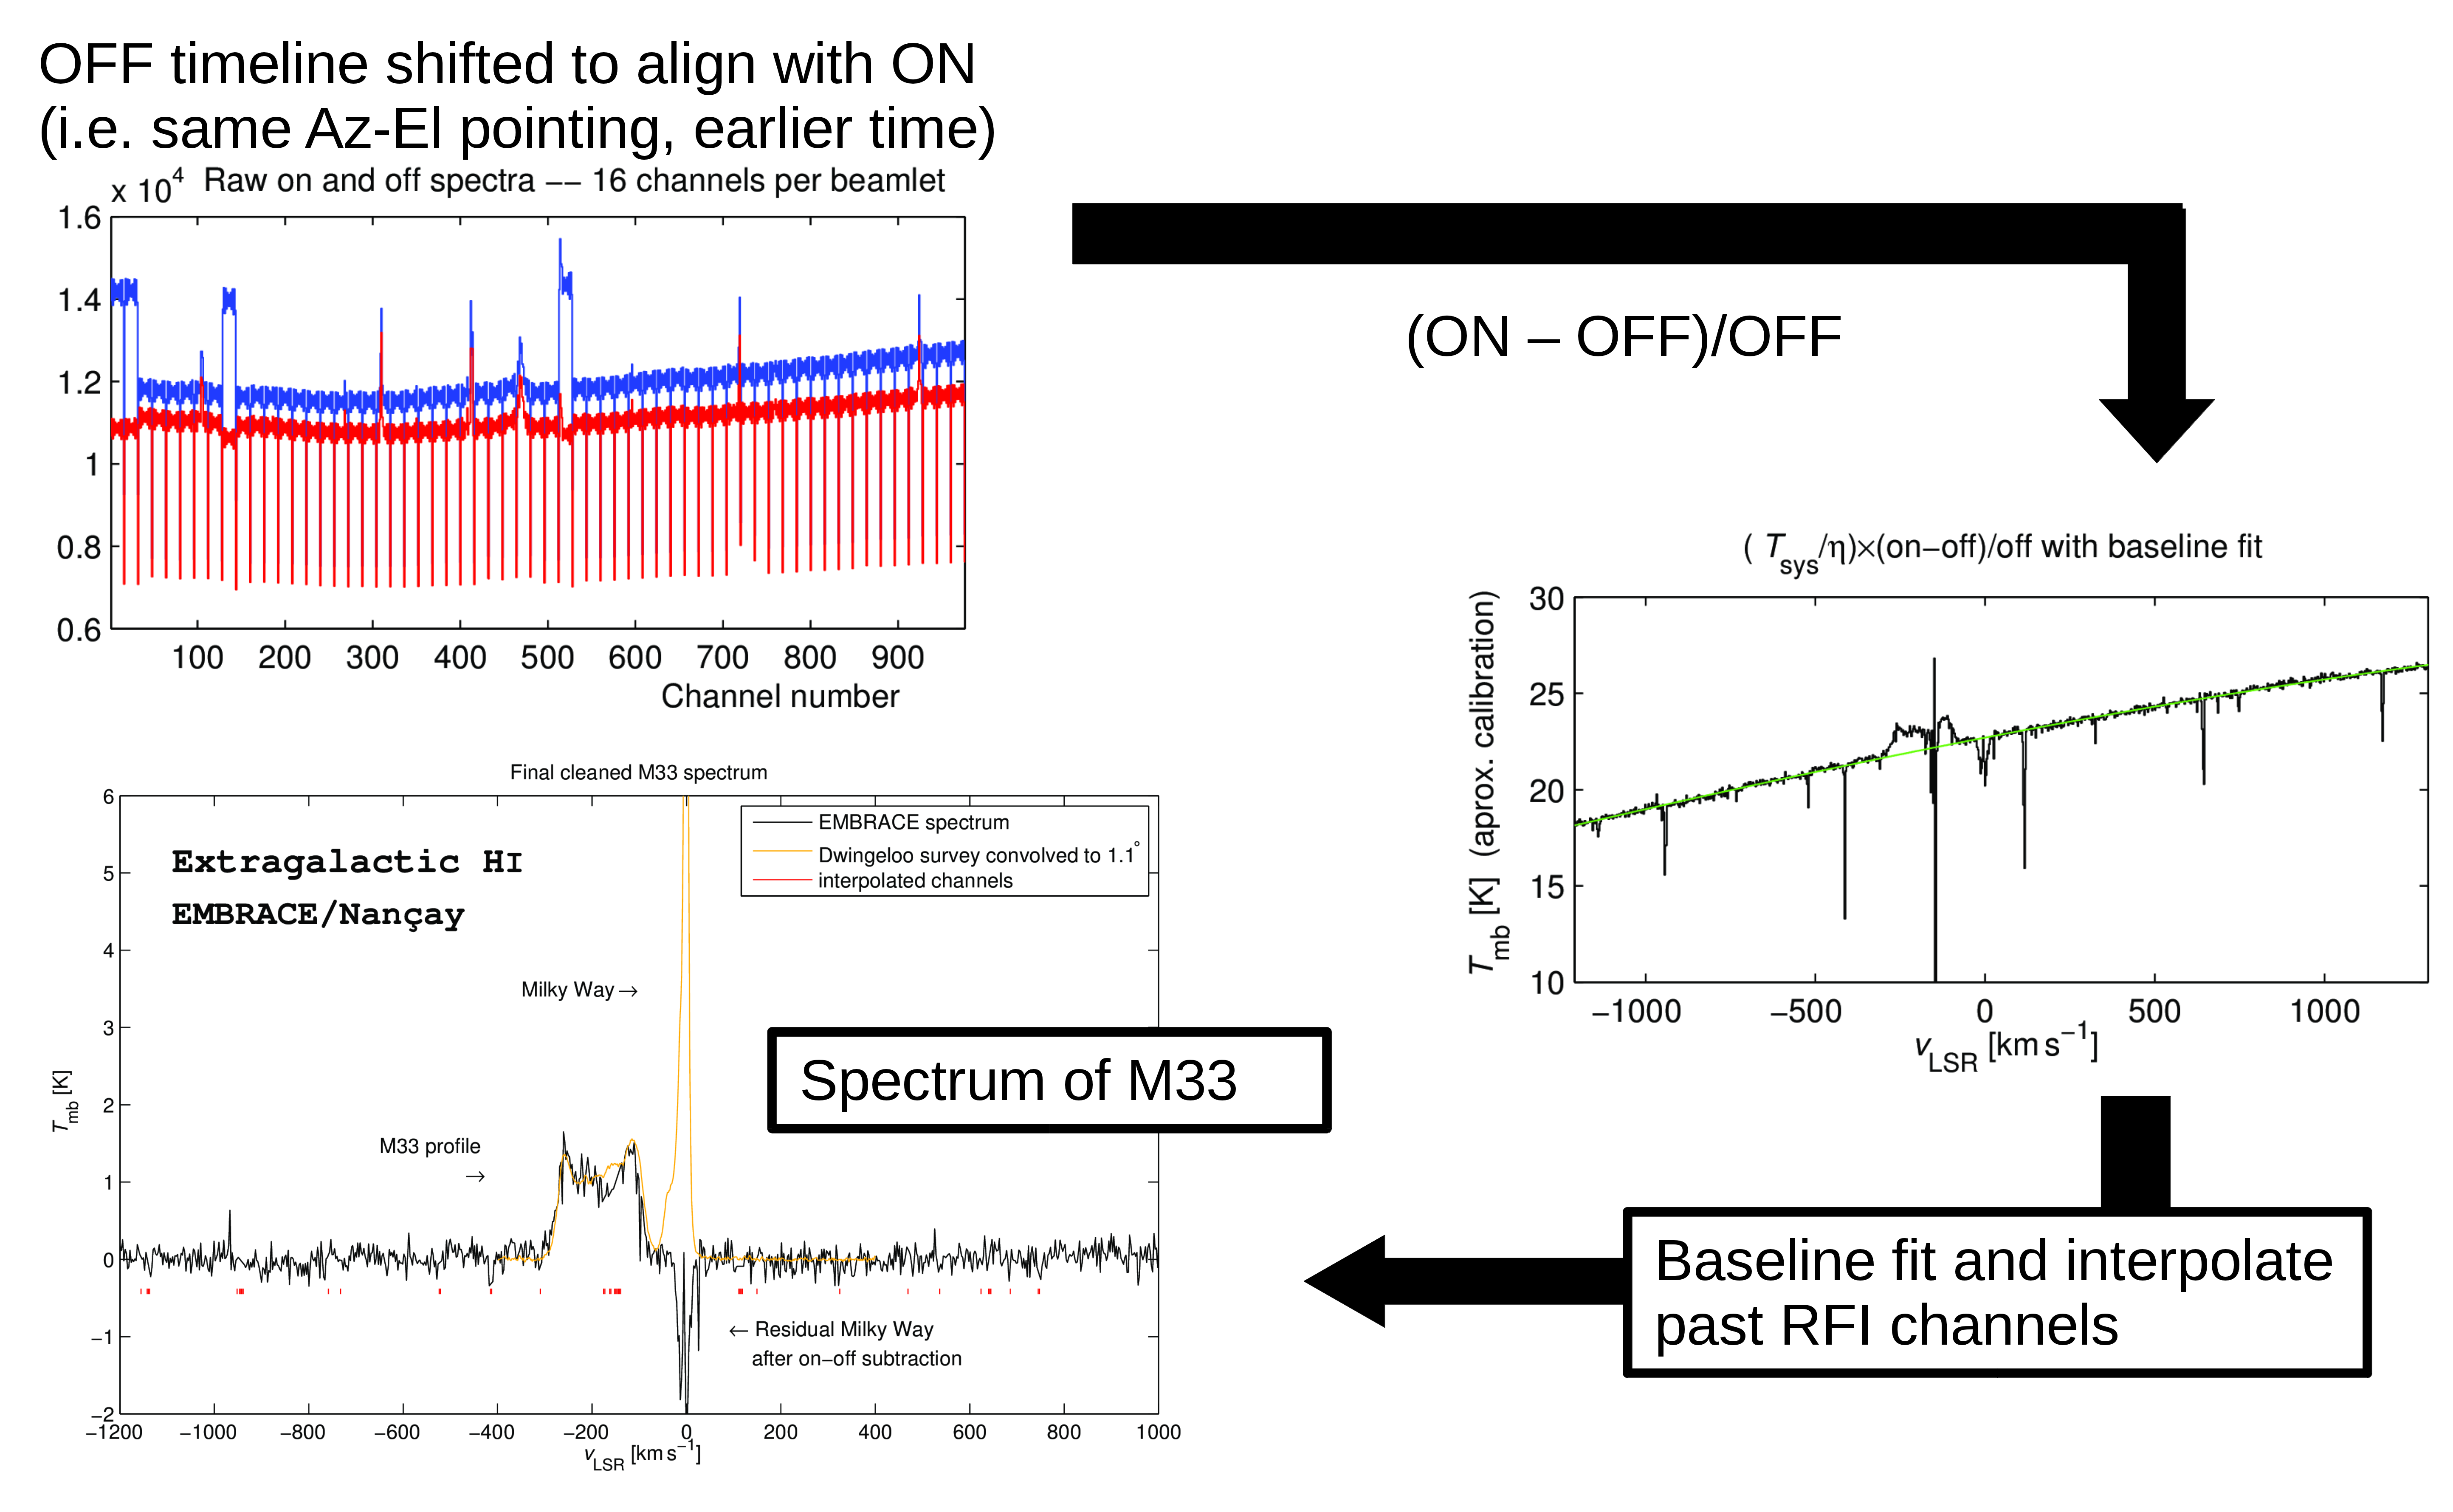
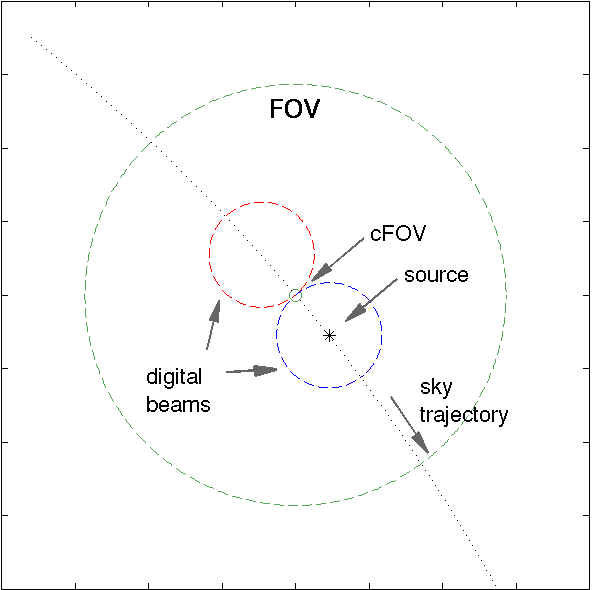
During the summer of 2013, M33 was observed at high spectral resolution by capturing the stream of UDP packets for half an hour (160 Gbyte in total) and channelizing each subband 16-fold (see Figure 9). The two digital beams that are always present in the backend output (referred to as the “X” and “Y” directions due to its LOFAR heritage) were employed to create symmetric on- and off-beams in a manner described in Figure 10. A spectrum was subsequently created in the simplest way possible; by co-averaging all data for each position separately before off-position subtraction and normalization, and then multiplying by a constant factor so that our result matches a template spectrum we retrieved from the LAB survey [38] convolved to the EMBRACE array beam size.
6 Summary and Future Work
The technology of dense aperture array uses a large number of antenna elements at half wavelength spacings to fully sample the aperture. EMBRACE@Nançay is the first fully operational demonstrator of this technology which is large enough to make interesting radio astronomical detections.
One of the main concerns with the dense aperture array technology is the high system complexity which could complicate operations and some have expressed doubt that operating such a complicated instrument might not be feasible for a facility observatory. However, EMBRACE@Nançay has clearly shown that dense aperture array technology is perfectly viable for radio astronomy. We have demonstrated its capability as a radio astronomy instrument, including astronomical observations of pulsars and spectroscopic observations of galaxies. We have also demonstrated its multibeam capability.
An important disadvantage of the dense aperture array technology is its relatively large power requirement. The large number of analogue electronic components associated with the signal chain of each antenna element, together with the digital processing requirements for beamforming and/or aperture synthesis, makes a system which is rather power hungry. A number of solutions are being studied to reduce the overall power consumption [39].
Dense aperture array technology is a viable solution for the SKA, offering the benefit of an enormous field of view together with great flexibility for system setups, including multibeaming with multiple and independent observation modes. The SKA built using dense aperture array technology will be the most rapid astronomical survey machine.
Acknowledgements.
EMBRACE was supported by the European Community Framework Programme 6, Square Kilometre Array Design Studies (SKADS), contract no 011938. We are grateful to ASTRON for initiating and developing the EMBRACE architecture. Maciej Serylak acknowledges the financial assistance of the South African SKA Project (SKA SA). Henrik Olofsson, Aris Karastergiou, and Maciej Serylak were supported for multiple working visits to Nançay by grants from the Scientific Council of the Paris Observatory.References
- [1]
- [2] Dewdney, P.E., Hall, P.J., Schilizzi, R.T., Lazio, T.J.W., Proceedings of the IEEE, Vol. 97, No. 8, pp. 1482-1496, ISSN: 0018-9219
- [3] Olofsson, A.O.H. Torchinsky, S.A., Chemin, L. Barth, S. Bosse, S., Martin, J.-M., Paule, W., Picard, P., Pomarède, S., Renaud, P., Taffoureau, C., Kant, G.W., Noordam, J.E., Wijnholds, S.J., Keller, R., Montebugnoli, S. 2010 in Proc. Wide Field Science and Technology for the SKA, Limelette, Belgium, S.A. Torchinsky et al. (eds), ISBN 978-90-805434-5-4 , pg. 253
- [4] Wijnholds, S.J., Kant, G.W., van der Wal, E., Benthem, P., Ruiter, M., Picard, P., Torchinsky, S.A., Montebugnoli, S., Keller, R., EMBRACE: First Experimental Results with the Initial 10% of a 10,000 Element Phased Array Radio Telescope, 2010 in Proc. Wide Field Science and Technology for the SKA, Limelette, Belgium, S.A. Torchinsky et al. (eds), ISBN 978-90-805434-5-4 , pg. 259
- [5] Torchinsky, S. A., Olofsson, A. O. H., Karastergiou, A., et al. 2013, SF2A-2013: Proceedings of the Annual meeting of the French Society of Astronomy and Astrophysics, 439
- [6] Rawlings, S., Abdalla, F. B., Bridle, S. L., et al. 2004, New A Rev., 48, 1013
- [7] Heidmann, J. 1966, L’Astronomie, 80, 157
- [8] Riess, A. G., Filippenko, A. V., Challis, P., et al. 1998, AJ, 116, 1009
- [9] Blake, C., & Glazebrook, K. 2003, ApJ, 594, 665
- [10] Peterson, J. B., Bandura, K., & Pen, U. L. 2006, arXiv:astro-ph/0606104
- [11] Ansari, R., Le Goff, J. -., Magneville, C., et al. 2008, arXiv:0807.3614
- [12] Ansari, R., Campagne, J. E., Colom, P., et al. 2012, A&A, 540, AA129
- [13] Cordes, J. M., Lazio, T. J. W., & McLaughlin, M. A. 2004, New A Rev., 48, 1459
- [14] Smits, R., Kramer, M., Stappers, B., et al. 2009, A&A, 493, 1161
- [15] Corbel, S., Miller-Jones, J. C. A., Fender, R. P., et al. 2015, arXiv:1501.04716
- [16] Lorimer, D. R., Bailes, M., McLaughlin, M. A., Narkevic, D. J., & Crawford, F. 2007, Science, 318, 777
- [17] Macquart, J.-P., Keane, E., Grainge, K., et al. 2015, arXiv:1501.07535
- [18] Wilkinson, P. N., Kellermann, K. I., Ekers, R. D., Cordes, J. M., & W. Lazio, T. J. 2004, New A Rev., 48, 1551
- [19] Torchinsky, S.A., The Questions that Drive the Specifications 2010 in Proc. Wide Field Science and Technology for the SKA, Limelette, Belgium, S.A. Torchinsky et al. (eds), ISBN 978-90-805434-5-4 , pg. 33
- [20] McKellar, A. 1940, PASP, 52, 187
- [21] Penzias, A. A., & Wilson, R. W. 1965, ApJ, 142, 419
- [22] Thompson, A.R., Moran, J.M., Swenson, G.W.Jr., Interferometry and Synthesis in Radio Astronomy, 2nd Edition Wiley-VCH, ISBN: 978-0-471-25492-8
- [23] Kant, G.W., van der Wal, E., Ruiter, M., Benthem, P. 2010 2010 in Proc. Wide Field Science and Technology for the SKA, Limelette, Belgium, S.A. Torchinsky et al. (eds), ISBN 978-90-805434-5-4 , pg. 227
- [24] Kant, G.W., Patel, P.D., Wijnholds, S.J., Ruiter, M., van der Wal, E. 2011 IEEE Trans. A&P 59, 1990.
- [25] van Haarlem, M. P., Wise, M. W., Gunst, A. W., et al. 2013, A&A, 556, AA2
- [26] Bosse, S., Barth, S., Torchinsky, S.A., Da Silva, B. Proc. European Microwave Integrated Circuits Conference, (EuMIC 2010), 27-28 September 2010, Paris, France, pp. 106 - 109
- [27] Pezzani, J., Algorithm for EMBRACE beamforming EMBRACE Technical Document, Nançay, 2008
- [28] Bianchi, G., Morawietz, J., Mariotti, S., Perini F., Schiaffino, M., Kant, G.W., EMBRACE Local Oscillator distributor, 2010 in Proc. Wide Field Science and Technology for the SKA, Limelette, Belgium, S.A. Torchinsky et al. (eds), ISBN 978-90-805434-5-4 , pg. 249
- [29] Monari, J., Perini, F., Mariotti, S., Kant, G.W., Morawietz, J., van der Wal, E. “EMBRACE receiver design,” 2010 in Proc. Wide Field Science and Technology for the SKA, Limelette, Belgium, S.A. Torchinsky et al. (eds), ISBN 978-90-805434-5-4 , pg. 245
- [30] Berenz, T., Mixed signal transportation for the EMBRACE antenna tiles 2010 in Proc. Wide Field Science and Technology for the SKA, Limelette, Belgium, S.A. Torchinsky et al. (eds), ISBN 978-90-805434-5-4 , pg. 239
- [31] Picard, P., Renaud, P., Taffoureau, C., Macaire, V., Mercier, L., Paule, W. 2010 in Proc. Wide Field Science and Technology for the SKA, Limelette, Belgium, S.A. Torchinsky et al. (eds), ISBN 978-90-805434-5-4 , pg. 235
- [32] Serylak, M., Karastergiou, A., Williams, C., et al. 2013, IAU Symposium, 291, 492
- [33] Renaud, P. Taffoureau, C., Picard, P., Borsenberger, J., Torchinsky, S.A., Olofsson, A.O.H., Viallefond, F., Monitoring and Control of EMBRACE, a 4608 Elements Phased Array for Radio Astronomy, 2011, Proceedings Astronomical Data Analysis Software Systems, Paris, 6-10 November
- [34] Hotan, A. W., van Straten, W., & Manchester, R. N. 2004, PASA, 21, 302
- [35] van Straten, W., Demorest, P., & Oslowski, S. 2012, Astronomical Research and Technology, 9, 237
- [36] Stairs, I. H. 2002, Single-Dish Radio Astronomy: Techniques and Applications, 278, 251
- [37] Ransom, S. M. 2001, Ph.D. Thesis, Harvard University, ISBN: 9780493408415
- [38] Kalberla, P. M. W., Burton, W. B., Hartmann, D., et al. 2005, A&A, 440, 775
- [39] bij de Vaate, J.G., Torchinsky, S.A., Faulkner A.J, Zhang, Y. Gunst, A., Benthem, P., van Bemmel, I.M., Kenfack, G. SKA Mid Frequency Aperture Arrays: Technology for the Ultimate Survey Machine in Proc. URSI General Assembly Beijing, China, 16-23 August, 2014