Quantifying density fluctuations in water at a hydrophobic surface: evidence for critical drying
Abstract
Employing smart Monte Carlo sampling techniques within the grand canonical ensemble, we investigate the properties of water at a model hydrophobic substrate. By reducing the strength of substrate-water attraction we find that fluctuations in the local number density, quantified by a rigorous definition of the local compressibility , increase rapidly for distances within or molecular diameters from the substrate as the degree of hydrophobicity, measured by the macroscopic contact angle , increases. Our simulations provide evidence for a continuous (critical) drying transition as the substrate-water interaction becomes very weak: . We speculate that the existence of such a transition might account for earlier simulation observations of strongly enhanced density fluctuations.
All physical scientists would agree that for water at a flat substrate a contact angle defines the substrate as hydrophobic. For such values Young’s equation implies that the substrate-vapor interfacial tension is lower than the substrate-liquid tension, i.e. the substrate prefers vapor to liquid. is determined by surface chemistry, which in turn determines the strength and range of substrate-fluid interactions. A key question, much discussed by the chemical physics communities, is whether there is an effective indicator of local ordering of water, manifest at microscopic distances from the substrate, which might correlate with the degree of hydrophobicity as measured by the macroscopic thermodynamic quantity . Quantifying the character and spatial extent of water ordering at hydrophobic entities is important across several disciplines, ranging from applied physics and materials science, where understanding slip lengths of water, shown to be correlated with substrate hydrophobicity, is crucial in microfluidics Bocquet and Charlaix (2010), to bio-physical processes such as protein-folding and micelle and membrane formation Ball (2008). Many studies have focussed on the average one-body density, i.e. the density profile of oxygen atoms near the substrate. Experimentally this is difficult to measure and several conflicting results were reported. Nevertheless, by 2009 a consensus emerged from x-ray reflectivity measurements that for water near a variety of hydrophobic self-assembled-monolayers (SAMs), there is a region of density depletion corresponding to only a fraction of a water monolayer Mezger et al. (2006); Ocko et al. (2008); Mezger et al. (2010). This was challenged by Chattopadhyay et.al. Chattopadhyay et al. (2010), who reported larger depletion lengths, increasing with , for water at fluoroalkylsilane SAMs. For the largest contact angle the depletion length was Å, corresponding to about three water layers. However, in a re-analysis Mezger et al. (2011) of the x-ray reflectivity data of Ref. Chattopadhyay et al. (2010) it was argued that such a large hydrophobic gap is likely to be an artefact of the data analysis that was used. This is disputed Chattopadhyay et al. (2011). Certainly such large depletion lengths are at odds with results of many computer simulations of water models, where the thickness of the depleted density region varies typically between Å for between about and Janeček and Netz (2007).
Other simulation studies have focussed on the density fluctuations of water at model hydrophobic substrates, arguing that some measure of the local compressibility might provide a better indicator of hydrophobicity than does the local density profile. The group of Garde Acharya et al. (2010) takes this stance and the review by Jamadagni et. al. Jamadagni et al. (2011) places their work in the context of bio-molecular systems. Chandler and co-workers Chandler (2007); Patel et al. (2010); Willard and Chandler (2014) and Mittal and Hummer Mittal and Hummer (2010) also emphasize that density fluctuations can be enhanced at hydrophobic substrates. Although these studies identify some underlying phenomenology, the various measures of the local compressibility introduced are ad-hoc. In particular these do not correspond to integrals over density correlation functions in the inhomogeneous liquid. Clear insights into the nature of the underlying fluctuations requires such a measure Evans and Wilding . Choice of ensemble is important. Most members of the community simulating water, choose not to work grand canonically. In most real interfacial situations there is a reservoir and it is natural to vary the chemical potential of the liquid. Following a recent analysis Evans and Stewart (2015) of density fluctuations in a Lennard-Jones (LJ) liquid at a planar substrate (wall), we argue that the most appropriate definition Evans and Wilding of the local compressibility, for a fixed confining volume, is
| (1) |
where is the average one-body density, is the distance normal to the substrate, and the temperature is fixed. For a bulk fluid with constant density , , where is the isothermal compressibility. The definition (1) is consistent with as an integral over the density-density correlation function and yields a unique fluctuation formula for this quantity; See Eqs. (8,9) of Evans and Wilding . In ref. Evans and Stewart (2015) it was shown using classical density functional theory (DFT) that for close to the substrate becomes large as the substrate becomes more solvophobic, i.e. increases. The effects are not small: for the ratio is about .
In this Letter we determine the local compressibility of the extended simple point charge (SPC/E) model of water Berendsen et al. (1987) near a planar substrate. On reducing the strength of substrate-water attraction, thereby increasing the hydrophobicity as measured by , we find increases in a similar fashion to the LJ case Evans and Stewart (2015). We focus on the approach to complete drying, at bulk vapor-liquid coexistence . Determining the nature of this transition continues to be challenging, even for simple fluids at solvophobic substrates. Using smart sampling techniques within Grand Canonical Monte Carlo (GCMC) simulations we find evidence for a critical drying transition in SPC/E water at a weakly attractive substrate. We note that recent MD simulations Willard and Chandler (2014); Godawat et al. of the same water model also investigate very weak substrate-water attraction. Although both studies attempt to link the growth of density fluctuations to increasing , neither simulation measures accurately so proximity to the drying point is uncertain. Moreover, neither makes explicit the possibility of a critical drying transition. We argue the latter is key to understanding the properties of water models in the extreme hydrophobic regime and, in particular, the enhanced density fluctuations that are observed.
We choose SPC/E as a simple but realistic model of water, known to provide a reasonable account of bulk vapor-liquid coexistence and the vapor-liquid surface tension of real water Kumar and Errington (2013a); Vega and de Miguel (2007). Moreover, this model has often been employed in simulations of water at hydrophobic substrates; for examples of MD studies see refs. Willard and Chandler (2014); Godawat et al. ; Acharya et al. (2010); Giovambattista et al. (2006) and for GCMC studies see refs. Kumar and Errington (2013a, b); Bratko et al. (2007); Bratko (2010). Kumar and Errington employ simulation techniques similar to the present but they do not measure , i.e. they do not access local density fluctuations. Rather they measure Kumar and Errington (2013b) the surface excess compressibility which is an integrated measure of ‘excess’ density fluctuations throughout the system Evans and Stewart (2015); Evans and Marini Bettolo Marconi (1987); Evans and Wilding
Our simulations were performed at . Since liquid water at room temperature is too dense for standard GCMC to operate effectively, smart sampling techniques were implemented. Configurational Bias MC was used to insert, delete, translate and rotate molecules Martin (2013), while Transition Matrix MC Smith and Bruce (1995), Multicanonical Sampling Berg and Neuhaus (1992) and Histogram Reweighting Ferrenberg and Swendsen (1988) were deployed to smoothly connect the vapor and liquid regions of configuration space. Together these methods allowed us to simulate modest system sizes of order a few hundred water molecules very accurately. Although MD simulations typically deal with greater numbers of molecules, the GCE is the appropriate ensemble for accurately studying and thermodynamic quantities such as and surface phase behaviour because it permits direct study of the fluctuations which characterise phase transitions. As these fluctuations occur on the scale of the system itself, the GCE is less afflicted by finite-size effects than other simulation ensembles.
We consider two simulation setups: (i) a fully periodic cubic box of volume ; (ii) a semi-periodic cuboidal slit geometry of volume , in which the oxygen atoms interact with a pair of symmetry-breaking walls separated by distance . For the latter geometry, the single wall-oxygen potential takes the form , where is the wall-fluid interaction strength and is the distance from the wall. is a constant, the choice which sets the units of energy (see Supplementary Material Evans and Wilding ), while sets the length scale for wall-fluid interactions which we assigned to be Å, in accordance with previous studies Kumar and Errington (2013b).
The choice of controls the degree of hydrophobicity, and hence the contact angle . Our use of the GCE permits us to calculate directly from Young’s equation,
| (2) |
Here is the vapor-liquid interfacial tension and and are the wall-vapor and wall-liquid interfacial tensions, respectively. Provided one can calculate and at , is given. Both quantities are directly obtainable from measurements of the probability distribution of the fluctuating molecular number density in the appropriate simulation geometry. Specifically, studies of in the fully periodic system allow estimates of both and , while studies of in the slit geometry allow measurements of .
For the periodic system at vapor-liquid coexistence, exhibits a pair of equally weighted peaks Borgs and Kotecky (1992) separated by a flat probability ‘valley’. The low and high density peaks correspond to pure vapor and liquid phase states respectively, while the flat valley corresponds to liquid-slab configurations in which a pair of liquid-vapor interfaces align parallel to one face of the simulation box. Since in the probability valley is typically many decades smaller than the peak probabilities and , standard sampling cannot plumb the valley depth. For this reason, Transition Matrix and Multicanoncial MC techniques Smith and Bruce (1995) were used to accumulate in histogram form across the full range of density from vapor to liquid. Initially was determined for a near-coexistence state point. The distribution was then reweighted Ferrenberg and Swendsen (1988) with respect to to determine via the equal peak weight criterion. Once obtained, the coexistence form of permits an estimate of Binder (1982); Errington (2003):
| (3) |
where and is the height of the pure phase peaks.
In a similar manner, estimates of at coexistence were accumulated for the slit geometry at various . The resulting histograms (Fig. 1) typically exhibit two peaks –one at low density corresponding to wall-vapor (i.e. vapor at the wall) configurations, and another at high density corresponding to wall-liquid (liquid at the wall) configurations 111At the vapor peak occurs at a density which is so low it corresponds to an average of less than one molecule in our simulation box. Accordingly the peak maximum appears at zero density in the histogram.. For a given , is calculated from the measured ratio of vapor and liquid peak heights in Müller and MacDowell (2000):
| (4) |
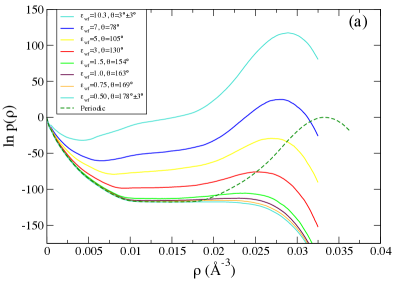
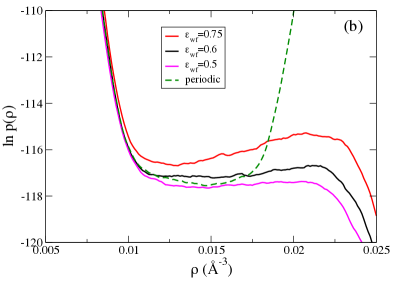
We now discuss the pertinent features of Fig. 1, noting that measures the grand potential of the fluid. For large values of , wall-liquid configurations are much more probable than wall-vapor configurations. Indeed for , we find , corresponding to the transition to complete wetting by liquid water. Reducing below this value takes the system first into the partially wet (hydrophilic) regime for which . Thereafter, for , the system enters the partially dry (hydrophobic) regime in which and where wall-vapor configurations are favoured over wall-liquid ones 222For the slit system that we consider, capillary evaporation should occur in the partially dry regime . Nevertheless it is possible to study the properties of the wall-liquid system because the liquid peak in persists metastably; the free energy barrier is enormous..
As is reduced within the hydrophobic regime, , Fig. 1 shows that the height of the liquid peak diminishes progressively, until it vanishes smoothly into a plateau in at a low wall strength which, for this system size, is . Interestingly, the vanishing of the liquid peak occurs precisely at the drying point . This is clear from the dashed curve in Fig. 1(b) which shows the form of corresponding to the fully periodic system at coexistence, for the same value of . The peak to valley separation in this plot is the same as the vapor to liquid peak separation in the slit system at . It follows from Eqs.(2)-(4) that the vanishing of the liquid peak in marks the drying point .
The behaviour of in the slit system as a function of reveals interesting qualitative differences between the nature of the approach to complete wetting (), and to complete drying (). In the former case, the wall-vapor configurations remain metastable at the transition, as evidenced by the presence of a vapor peak at the wetting wall strength . This signifies that the wetting transition of water is a first order surface phase transition. By contrast, on approaching the drying point, the liquid peak vanishes smoothly into a plateau of constant probability. The distinction is borne out by a plot of versus calculated from (2) and shown in Fig. 2. We find that approaches unity with a non-zero gradient denoting unambiguously a first order wetting transition, but appears to approach tangentially. Such a scenario implies a continuous (critical) transition to drying.

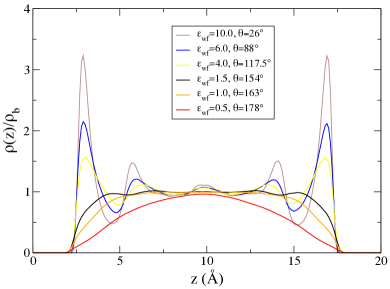
The physical interpretation of the smooth erosion of the liquid peak on the approach to drying is that the free energy barrier attaching the liquid to the wall vanishes continuously. This allows the liquid layer to detach and be replaced by vapor. In our slit system the emergent liquid-vapor interface fluctuates freely (cf., the plateau in at ) until the liquid slab thickness decreases sufficiently that the system undergoes (capillary) evaporation. This interpretation is confirmed by measurements of the number density profile of the oxygen atoms in the hydrophobic regime (Fig. 3). For medium strength attractive wall-fluid interactions which give rise to ‘neutral’ hydrophobicity, i.e. , the liquid density is high at the wall and packing effects occur. The structure in the profiles decreases smoothly as is reduced and a low density vapor layer starts to appear near the wall, the thickness of which appears to grow continuously as drying is approached. The thickness of the vapor layer represents the order parameter for the drying transition Evans and Parry (1989).
The behaviour of on the approach to drying reveals the emergence of a vapor layer or density gap associated with hydrophobic surfaces. However, a much more sensitive and revealing measure of the degree of hydrophobicity is the compressibility profile defined in (1), which provides a robust measure of local density fluctuations close to the wall. Accurate estimates of this quantity are readily obtained within the GCE, by exploiting histogram reweighting to numerically differentiate the density profile . The measured forms of , normalized with respect to the bulk compressibility (i.e. the compressibility far from the wall), are presented in Fig. 4. These show that close to the wall, grows rapidly as is reduced towards the drying point, eventually exceeding its bulk value by nearly two orders of magnitude 333Very close to the drying transition, the local fluctuations extend sufficiently far from each wall that the two walls of our slit start to interact. This is the reason that does not decay to unity at . . This finding mirrors what is found in DFT calculations of the solvophobic regime in a Lennard-Jones system Evans and Stewart (2015), and reflects the development of a large transverse correlation length for density fluctuations as Evans and Wilding . We note that there is a large enhancement in the local compressibility even for values of which correspond to contact angles not much greater than 444Even in the hydrophilic regime , can exceed its bulk value significantly, and is seen to follow the oscillatory form of . However, this surface enhancement arises not due to criticality but reflects the fact that is coupled to the growth of packing effects in .. This confirms the relevance of our findings for experimental studies on real smooth hydrophobic surfaces such as SAMs where contact angles have a maximum value of about .

In summary, we have shown that smart sampling within the GCE is a powerful approach for accurately characterising the hydrophobic regime including the approach to drying () in water. The local compressibility profile is the proper statistical mechanics measure of local density fluctuations in fluids Evans and Wilding . When applied to water in contact with a hydrophobic substrate, provides a sensitive indicator of how the microscopic structure near the substrate reflects the macroscopic contact angle –much more so than the density profile alone. In the drying limit the order parameter (i.e. the thickness of the vapor layer) grows continuously but slowly with decreasing . In contrast grows rapidly and exceeds its bulk value by nearly two orders of magnitude over the range of explored, indicating the growth of a large transverse correlation length Evans and Wilding . These findings point to drying in water at models of hydrophobic substrates as being a surface critical phenomenon. Indeed separate simulation studies of drying in the Lennard-Jones system reproduce the phenomenology seen in our studies of water whilst increased system size permits the extraction of critical power law behaviour Evans and Wilding (2015). With these insights, one can rationalize and explain the observations of enhanced fluctuations in previous simulation studies of water near hydrophobic surfaces Acharya et al. (2010); Jamadagni et al. (2011); Chandler (2007); Patel et al. (2010); Willard and Chandler (2014); Kumar and Errington (2013b); Mittal and Hummer (2010). We believe that these are attributable to the proximity of a surface critical point i.e. the approach to a continuous drying transition, the effects of which extend throughout the hydrophobic regime but were not recognised previously.
Acknowledgements.
Some of the simulations described here were performed on the Bath HPC Cluster. We thank R. Jack for helpful discussions.References
- Bocquet and Charlaix (2010) L. Bocquet and E. Charlaix, Chem. Soc. Rev. 39, 1073 (2010).
- Ball (2008) P. Ball, Chem. Rev. 108, 74 (2008).
- Mezger et al. (2006) M. Mezger, H. Reichert, S. Schöder, J. Okasinski, H. Schröder, H. Dosch, D. Palms, J. Ralston, and V. Honkimäki, PNAS 103, 18401 (2006).
- Ocko et al. (2008) B. M. Ocko, A. Dhinojwala, and J. Daillant, Phys. Rev. Lett. 101, 039601 (2008).
- Mezger et al. (2010) M. Mezger, F. Sedlmeier, D. Horinek, H. Reichert, D. Pontoni, and H. Dosch, J. Am. Chem. Soc. 132, 6735 (2010).
- Chattopadhyay et al. (2010) S. Chattopadhyay, A. Uysal, B. Stripe, Y.-G. Ha, T. J. Marks, E. A. Karapetrova, and P. Dutta, Phys. Rev. Lett. 105, 037803 (2010).
- Mezger et al. (2011) M. Mezger, H. Reichert, B. M. Ocko, J. Daillant, and H. Dosch, Phys. Rev. Lett. 107, 249801 (2011).
- Chattopadhyay et al. (2011) S. Chattopadhyay, A. Uysal, B. Stripe, Y.-g. Ha, T. J. Marks, E. A. Karapetrova, and P. Dutta, Phys. Rev. Lett. 107, 249802 (2011).
- Janeček and Netz (2007) J. Janeček and R. R. Netz, Langmuir 23, 8417 (2007) and references therein.
- Acharya et al. (2010) H. Acharya, S. Vembanur, S. N. Jamadagni, and S. Garde, Faraday Discuss. 146, 353 (2010).
- Jamadagni et al. (2011) S. N. Jamadagni, R. Godawat, and S. Garde, Ann. Rev. Chem. Biomol. Eng. 2, 147 (2011).
- Chandler (2007) D. Chandler, Nature 445, 831 (2007).
- Patel et al. (2010) A. J. Patel, P. Varilly, and D. Chandler, J. Phys. Chem. B 114, 1632 (2010).
- Willard and Chandler (2014) A. P. Willard and D. Chandler, J. Chem. Phys. 141, 18C519 (2014).
- Mittal and Hummer (2010) J. Mittal and G. Hummer, Faraday Discuss. 146, 341 (2010) and references therein.
- (16) R. Evans and N. B. Wilding, Supplementary Material, which includes Foiles and Ashcroft (1982); Tarazona and Evans (1982); Evans et al. (1983); Nicholson and Parsonage (1982); Henderson (1986), provides a) further details of simulations and b) a full discussion of how is related to the density-density correlation function of the inhomogeneous fluid, a fluctuation formula for and a brief summary of the measures of local compressibility introduced by other authors .
- Evans and Stewart (2015) R. Evans and M. C. Stewart, J.Phys.: Condens. Matt. 27, 194111 (2015).
- Berendsen et al. (1987) H. J. C. Berendsen, J. R. Grigera, and T. P. Straatsma, J. Phys. Chem. 91, 6269 (1987).
- (19) R. Godawat, S. Jamadagni, V. Venkateshwara, and S. Garde, ArXiv:1409.2570.
- Kumar and Errington (2013a) V. Kumar and J. R. Errington, Mol. Sim. 39, 1143 (2013a).
- Vega and de Miguel (2007) C. Vega and E. de Miguel, J. Chem. Phys. 126, 154707 (2007).
- Giovambattista et al. (2006) N. Giovambattista, P. J. Rossky, and P. G. Debenedetti, Phys. Rev. E 73, 041604 (2006).
- Kumar and Errington (2013b) V. Kumar and J. R. Errington, J. Phys. Chem. C 117, 23017 (2013b).
- Bratko et al. (2007) D. Bratko, C. D. Daub, K. Leung, and A. Luzar, J. Am. Chem. Soc. 129, 2504 (2007).
- Bratko (2010) D. Bratko, Faraday Discuss. 146, 382 (2010).
- Evans and Marini Bettolo Marconi (1987) R. Evans and U. Marini Bettolo Marconi, J. Chem. Phys. 86, 7138 (1987).
- Martin (2013) M. G. Martin, Mol. Sim. 39, 1212 (2013).
- Smith and Bruce (1995) G. R. Smith and A. D. Bruce, J. Phys. A 28, 6623 (1995).
- Berg and Neuhaus (1992) B. A. Berg and T. Neuhaus, Phys. Rev. Lett. 68, 9 (1992).
- Ferrenberg and Swendsen (1988) A. M. Ferrenberg and R. H. Swendsen, Phys. Rev. Lett. 61, 2635 (1988).
- Borgs and Kotecky (1992) C. Borgs and R. Kotecky, Phys. Rev. Lett. 68, 1734 (1992).
- Binder (1982) K. Binder, Phys. Rev. A 25, 1699 (1982).
- Errington (2003) J. R. Errington, Phys. Rev. E 67, 012102 (2003).
- Note (1) At the vapor peak occurs at a density which is so low it corresponds to an average of less than one molecule in our simulation box. Accordingly the peak maximum appears at zero density in the histogram.
- Müller and MacDowell (2000) M. Müller and L. G. MacDowell, Macromolecules 33, 3902 (2000).
- Note (2) For the slit system that we consider, capillary evaporation should occur in the partially dry regime . Nevertheless it is possible to study the properties of the wall-liquid system because the liquid peak in persists metastably; the free energy barrier is enormous.
- Evans and Parry (1989) R. Evans and A. O. Parry, J. Phys: Condens. Matter 1, 7207 (1989).
- Note (3) Very close to the drying transition, the local fluctuations extend sufficiently far from each wall that the two walls of our slit start to interact. This is the reason that does not decay to unity at .
- Note (4) Even in the hydrophilic regime , can exceed its bulk value significantly, and is seen to follow the oscillatory form of . However, this surface enhancement arises not due to criticality but reflects the fact that is coupled to the growth of packing effects in .
- Evans and Wilding (2015) R. Evans and N. B. Wilding, unpublished results (2015).
- Foiles and Ashcroft (1982) S. Foiles and N. Ashcroft, Phys. Rev. B 25, 1366 (1982).
- Tarazona and Evans (1982) P. Tarazona and R. Evans, Mol. Phys. 47, 1033 (1982).
- Evans et al. (1983) R. Evans, P. Tarazona, and U. Marini Bettolo Marconi, Mol. Phys. 50, 993 (1983).
- Nicholson and Parsonage (1982) D. Nicholson and N. Parsonage, Computer Simulation and the Statistical Mechanics of Adsorption (Academic Press, 1982).
- Henderson (1986) J. Henderson, Mol. Phys. 59, 1049 (1986).