=3 mm line survey of nearby active galaxies
Abstract
Aims. We aim for a better understanding of the imprints that the nuclear activity in galaxies leaves in the molecular gas.
Methods. We used the IRAM 30 m telescope to observe the frequency range [86-116] GHz towards the central regions of the starburst galaxies M 83, M 82, and NGC 253, the galaxies hosting an active galactic nucleus (AGN) M 51, NGC 1068, and NGC 7469, and the ultra-luminous infrared galaxies (ULIRGs) Arp220 and Mrk231. Assuming local thermodynamic equilibrium (LTE), we calculated the column densities of 27 molecules and 10 isotopologues (or their upper limits in case of non-detections).
Results. Among others, we report the first tentative detections of CH3CHO, HNCO, and NS in M 82 and, for the first time in the extragalactic medium, HC5N in NGC 253. H recombination lines were only found in M 82 and NGC 253. Vibrationally excited lines of HC3N were only detected in Arp 220. CH3CCH emission is only seen in the starburst-dominated galaxies. By comparison of the fractional abundances among the galaxies, we looked for the molecules that are best suited to characterise the chemistry of each group of galaxies (starbursts, AGNs and ULIRGs), as well as the differences among galaxies within the same group.
Conclusions. To characterise and compare starburst galaxies, suitable species are CH3OH and HNCO as tracers of large-scale shocks, dominating early to intermediate starbursts stages, and CH3CCH, c-C3H2 and HCO as tracers of UV fields, which control the intermediate to old/post starbursts phases. M 83 shows signs of a shock-dominated environment. NGC 253 is characterised by both strong shocks and some UV fields. M 82 stands out by bright PDR tracers, pointing to an UV field-dominated environment. Regarding AGNs, the abundances of HCN and CN (previously claimed as enhanced in AGNs) in M 51 are similar to those in starburst galaxies, while the HCN/HCO+ ratio is high in M 51 and NGC 1068, but not in NGC 7469. We neither find a correlation between the HCN/CS ratio (recently claimed as a possible starburst/AGN discriminator) and the AGN activity. However, high enough spatial resolution to separate their circumnuclear disks (CNDs) from the surrounding star-forming regions is needed to find molecular abundance trends in AGNs. High abundances of H13CN and HC3N, as well as a similarity between the column densities of 13CO and C18O, are representative of the molecular interstellar medium (ISM) in the ULIRGs. Furthermore, the chemistry of Arp 220 points towards a more starburst-dominated environment, while that of Mrk 231 resembles more the AGNs of our sample.
Key Words.:
ISM: molecules – galaxies:ISM– galaxies: nuclei – galaxies: active– galaxies: abundances– radio lines: ISM1 Introduction
The creation and destruction of molecular species in the dense ISM are directly related to a number of physical mechanisms, namely large-scale shocks, cosmic rays, UV radiation fields and X-rays. Hence, studying molecular abundances can be a way to infer the importance of these processes for the star formation, and to understand how they favour dispersion or gravitational collapse of compact clouds or their ionisation. In the particular case of the dense gas found to surround galactic nuclei, one can even attempt to deduce the nature of their powering sources using millimetre(mm)/sub-mm spectra (e.g. Martín et al. 2011).
Comparing chemical models with observations, it has been claimed that the abundances of some species, such as HCN and CN, are enhanced in the presence of X-rays and cosmic ray ionisation fields that are dominant in AGNs (Kohno et al. 2001; Meijerink et al. 2007; Krips et al. 2008; Aladro et al. 2013; Izumi et al. 2013). On the other hand, less energetic radiation from UV fields destroys heavy molecules like HNCO and CH3OH (Martín et al. 2006a, 2008, 2009a), while at the same time helps creating others that are formed through ion-molecule reactions, such as c-C3H2, CO+ or HOC+ (e.g. Savage & Ziurys 2004; Martín et al. 2009a; Aladro et al. 2011b). Shocks caused by stellar winds, supernovae, or molecular cloud collapse can release species formed on dust grains to the gaseous phase (e.g. CH3OH, HNCO, or sulfur-bearing species, Viti et al. 2001; Martín et al. 2009a; Jiménez-Serra et al. 2008).
Unbiased extragalactic molecular line surveys at mm wavelengths (Martín et al. 2006b; Muller et al. 2011; Aladro et al. 2011b, 2013; Davis et al. 2013; Watanabe et al. 2014) allow us to observe many species simultaneously and identify those that provide the best information about the physical properties around the nuclear regions of active galaxies. Some molecules much less abundant than the commonly observed species, CO, HCN or HCO+, seem to be more sensitive to their environments, and show larger differences in their abundances among galaxy types. They can be even used to identify the evolutionary stage of galaxies. For example, the HNCO abundance varies by nearly two orders of magnitude between young and old starbursts, and thus appears to be an excellent diagnostic tool of their evolutionary state (Martín et al. 2009a). CH3CCH, on the other hand, is one of the most abundant species in starburst galaxies (even more than HCN and HCO+), but has never been detected in any AGN-dominated source (Aladro et al. 2011a, 2013). Yet, extragalactic line surveys carried out so far have focused exclusively on a single type of galaxy, either starbursts (Martín et al. 2006b; Aladro et al. 2011b), (U)LIRGs (Costagliola et al. 2011; Martín et al. 2011; Davis et al. 2013), or AGNs (Aladro et al. 2013). A detailed and uniform comparison of different types of active galaxies in this context is still missing. Here, we therefore aim at a comparison of the molecular ISM in a sample of galaxies that includes starbursts, AGNs and ULIRGs.
In this paper we present the first systematic unbiased spectral line survey of a sample of galaxies selected with respect to their nuclear activity. It is organised as follows: In Sect. 2 we introduce our galaxy sample. Section 3 describes the observations and data reduction. Section 4 details the data analysis, including a discussion about the molecular source sizes of the galaxies (Sect. 4.1), the line identification and line profiles (Sect. 4.2), spectral model fits, and rotational temperatures (Sect. 4.3). In Sect. 5 we summarise the detections (Sect. 5.1), and present the column densities calculated under the LTE assumption (Sect. 5.2). We indicate the potential key species for further extragalactic studies in Sect. 6. In Sect. 7 we detail our findings for starburst galaxies (Sect. 7.1), AGNs (Sect. 7.2), and ULIRGs (Sect. 7.3). Finally, we summarise our main conclusions in Sect. 8.
2 The galaxy sample
We selected a sample of eight galaxies based on their luminosity and galactic nuclear activity, following these characteristics: (a) the galaxies are in the local universe (, D 200 Mpc), (b) they show bright molecular emission ( mK) and cover a wide range of infrared luminosity (), thus including low luminosity galaxies, LIRGs and ULIRGs; (c) the sample encompasses the two main types of galactic nuclear activity: AGNs and starbursts; (d) it includes starbursts and ULIRGs in different stages of evolution; (e) it includes AGNs of both Seyfert (Sy) 1 and Sy 2 types. The eight galaxies are well-known extragalactic objects studied across almost the whole electromagnetic spectrum, and in particular at mm/sub-mm wavelengths. Moreover, these galaxies are often considered as archetypes in the local universe of the different nuclear activities/stages of evolution mentioned above. Some of their main properties are shown in Table 1.
Our sample includes the three starburst galaxies M 83, NGC 253, and M 82. The last two were targets of line surveys at and 1.3 mm done with the IRAM 30 m telescope by Martín et al. (2006b) and Aladro et al. (2011b). These two studies confirmed that the molecular ISM in the north-eastern molecular lobe of M 82 shows typical features of an evolved starburst, where the gas is heavily pervaded by strong UV fields, while the nuclear region of NGC 253 is more influenced by low-velocity shocks. NGC 253 hosts notable large scale outflows (Turner & Ho 1985; Bolatto et al. 2013) which indicate that its starburst is not in its initial state, though not as evolved as the M 82 one. With the present =3 mm observations, these two galaxies are the best studied at millimetre wavelengths so far. We also observed M 83 as an example of a young starburst (Martín et al. 2009a). It has a lower star formation rate (2.5 yr-1, Walter et al. 2008) than NGC 253 and M 82, and a star formation episode lasting (only) around 6 Myrs (Houghton & Thatte 2008). Thus its chemical composition is expected to be somehow different from those of NGC 253 and M 82. With these three starburst galaxies, we aim to characterise better the changes of the molecular gas composition as the starburst processes evolve.
As galaxies containing AGNs, we include NGC 7469 (Sy 1), NGC 1068 (Sy 2), and M 51 (Sy 2). The results of the NGC 1068 survey were already published in Aladro et al. (2013), and we refer the reader to that paper for a discussion of its isotopic line ratios and a chemical modelling of its central gas. Both NGC 7469 and NGC 1068 have a starburst ring at 1 kpc from the central AGN, and have very similar observed properties (see e.g. Table 2 of Wilson et al. 1991). On the other hand, M 51 shows several star-forming regions along its spiral arms (Bastian et al. 2005). In the three cases, the angular resolution of the 30 m beam () did not allow us to separate the emission coming from the central AGNs and those of the surrounding starbursts. Thus, our data might be showing not only the molecular composition of their AGN but also some contribution from the starburst regions. This might be particularly significative in the case of NGC 7469 due to its farther distance, although estimations of the emission coming from starburst regions at our frequencies are only available for NGC 1068 (see details in Sect. 7.2).
To complement our sample, we observed two of the closest ULIRGs, Arp 220 and Mrk 231. Vigorous star forming regions and black holes coexist in the centres of ULIRGs. Still, the main powering source of their nuclei remains unclear in most cases. Arp 220 is in an early stage of the merging process, with a double nucleus that is not resolved by our observations. An interferometric line survey done towards this galaxy by Martín et al. (2011) pointed to starburst processes as the more likely heating mechanism of its two centres (see also Greve et al. 2009). In contrast, Mrk 231 is in a later stage of merging, where the two nuclei of the individual galaxies are already fused, and molecular-rich large-scale outflows and super-winds are clearly present (Aalto et al. 2012). AGN activity likely prevails in this galaxy (e.g. Gallagher et al. 2002; van der Werf et al. 2010), and its nucleus seems to host a Sy 1 object (Boksenberg et al. 1977).
3 Observations and data reduction
The observations were carried out with the IRAM 30 m telescope111IRAM is supported by INSU/CNRS (France), MPG (Germany), and IGN (Spain). (Pico Veleta Observatory, Spain) between June 2009 and March 2012. We observed the eight galaxies in the frequency range [86-116] GHz. For NGC 253 and M 82 we also included lower frequencies from 80 GHz and 85 GHz, respectively. The reduced spectra are shown in Figs. 1 - 5. The half-power beam width (HPBW) corresponding to the survey frequencies ranged from 29′′ to 21′′. We used the band E0 of the EMIR receiver (Carter et al. 2012) and the WILMA autocorrelator. This receiver-backend configuration allowed us to cover 8 GHz simultaneously in the two orthogonal linear polarisations, and led to an original channel-width spacing of km s-1. The observed 30 GHz were covered by 5 tunings with a minimum overlap of 0.8 GHz. For some galaxies, an extra tuning has been used to increase the signal to noise in parts of the spectrum showing faint lines. The observations were done by wobbling the secondary mirror with a switching frequency of 0.5 Hz and a beam throw of 110′′ in azimuth (80′′ in the case of Arp 220).
The weather was variable during the different observing runs, from excellent (pwv1 mm) to mediocre (pwv6 mm) weather conditions. We checked the pointing accuracy every hour towards several nearby bright continuum sources. The pointing corrections were always 5′′. The focus was also checked and corrected at the beginning of each run and during sunsets and sunrises.
| Galaxy | (J 2000) | (J 2000) | Da | SFRd | Activity type | |||
|---|---|---|---|---|---|---|---|---|
| h:m:s | o:′:′′ | Mpc | km s-1 | ′′ /pc | M⊙ yr-1 | |||
| M 83 | 13:37:00.93 | -29:51:56.40 | 4.5 | 513 | 15 / 327 | 2.5 | Starburst | |
| NGC 253 | 00:47:33.12 | -25:17:18.60 | 3.9 | 250 | 20 / 378 | 3.6 | Starburst | |
| M 82-NE | 09:55:51.90 | 69:40:47.00 | 3.5 | 300 | 12 /204 | 10 | Starburst | |
| M 51 | 13:29:52.70 | 47:11:43.00 | 8.4 | 470 | 15 / 611 | 2.5 | AGN | |
| NGC 1068 | 02:42:40.90 | -00:00:46.00 | 14.4 | 1100 | 4 / 279 | 0.4 | AGN + Starburst | |
| NGC 7469 | 23:03:15.60 | 08:52:26.00 | 29.5 | 4892 | 6 / 858 | 30 | AGN + Starburst | |
| Arp 220 | 15:34:57.08 | 23:30:11.30 | 70.0 | 5350 | 2 / 679 | 240 | Starburst | |
| Mrk 231 | 12:56:14.20 | 56:52:25.00 | 170.0 | 12173 | 2 / 1640 | 220 | AGN |
-
For M 82 we observed the northeastern (NE) molecular lobe at an offset position () with respect to its dynamical centre. a Distances taken from the NASA/IPAC Extragalactic Database; b Systemic Local Standard of Rest (LSR) radial velocities following the optical convention, taken from SIMBAD. c Source sizes and their corresponding spatial scales for the assumed distances. d Star formation rate obtained from Walter et al. (2008) for M 83; Strickland et al. (2004) for NGC 253 and M 82; Schuster et al. (2007) for M 51; Esquej et al. (2014) for NGC 1068; Genzel et al. (1995) for NGC 7469; Anantharamaiah et al. (2000) for Arp 220; Taylor et al. (1999) for Mrk 231. We note that this parameter should only give a rough idea of the activity, as it was calculated for different volumes in each galaxy. e Infrared luminosities taken from Sanders et al. (2003).
The data were first calibrated to the antenna temperature () scale using the chopper-wheel method (Penzias & Burrus 1973). The observed spectra were then converted to main beam temperatures () using the relation , where is the forward efficiency of the telescope, whose values were between 0.94 and 0.95, and is the main beam efficiency, ranging from 0.77 to 0.81 222http://www.iram.es/IRAMES/mainWiki/Iram30mEfficiencies.
Each individual spectrum was analised separately. After eliminating bad channels or spectra containing strong ripples, all the spectra tuned at the same frequency were averaged and baselines of orders between zero and two were subtracted to each chunk of 8 GHz. We note however that in the case of M 82 the baseline correction was not good enough to remove some small ripples in the range GHz. Higher order baselines did not improve the resulting spectra. Fortunately, comparing with the rest of the galaxies, no important lines are expected in that range.
Due to the broad line-widths of these galaxies (100 km s-1), the final spectra of M 51, M 82, M 83, NGC 1068 and NGC 253 were smoothed to km s-1, those of Arp 220 and NGC 7469 were smoothed to km s-1, and the Mrk 231 data to 60 km s-1. The rms achieved for all galaxies was in average mK ( mJy beam-1) across the whole survey at the final velocity resolutions. The data were also corrected to first order for beam dilution effects as
| (1) |
where is the source averaged brightness temperature, is the molecular source size (see Table 1 and Sect. 4.1 for details), and is the beam size. Gaussian distribution of the emission was assumed. We did not correct the data for the gain-elevation curve and for the gain losses due to a large wobbler throw because these corrections are only minor at 3 mm wavelength.
4 Data analysis
4.1 Source sizes
The source size of the molecular emission in each galaxy can be estimated in two ways. One is through high angular resolution interferometric maps of the region of all the species, and the other is by comparison of the observations carried out with two (or more) telescopes having different beam sizes at the same frequency (so can be estimated from Eq. 1). Unfortunately, the interferometric maps performed so far for our sample of galaxies encompass a few abundant species only, such as CO, 13CO, or HCN. Besides, most of the line transitions studied here were previously observed (if detected at all) with only one single-dish telescope.
To simplify the situation, we adopt the same source size for all the molecules detected in a galaxy. We estimated their from interferometric maps of 12CO , HCN , HCO+ , 13CO , and HCO (Downes & Solomon 1998 for Arp 220 and Mrk 231, Kohno et al. 1996 for M 51, García-Burillo et al. 2002 for the NE lobe of M 82, Muraoka et al. 2009 for M 83, Helfer & Blitz 1995, Schinnerer et al. 2000 for NGC 1068, Knudsen et al. 2007 for NGC 253, and Davies et al. 2004 for NGC 7469). The values are listed in Table 1.
The source size has a direct impact on the resulting brightness temperature (Eq. 1), and consequently on the source averaged column density.The larger (smaller) the source size that is assumed, the lower (higher) the column densities that are derived. To work around this, we base our discussion on column density ratios between species. Our estimates of these ratios would be only sensitive to differences in the emission extent between species, on which there is not enough information.
4.2 Line identification, line profiles, and Gaussian fits
We used the MADCUBA_IJ software333http://cab.inta-csic.es/madcuba which includes the CDMS and JPL catalogues (Müller et al. 2001, 2005; Pickett et al. 1998) to identify the lines. The procedure was similar to what is described in detail in Aladro et al. (2011b), and also shown in the NGC 1068 survey (Aladro et al. 2013).
We used CLASS444http://www.iram.fr/IRAMFR/GILDAS/ to check whether there were lines coming from the image band of the spectra. The image band rejection of the E0 receiver is 10 dB, which ensures that most of the lines from the image band, except for the strongest ones, are not entering the signal band. We found that only the spectra from NGC 253, M 83 and M 82 are affected by features coming from the image band. Few of them were blended with other transitions from the signal band. For those, whenever the separation was large enough, we fixed the observed line parameters in the signal band to estimate their contribution to the image band line. Details of the fitting parameters are shown in Appendix A.
Among the eight galaxies, only M 83 and Mrk 231 show simple Gaussian line profiles. The bright lines in Arp 220 (e.g. HCN, HCO+, CS) have a clear double-peak profile. It is not clear whether this might be due to the unresolved double nucleus or to absorption effects, as reported in previous interferometric studies (Sakamoto et al. 2009; Tunnard et al. 2015). Fainter lines also show a deviation from Gaussian profiles, though not so clear as those which are optically thicker. Mrk 231 is also expected to be affected by absorption, but its lines are comparatively much fainter, and thus this effect, if present, is not so evident. Regarding NGC 253, the observed circumnuclear region has five clumps of warm dense gas, but interferometric observations are needed to resolve them (e.g. Sakamoto et al. 2011). With the 30 m telescope, the integrated spectrum of NGC 253 appears as two blended Gaussians. On the other hand, the ‘two-horned’ line profiles of M 51 and NGC 7469 include not only the emission from the very centre, but possibly also that coming from the inner arms and the surrounding molecular disks (Matsushita et al. 1998; Davies et al. 2004). NGC 1068 has a similar physical structure as NGC 7469 (a circumnuclear disk, surrounded by a starburst ring at 1kpc from the centre). In addition, the gas dynamics in the CND of NGC 1068 are quite complex, and some of the brightest lines, as seen by high-resolution observations, need several (two to four) Gaussian components to better fit the profiles (Krips et al. 2011; García-Burillo et al. 2014). Finally, while our M 82 observations are centred in the North-Eastern (NE) molecular lobe of the nucleus, some emission from the very centre enters the 30 m beam. This translates into a bump at low velocities of some of the lines that we can easily separate from the NE emission (see Aladro et al. 2011b for details). To homogenize the data, we fitted a single Gaussian to all lines detected in the survey. This simplification has little impact on the derived column densities of the species, as shown by Martín et al. (2011) and Aladro et al. (2011a) for Arp 220 and NGC 253 respectively. However, we made sure that the results obtained by fitting one or more Gaussians to the lines give differences in the overall column densities that are less than 10% of their values.
4.3 Spectral line model fit
Molecular emission was modelled using the SLIM package within MADCUBA_IJ (Martín et al. in prep.). The fit is performed in the parameter space of column density, rotational temperature, velocity and width of the line to the actual emission. Thus integrated and peak line intensity, as well as opacity, are derived from those parameters. The modelling assumes LTE, but not optically thin emission. However, the fixed values of the source sizes and rotational temperatures make the fitted lines optically thin and the line profiles Gaussian. A Gaussian fit has been performed to the CO lines, but as it is highly affected by opacity, which impact the column density estimate, we do not include CO in our results and discussion. For the rest of the species, we fitted the molecules one by one, including in each case all the transitions along the observed frequency range (in case there are more than one). As an exception, blended features were fitted simultaneously in order to take into account the contribution of each one to the total integrated areas.
The rotational temperature () of a given species can only be constrained if there are observations of several rotational transitions. Additionally, if the molecule is faint, the error associated to its calculated could be, by far, larger than the value itself. As most of the species have only one transition in our survey, we fixed =10 K. On average, as seen in our previous works, the rotational temperatures of the detected species are not expected to be much lower or higher than this value, though some exceptions are observed, such as seen for NH2CN and CH3CCH in NGC 253 and M 82 (Martín et al. 2006b; Aladro et al. 2011b), HC3N and c-C3H2 in Arp 220 (Martín et al. 2011), and CN in Mrk 231 and Arp 220 (Henkel et al. 2014). The uncertainty added to the calculated column densities by assuming a fixed rotational temperature is not critical when comparing fractional abundances among galaxies; multi-line observations of many molecules in the nuclei of different galaxies and in the GC show that species have also very similar excitation conditions in different sources (e.g. Aladro et al. 2011b; Armijos-Abendaño et al. 2015). Thus the associated rotational temperature of a given molecule is expected (or measured) to be similar for all the galaxies of our sample, being the variations of the proportional to the differences in the gas temperature among sources. For this reason, comparing fractional abundances instead of column densities, makes the analysis less sensitive to these changes.
Apart from the species mentioned before, there is the special case of the vibrationally excited lines of HC3N, detected (only) in Arp 220. They are expected to trace gas with temperatures above 100 K (Costagliola & Aalto 2010; Martín et al. 2011). For those vibrational transitions, we did calculate the temperature in a similar way as for the rotational temperatures, and obtained K.
Warm kinetic temperatures () estimated in the nuclear regions of these galaxies, such as 120 K for NGC 253 (Bradford et al. 2003) or 150 K for Mrk 231 (van der Werf et al. 2010), come from higher frequency observations and are representative of a small fraction of the gas only. Therefore, our assumption is still valid for the bulk of the molecular gas. Note, in any case, that rotational temperatures are lower than , as the H2 densities are below the critical densities. Also, previous extragalactic surveys used similar assumptions, such as =126 K for NGC 253 (Martín et al. 2006b), 2010 K for M 82 (Aladro et al. 2011b), and 105 K for NGC 1068 (Aladro et al. 2013).
5 Results
5.1 Summary of detections
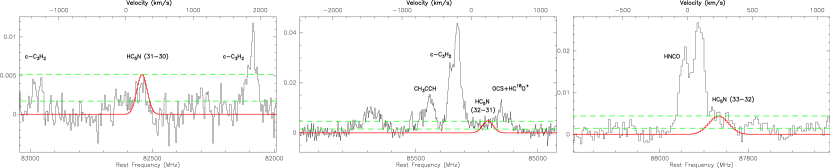
In agreement with our previous surveys (Aladro et al. 2011b, 2013), we consider “detected” lines as those with a signal to noise ratio SNR 3 and whose profiles can be clearly fitted by a Gaussian. Lines are considered “tentatively detected” when having 1 , but can also be fitted with Gaussian profiles, whose velocities and line widths are in good agreement with the ones obtained for detected lines (e.g. HC5N lines, see Fig. 5). “Non-detected” lines are those with SNR 1 for which it is not possible to fit reliable Gaussian profiles, as the lines are dominated by the spectral noise.
Thirty-seven species (including isotopologues) were identified in NGC 253, which make it the most prolific galaxy of our sample in terms of molecular complexity. We detected the 13C bearing isotopologues of CO, HCN, HCO+, HNC, CN, and CS, the 18O bearing isotopologues of CO and HCO+, the 17O isotopologue of CO, and the 34S bearing isotopologue of CS. Furthermore, 13CN, SO2, NH2CN, HOCO+, HC5N, H2CS, and C2S were only detected in NGC 253. Tables 2 and 3 list the total column densities of the thirty-six molecules and isotopologues in the eight galaxies (excluding CO, see Sect. 4.2). Molecules detected (tentatively or not) for the first time in each of the galaxies are marked in boldface.
Although tentative, this is the first time that HC5N is detected outside the Milky Way. All the seven brighter transitions based on our synthetic spectra of HC5N appear with measured intensities at level (see Table LABEL:TablaNGC253, and Fig. 5). Deeper observations would be needed to confirm this. We note, however, some inconsistencies in the identification of this species between Meier et al. (2015) and this work. The features that we identify as the HC5N transitions =, , at 87.8, 98.5, and 101.2 GHz respectively, are tentatively identified by Meier et al. (2015) as NH2CHO, CH3CH2CN, and CH3SH, also in the centre of NGC 253. We do not detect emission of those molecules in our survey, although we cannot rule out that this might be due to differences in sensitivity between the IRAM 30 m telescope and ALMA. However, we cover a broader range of frequencies where other HC5N lines are also consistently detected, which makes us favour our identification. HC5N was previously observed towards Galactic dense cores of dark clouds, and seems to trace the initial conditions of star formation (e.g. Suzuki et al. 1992; Rathborne et al. 2008).
In addition, we found that c-C3H2, NS and, especially, CH3CHO were detected in NGC 253 and M 82, but not in the rest of the galaxies of our sample. Outside the Milky Way, CH3CHO was also tentatively detected in NGC 253 (Meier et al. 2015) and towards a galaxy at redshift z=0.89 (Muller et al. 2011). Although not much is known about this molecule, its origin seems to be linked to grain mantle destruction by shocks, and is found in massive star-forming regions (e.g. Chengalur & Kanekar 2003; Bennett et al. 2005).
5.2 Column densities and fractional abundances
For those species not detected in a galaxy, we estimated the 3 upper limit to the column density by assuming a limit to the integrated area () given by
| (2) |
where rms is the 1 noise level of the spectrum that contains the line, is the spectral resolution in velocity units indicated in Sect. 3 for each galaxy, and FWHM is the average full width at half maximum of the Gaussian fits measured for other species in the same galaxy. As FWHM we generally used 95 km s-1 for M 83, 200 km s-1 for NGC 253, 100 km s-1 for M 82, 130 km s-1 for M 51, 240 kms-1 for NGC 1068, 250 km s-1 for NGC 7469, 390 km s-1 for Arp 220, and 210 km s-1 for Mrk 231. Note, however, that these values may differ for some species.
We calculated fractional abundances of all the species (or their upper limits in case they were not detected) relative to the 12C18O (hereafter C18O) column density, which is significantly less affected by opacity effects than the main oxygen isotopologue 12C16O. We note, however, that C18O seems to be enhanced in the two ULIRGs of our sample. In Sect. 7.3, we discuss how this might affect our comparison of abundances among galaxies.
| Molecule | M 83 | NGC 253 | M 82 | M 51 |
|---|---|---|---|---|
| 13CO | ||||
| C18O | ||||
| C17O | ||||
| HCN | ||||
| H13CN | ||||
| HNC | ||||
| HN13C | ||||
| HCO+ | ||||
| H13CO+ | ||||
| HC18O+ | - | - | ||
| HOC+ | ||||
| HCO | ||||
| C2H | ||||
| CN | ||||
| 13CN | ||||
| CH3OH | ||||
| CS | ||||
| C34S | ||||
| 13CS | ||||
| HC3N | ||||
| SO | ||||
| SO2 | ||||
| NS | ||||
| HNCO | ||||
| N2H+ | ||||
| SiO | ||||
| CH3CN | ||||
| CH3CCH | ||||
| c-C3H2 | ||||
| NH2CN | ||||
| HOCO+ | ||||
| OCS | ||||
| C2S | ||||
| H2CS | ||||
| HC5N | ||||
| CH3CHO |
-
Molecules in boldface are new detections for a given galaxy. Column densities have been calculated for molecules clearly detected, as well as for those tentatively detected. Upper limits are shown for species not detected.
| Molecule | NGC 1068 | NGC7469 | Arp 220 | Mrk 231 |
|---|---|---|---|---|
| 13CO | ||||
| C18O | ||||
| C17O | ||||
| HCN | ||||
| H13CN | ||||
| HNC | ||||
| HN13C | ||||
| HCO+ | ||||
| H13CO+ | ||||
| HC18O+ | - | - | - | - |
| HOC+ | ||||
| HCO | ||||
| C2H | ||||
| CN | ||||
| 13CN | ||||
| CH3OH | ||||
| CS | ||||
| C34S | ||||
| 13CS | ||||
| HC3N | ||||
| SO | ||||
| SO2 | ||||
| NS | ||||
| HNCO | ||||
| N2H+ | ||||
| SiO | ||||
| CH3CN | ||||
| CH3CCH | ||||
| c-C3H2 | ||||
| NH2CN | ||||
| HOCO+ | ||||
| OCS | ||||
| C2S | ||||
| H2CS | ||||
| HC5N | ||||
| CH3CHO |
-
Molecules in boldface are new detections in a given galaxy. Column densities have been calculated for molecules clearly detected, as well as for those tentatively detected. Upper limits are shown for species not detected.
6 Key molecular species
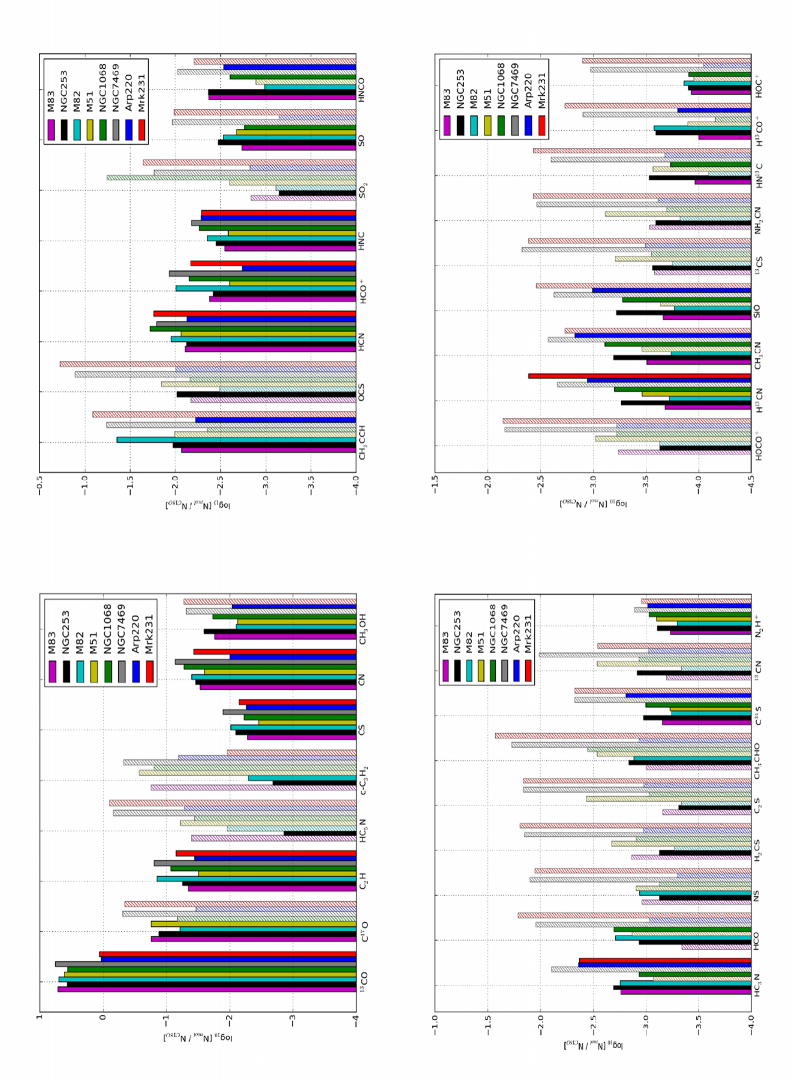
Figure 6 shows the comparison of thirty-five molecular abundances among the eight galaxies in the sample. Table 4 lists the most relevant column density ratios used for the discussion in this section and the following. Based on these results, we indicate here the species presenting the highest abundance contrasts among our galaxy sample. These molecules are potentially good candidates for further high-resolution follow up observations. We note that we only discuss here species where the abundance difference is at least a factor of three.
-
•
CH3CCH is detected in M 83, NGC 253, M 82, and Arp 220, but not in the AGNs of our sample. M 82 has the maximum CH3CCH abundance and, in fact, no other galaxy has been found to have such a high value (at least relative to H2, C34S and C18O, Aladro et al. 2011a, b, 2013). The other galaxies where this species was detected have similar values, five to seven times lower than that of M 82. Interestingly, CH3CCH was not detected in NGC 1068, NGC 7469, M 51, and Mrk 231, which supports the idea that this molecule is highly contrasted between starbursts and AGNs (Aladro et al. 2013). The upper limits to the abundance of M 51 and NGC 1068 are significant, and show that the difference in abundance between M 82 and NGC 1068 is about one order of magnitude.
In the Galaxy, CH3CCH was found to be very abundant in regions of prolific star formation, where its column density is substantially higher ( cm-2, Churchwell & Hollis 1983; Miettinen et al. 2006), than in dark clouds, ( cm-2, Irvine et al. 1981; Markwick et al. 2005). Our values for M 82, M 83, NGC 253 and Arp 220 are of the same order as the ones cited above for high-mass star-forming cores. However, given the different scales in extragalactic and galactic sources, the comparison of the column densities is not straightforward. In addition, it was recently found that CH3CCH is enhanced in PDRs in the Horsehead nebula as compared to dense cores (Guzmán et al. 2014). High temperatures could help to understand high abundances of CH3CCH in these objects, as it may form after the desorption of its chemical precursors from grain mantles. In fact, rotational temperatures derived for Orion-KL, Sgr B2, DR 21 and many other similar sources are in the range [20-50] K (Churchwell & Hollis 1983; Miettinen et al. 2006).
As previously claimed by Aladro et al. (2013), and in agreement with our results here, the abundance of CH3CCH seems to be enhanced in starburst galaxies. It is a known tracer of relatively dense gas (the critical densities for the two transitions observed here are cm-3). Its emission is more widespread than that of other similar molecules, such as CH3CN, and can also be found in regions outside the cores of the molecular clouds (Aladro et al. 2011a). The response of CH3CCH to the presence of UV fields and shocks has not been studied in detail in extragalactic sources. Consequently, the chemistry of CH3CCH is still uncertain, but it might well be that the paths for its production are more effective in the presence of UV radiation fields created by massive star formation (see Aladro et al. 2011b and references therein). Supporting this idea, recent interferometric maps of several species in the central half kiloparsec of NGC 253 show that the emission of CH3CCH has a similar morphology to other PDR tracers, such as C2H (Meier et al. 2015). Thus, it seems that, apart from being a dense gas tracer, CH3CCH can also be considered a PDR tracer.
-
•
HC3N and H13CN show clearly enhanced abundances in Arp 220 and Mrk 231 with respect to the rest of galaxies in our sample. This could be related to larger amounts of dense gas and warm dust present in ULIRGs (as compared to less obscured galaxies, Lindberg et al. 2011), where the dust would prevent their photo-dissociation. On average, the differences between the ULIRGs and the other galaxies is a factor of three for HC3N and seven for H13CN, although the maximum differences between individual galaxies are of factors four and twenty-one for HC3N and H13CN respectively.
-
•
CH3CN and SiO have maximum abundances in Arp 220, which are a factor of 7 higher than those of M 82, which shows the minimum in both cases. Both species are found to be tracers of dense gas and shocks, although enhanced SiO abundances may also be related to X-ray chemistry in AGNs (García-Burillo et al. 2010; Aladro et al. 2013). The species are photo-dissociated in the external layers of molecular clouds if strong UV fields are present. This scenario is in agreement with both molecules having high abundances in Arp 220, which probably has more dense gas and dust, and a minimum in M 82, as it is heavily pervaded by UV fields.
-
•
C2H. Previous observational studies found high abundances of this species in PDRs of starburst galaxies (e.g. Meier & Turner 2005; Fuente et al. 2005; Aladro et al. 2011b). Together with M 82, the highest abundances of C2H in our sample are also those of NGC 7469 and NGC 1068, while M 51 presents the lowest value, followed by Arp 220 and M 83. There is a factor five of difference between the abundances of M 82 and M 51. In the case of NGC 1068 and NGC 7469, significant emission is likely to be arising from the circumnuclear star forming rings, as in NGC 1097 (Martín et al. 2015).
-
•
CN and HCN abundances stand out in NGC 7469, NGC 1068, Mrk 231, and M 82, being the difference between these galaxies and the rest of the sample larger in HCN. In agreement with previous observations (e.g. Aalto et al. 2002; Aalto 2008) and model predictions (Lepp & Dalgarno 1996; Sternberg & Dalgarno 1995; Meijerink & Spaans 2005), our data indicate that CN and HCN could be effectively produced in the X-ray and UV-field dominated regions expected in AGN and starburst galaxies.
-
•
HNCO is tentatively detected for the first time in M 82. This species is claimed to be a good indicator of the evolution of nuclear starbursts in galaxies, with abundances decreasing toward the last evolutionary stages of the starbursts (in those late phases HNCO should be efficiently destroyed by means of reactions involving the abundant UV photons and/or ions). HNCO remained undetected in previous studies of M 82 (Martín et al. 2009a; Aladro et al. 2011b). Our new tentative HNCO line detections in M 82 have intensities of 3 mK, which are higher than the upper limit of 1.3 mK previously estimated by Martín et al. (2009a). Our HNCO abundances in M 82 are four times lower than in NGC 253 and M 83. This contrast is smaller than that found by Martín et al. (2009a) for HNCO/C34S, which shows differences of nearly two orders of magnitude, but goes in the same direction. Therefore, our observations agree with HNCO being a good tracer of the evolutionary stage of starburst galaxies.
-
•
C32S/C34S. Both 32S and 34S are believed to be a product of hydrostatic or explosive oxygen-burning in massive stars and Type Ia supernovae (see Chin et al. 1996 and references therein). However, not much is known apart from some Galactic observations which indicate that 32S/34S increases with the galactocentric radius (Chin et al. 1996). In external galaxies, more data is needed to know how this ratio varies from source to source.
We found that the C32S /C34S line ratio is five times higher in M 82 (with the maximum value of of 21.5 in our sample) than in Arp 220 (minimum value of 4.5, similar to that derived with SO by Martín et al. 2011). This points to a higher CS opacity in Arp 220 where there is much more molecular gas. As a reference value, C32S/C34S in the Galactic centre (GC), the local ISM, and the Solar system is 22, (Frerking et al. 1980). M 82 has a similar value to the GC, which is 3 times higher than that of NGC 253 (7.6). More sophisticated estimates by Martín et al. (2010) and Henkel et al. (2014) give values close to the local interstellar value for NGC 253 (16).
NGC 1068, M 51, NGC 253, and M 83 have C32S/C34S 1 line ratios of , well below the GC and M 82, and closer to the value in Arp 220. Though these ratios point out towards the degree of processing of the ISM in the galactic nuclei, the values should be taken with care, as opacity on the main isotopologue might play an important role in these regions (Martín et al. 2010; Henkel et al. 2014 and references therein). Opacity becomes less of an issue for LIRGs, based on the 13CO/C18O sample measured by Costagliola et al. (2011).
7 Chemical caracterisation of our sample
| Molecular ratio | M 83 | NGC 253 | M 82 | M 51 | NGC 1068 | NGC7469 | Arp 220 | Mrk 231 |
|---|---|---|---|---|---|---|---|---|
| HNCO / C18O | ||||||||
| CH3OH / C18O | ||||||||
| SiO / C18O | ||||||||
| CH3CN / C18O | ||||||||
| CH3CCH / C18O | ||||||||
| SO / C18O | ||||||||
| c-C3H2 / C18O | ||||||||
| HCO / C18O | ||||||||
| C2H / C18O | ||||||||
| N2H+ / C18O | ||||||||
| HNC / C18O | ||||||||
| HCN / C18O | ||||||||
| CN / C18O | ||||||||
| HCN / HCO+ | 1.9 | 2.0 | 1.1 | 3.4 | 2.7 | 1.4 | 4.1 | 2.6 |
| CN / HCN | 3.8 | 4.5 | 3.5 | 2.9 | 2.8 | 4.4 | 1.3 | 2.1 |
| HCN / CS | 1.5 | 0.9 | 1.2 | 2.5 | 3.2 | 1.3 | 1.4 | 2.4 |
-
The errors of the ratios range in general between 2% and 63% and have an average value of 14%. Exceptions to these values are the ratios involving HNCO and CH3CN in M 82, as their column densities have large errors associated.


7.1 Starburst galaxies
The molecular gas in the nuclear region of M 83 is rich in some shock tracers and species formed in dust grains, such as HNCO and CH3OH (Fig. 6 and Table 4), that are easily released through grain mantle evaporation by shock waves. Although the abundances of these two species are high relative to C18O ( and for HNCO and CH3OH respectively), other shock and dense gas tracers are just marginally detected (e.g. SiO, CH3CN, and SO). No H recombination lines were detected in M 83, unlike in the more active starbursts (see SFR in Table 1) M 82 and NGC 253, in spite of all three galaxies having similar beam filling factors. This suggests that big and medium-size HII regions and OB star clusters are relatively scarce in M 83. Accordingly, the PDR-tracers c-C3H2 and HCO were not detected.
As for NGC 253, groups of OB stars create photo-dissociated regions in the outskirts of the molecular clouds. This is confirmed by previous detections of PDR tracers, such as HOC+, CO+, HCO, and c-C3H2 (Martín et al. 2009a), which are easily formed by ion-molecule reactions in gas phase (e.g. Hollis & Churchwell 1983; Thaddeus et al. 1985). However, the gas in NGC 253 is mainly characterised by the presence of many shock tracers and species formed in the icy mantles of dust grains. HNCO, CH3OH, and SO are a factor of two more abundant than in M 83. Also, some other faint shock tracers have been only detected in this galaxy, such as HOCO+ and NS, as well as the sulphur bearing species SO2. H2CS, and C2S (Martín et al. 2003, 2005,) which got confirmed here (see Fig. 6).
The gas in the NE lobe of M 82 is strongly affected by UV fields which shape its chemical composition (e.g. Aladro et al. 2011b). Molecular clouds are highly ionized and fragmented (Fuente et al. 2008) and, according to our results, the PDR tracers c-C3H2, HCO, and HOC+ have slightly higher abundances than in NGC 253 (but just a factor of two or less. See Table 4). The species that shows the largest difference between M 82 and the other two starburst galaxies is CH3CCH, being in the former five times more abundant (see Sect. 6 for more details). Still, some shock tracers, such as CH3OH, SiO, and HNCO, are detectable in the cores of the molecular clouds that are well shielded from the UV radiation (Martín et al. 2006a). However, their abundances are four times lower than in NGC 253, indicating that, although present, shocks do not represent the main heating mechanism of the molecular gas as compared to UV radiation.
7.1.1 A possible chemical scenario of starburst evolution
As commented in Sect. 2, M 83, NGC 253, and M 82 can be taken as examples of starbursts in a early, intermediate, and late stages of evolution. If so, it may be possible to link their evolutionary stages to the chemical composition of their molecular gas. This evolutionary scenario has been progressively fine-tuned by several authors (García-Burillo et al. 2002; Martín et al. 2006b; Aladro et al. 2011b). An early starburst is expected to be chemically characterised by the absence of most PDR tracers (HCO, c-C3H2) and H recombination lines, as well as the presence of only the most common shock-tracers (HNCO, CH3OH, SiO). Physically, first shocks could be caused by close encounters or mergers between galaxies, or collisions of giant molecular cloud complexes (for example, following the bar potential toward the centre of the galaxy, Binney et al. 1991).
In an intermediate starburst stage, with similar characteristics to NGC 253, the stellar population would contain more recently formed young massive stars and supernovae events that ionise the outer layers of the molecular clouds, as seen by the detection of the PDR tracers c-C3H2, HCO and HOC+. During this phase, PDR tracer abundance enhancements are still smaller than those caused by shocks, which would reach their maximum influence over the ISM at this point. Molecules such as CH3OH, HNCO, and SO have higher abundances than in a previous (and later) phase. Other shock tracers would be also detectable, specifically HOCO+ and some sulphur bearing species, such as H2CS, OCS, SO, SO2 and C2S (see Martín et al. 2003, 2005 and Fig. 6), whose abundances are enhanced during the last evolutionary stages of hot cores.
Finally, an advanced starburst such as that found in M 82, would be characterised by super-winds created by massive stars and supernovae, as well as a larger population of high-mass X-ray binaries, which provide a modest X-ray emission, needed to understand the abundance of some molecular species, such as CO+ (Spaans & Meijerink 2007; Chiang & Kong 2011). Stellar winds enrich the ISM with both PDR tracers (HCO, HOC+, c-C3H2, and CH3CCH) and shock-tracers (CH3OH, SiO, OCS, SO), the first ones being more abundant, since UV fields are more intense than in previous stages. Less abundant, or more complex, shock tracers and sulphur species would be easily photo-dissociated by the radiation fields, and thus would become less abundant than in previous starburst phases or not detectable at all.
7.2 Seyfert galaxies
Among the galaxies in our sample, M 51, NGC 1068, and NGC 7469 host an AGN (the first two are classified as Sy 2, and the latter as Sy 1, Osterbrock & Martel 1993). A detailed study devoted to our results in NGC 1068 has been presented by Aladro et al. (2013). The CNDs of these galaxies are surrounded by arms of active star forming regions at kpc distance from their centres. Given the angular resolution of the IRAM 30 m telescope at 3 mm wavelengths (), our data embrace the CNDs as well as the surrounding regions, so some contribution from the star forming rings is expected in our data. Other observations of NGC 1068 indicate that some molecules show significant emission from the starburst ring ( for SiO and for HCO, Usero et al. 2004), while high transitions of the dense gas tracers HCN, HCO+ and CS are hardly detected outside the CND (García-Burillo et al. 2014). Recently, Takajima et al (in prep.) carried out a similar molecular line survey of NGC 1068 with the Nobeyama 45 m telescope. Thanks to the smaller beam size of that telescope at =3 mm, their observations can separate the emission of the CND and that of the starburst ring, and show that the emission of some species such as C2H and N2H+ come mainly from the latter. Unfortunately, there are no similar estimations for NGC 7469 and M 51 calculated for the IRAM 30 m beam at the 3 mm wavelength of our survey.
CH3CCH and c-C3H2 were not detected in any of the AGNs, while HCO and HOC+ are only tentatively seen in NGC 1068, and have similar abundances than in the starburst galaxies. Regarding shocks and dust grain chemistry, most of the tracers (such as OCS, HNCO, or SO) are only detected in NGC 1068. Shocks seem to be affecting part of the gas in the CND of this galaxy (Krips et al. 2011; Viti et al. 2014). CH3OH is also detected in M 51 (not in NGC 7469), but with a clearly lower abundance than in NGC 1068.
Among others, we examined the following relative abundances: HCN/C18O, CN/C18O, HCN/HCO+, CN/HCN, and HCN/CS (Table 4). The last three were proposed as discriminators between AGNs and starburst activities based on two-dimensional plots of line ratios (Kohno et al. 2001; Meijerink et al. 2007; Krips et al. 2008; Izumi et al. 2013). Using our data, HCN/CS, HCO+/HCN, and CN/HCN, either by themselves and plotting one ratio versus other, do not show a correlation with the galactic nuclear activity of our sample. The most probable reason for the lack of trend between all these line ratios and AGNs (versus starburst galaxies) is likely the low angular resolution of the IRAM 30 m telescope, which is not sufficient to separate the CND and the surrounding starburst regions. However, we do see that the HCN abundance is clearly enhanced in AGNs, and the reason for that could be a high temperature-driven chemistry (Izumi et al. 2013), or shocked regions at a few hundred parsecs from the super massive black holes due to outflowing material (Martín et al. 2015). Interestingly, HCN/C18O, CN/C18O, C2H/C18O, and HNC/C18O in M 51 are closer to the starburst results than to the other AGNs (Fig. 6).
SiO is tentatively detected in NGC 1068 but not in M 51 and NGC 7469. In the case of NGC 7469, where lines are weaker, we cannot conclude from the upper limit to the SiO abundance whether the gas chemistry is different. This species usually traces shocks in Galactic and extragalactic sources (Martín-Pintado et al. 1992, 1997; García-Burillo et al. 2000, 2001; Riquelme et al. 2010; Takano et al. 2014). However, some studies (based on observational data or on chemical models) point to SiO as a tracer of X-rays and cosmic rays in the centres of the Milky Way and NGC 1068 (Martín-Pintado et al. 2000; Usero et al. 2004; Aladro et al. 2013). If that is the case in all AGNs, its detection in the other two Seyferts of our sample would be somehow expected (if SiO was strong enough to be detectable). A study devoted to this molecule is necessary to better understand how it is formed under the different regimes (i.e. shock-dominated versus X-ray dominated gas).
Using the IRAM 30 m telescope, Watanabe et al. (2014) carried out a molecular line survey, in the 3 mm and 2 mm bands, outside the nucleus of M 51. They observed two regions in a spiral arm of the galaxy. Their position P1 has twice the SFR of position P2. Both SFRs are quite low, in the range [0.02-0.05]yr-1. This allows us, for the first time, to compare the nuclear molecular gas composition with that outside the central region. Comparing the fractional abundances (with respect to C18O) of the twenty-two species in common between our work and Watanabe’s, we find that the chemical composition of the gas is fairly the same, except for a few cases. H13CO+, HNCO, and c-C3H2 are detected in the P1 position, but not in the centre. On the other hand, we detect H13CN, C34S, and SO, which are not seen in the P2 position. Apart from that, the rest of the molecules have similar abundances, within a factor of 2 in the three positions. One would expect that the chemistry of the gas might change between the nucleus, affected by higher star formation and the proximity of the black hole, and the spiral arms. However, given the beam size of the IRAM 30 m at these frequencies and the source sizes of the three positions, the emission might be so diluted that the differences are cancelled out. Further investigations with interferometers are needed to better understand the change of the gas chemistry as a function of galactocentric radius.
7.3 ULIRGs
Independently of their powering source, the ULIRGs of our sample show some chemical differences with respect to the AGNs and starburst galaxies described in the previous sections, as well as some dissimilarities between Arp 220 and Mrk 231 themselves.
The HNC line intensity in Arp 220 slightly exceeds that of HCN by a factor of 1.3, while for Mrk 231 we obtain HNC/HCN = 0.6. This particular high ratio in Arp 220 was already noticed by Huettemeister et al. (1995) and Aalto et al. (2007), and seems to be due to an overabundance of HNC in this galaxy, a consequence of either mid-IR pumping of the lines, or a chemistry driven by X-ray dominated regions (Meijerink et al. 2007; Aalto et al. 2007). A priori, we cannot rule out any of the two scenarios with our data, since we would need several HCN and HNC transitions in order to estimate the H2 column and volume densities, indispensable to address the situation. However, we dare to favour IR pumping effects, given that the chemical composition of Arp 220 is not similar to the AGNs of our sample (XDR scenario), as we describe below.
CH3CN and SiO are relatively abundant in Arp 220 (few with respect to C18O), but are not detected in Mrk 231. On the other hand, HCO+, H13CN, and CN are four times more abundant in Mrk 231 than in Arp 220. Our results suggest that the Arp 220 chemistry resembles more the starburst galaxies of our sample dominated by shocks, with high abundances of HC3N, CH3OH, HNCO, CH3CN and SiO relative to C18O (10-2,-3), but no PDR tracer detections (c-C3H2, HCO, HOC, except for CH3CCH (just tentatively detected). This would support the infrared pumping of HNC in the galaxy at the expense of a XDR environment, as mentioned before. Mrk 231, in contrast, is characterised by high abundances of CN, HCN and H13CN relative to C18O (10-2,-3), more similar to those found in NGC 1068 and NGC 7469.
Vibrationally excited lines from HC3N, arising from dense ( cm-3) and hot ( K) cores, are detected in Arp 220. They are a factor 4-5 fainter than the corresponding rotational transitions. Assuming that this ratio may be similar for the rest of the galaxies, the expected vibrational intensities in Mrk 231 would be 0.2 mK, which is well below our rms level. Thus, we cannot discard lower level vibrational emission in Mrk 231. However, vibrationally excited HC3N lines would be observable in NGC 253 and M 82, but are not detected. This clearly points to a different excitation between normal starbursts and ULIRGs.
There are also common features between the Mrk 231 and Arp 220 spectra as compared to the rest of the sample. In agreement with previous studies (Greve et al. 2009; Martín et al. 2011; Henkel et al. 2014) 13CO and C18O are equally abundant in both ULIRGs. This may be due to high opacities of the 13CO lines, to an intrinsic underabundance of 13CO in luminous infrared galaxies (Taniguchi et al. 1999), or/and to a C18O overabundance due to the strong starbursts (Matsushita et al. 2009; Martín et al. 2011). High opacities of 13CO in these two galaxies seem unlikely, given the weakness of the 13CO lines relative to12CO (they are 20 times fainter). An overabundance of 18O in Arp 220 has been recently found by González-Alfonso et al. (2014). However, the 12C/13C and 16O/18O line ratios obtained for Arp 220 and Mrk 231 by Henkel et al. (2014) do not favour this last scenario. It can be seen in Fig. 6 that the 13CO/C18O ratios in Mrk 231 and Arp 220 are a factor of 4 lower than in the rest of the galaxies. We obtain a 12CO/13CO relative intensity of 217, which is a factor two lower than that obtained by Greve et al. (2009) for Arp 200 (4310). We note that our 12CO and 13CO lines were observed simultaneously with the EMIR receiver of the 30m telescope, while Greve et al. (2009) used older data to derive this ratio, which may be less accurate.
In addition, HC3N/C18O ratios are clearly higher in the ULIRGs than in the more nearby starbursts and AGNs observed by us. If C18O is overabundant in ULIRGs, then HC3N should be it as well. This effect was already observed in other LIRGs/ULIRGs, and the reason could be a higher amount of dense gas and warm dust that protects the species from being photo-dissociated (Aalto et al. 2007; Costagliola et al. 2011; Lindberg et al. 2011). Thus, HC3N seems to be a well suited species to study the activity in ULIRGs, regardless of the powering source in their nuclei. Also common to Arp 220 and Mrk 231 is the outstanding H13CN/C18O ratio, as previously commented in Sect. 6. Again, if C18O is overabundant in Arp 220 and Mrk 231, it only makes more clear the difference in abundances of HC3N and H13CN between the ULIRGs and the rest of the sample. On the other hand, if C18O has similar values in all the galaxies, it results in an even bigger contrast.
It is also interesting to compare ULIRGs, characterised by strong interactions between galaxies, with isolated galaxies, where the chemical and physical properties are the result of intrinsic and secular mechanisms. In CIG 638, a good representative of an isolated galaxy (see Verley et al. 2007 for the criteria used to define these objects), the C2H/HCN and C2H/HNC integrated intensity ratios were found to be interestingly high (1.0 and 4.3 respectively), either because the galaxy has a lesser amount of dense gas, or/and due to an overproduction of C2H (Martín et al. 2014). The C2H/HCN ratios for Arp 220 and Mrk 231 are a factor of 3 and 4 (respectively) lower than in CIG 638. Moreover, the C2H/HNC integrated intensity ratio is even more contrasted, being 9 and 5 times (respectively) lower in the ULIRGs than in the isolated galaxy. This points to a very likely difference in the gas composition between these two types of galaxies, with the ULIRGs containing more dense gas (associated with their nuclear starbursts), than the isolated galaxies. On the other hand, the rest of the galaxies of our sample have a C2H/HNC ratio in the range which, according to the results derived by Martín et al. (2014), agree with the expected values for “normal” (local) starbursts and AGNs. These results are on average well below the CIG 638 and above the Arp 220 and Mrk 231 values.
8 Summary and conclusions
Using the IRAM 30 m telescope, we performed a molecular line survey towards the circumnuclear regions of eight active galaxies, covering the frequency range [86-116] GHz. The sample is composed by three starburst galaxies, M 83, M 82, and NGC 253, three AGN galaxies with starburst influence, NGC 1068, M 51, and NGC 7469, and two ULIRGs, Mrk 231 and Arp 220. The column densities of twenty-seven species (or their upper limits when they are not detected) were calculated assuming LTE and a single source size for each galaxy based on previous available interferometric maps. The studied species include ten 13C, 18O, 17O, and 34S bearing isotopologues. We compared the abundances, with respect to C18O, among the eight galaxies to characterise the average molecular gas composition of each kind of galaxies. Our results are summarised in Figs. 1 and 6 and Tables 2, 3, and 4.
The comparison among the galaxies allowed us to find out the key species that show the most contrasted abundances, relative to C18O, among the sources. CH3CCH is only detected in starbursts and is a factor of one order of magnitude more abundant in M 82 (the galaxy with the highest abundance) than in NGC 1068 (not detected). This molecule seems to be associated with massive star formation, and might be a good tracer of PDRs. H13CN, CH3CN and SiO have a peak of abundance in Arp 220, which is twenty-one (H13CN), and seven (CH3CN, SiO) times respectively higher than in M 82 (minimum abundance). We find high C2H abundances in M 82, NGC 1068 and NGC 7469, being in NGC 7469 five times higher than in M 51 (minimum). A large part of the C2H emission in the AGNs is expected to come from the starburst rings that surround the CNDs. HNCO shows abundance variations among the starburst galaxies of a factor of four. This latter result supports previous claims of HNCO as a good tracer of the starburst evolutionary state (Martín et al. 2009a). Other species, such as HCN and HC3N, show smaller, though still significant, abundance differences among galaxies by factors of three to four. All the cited molecules constitute good candidates to study the chemistry in galaxy nuclei.
Regarding the starburst galaxies, the molecular gas of M 83 is characterised by relatively high abundances (with respect to C18O, 10-2-10-4) of some shock tracers, such as CH3OH, HNCO and SiO, as well as the absence of both H recombination lines and the PDR tracers c-C3H2 and HCO. In NGC 253 shocks, created by molecular cloud collisions and stellar winds, dominate the heating of the gas, as shown by the presence of several other shock- and dust grain-tracers (e.g. SO, SO2, OCS, HOCO+). In addition, the molecular cloud complexes are ionised by OB clusters, which translates into high intensities of H recombination lines, as well as moderate abundances of c-C3H2, HOC+, and HCO (10-3-10-4). Lastly, M 82 represents a galaxy where UV fields are very intense and create large PDRs. H recombination lines, as well as c-C3H2, HCO, HOC+ and CH3CCH are brighter than in the other starbursts of the sample. CH3OH and HNCO are still observable in the cores of the molecular clouds, although their abundances are clearly lower than in NGC 253 and M 83, due to the lack of shielding from UV photons. We explore a possible scenario where M 83, NGC 253 and M 82 are considered templates of galaxies in young, intermediate and late phases of starbursts, and follow the evolution of the gas composition along time.
As for the AGNs (NGC 1068, NGC 7469, M 51 and Mrk 231), HCN/HCO+ and HCN/CS are quite low in NGC 7469, similar to the values in starburst galaxies; HCN/C18O and CN/C18O, C2H/C18O, and HNC/C18O are also much the same in starbursts and in the low luminosity AGN of M 51. The lack of molecular trends in our AGN galaxies, as compared to the starbursts, seems to be due to their CNDs not being spatially resolved by the IRAM 30 m beam. Remarkably, CH3OH, SiO and HNCO are only detected in NGC 1068.
Finally, the ULIRGs Mrk 231 and Arp 220 show common spectral features, such as the almost identical 13CO and C18O column densities, and higher H13CN/C18O and HC3N/C18O abundance ratios than the rest of the galaxies. Nevertheless, both ULIRGs differ in some line detections that seem to point out to different mechanisms at work in their nuclear regions. In particular, Arp 220 shows emission of HC3N vibrationally excited lines that arise from warm gas ( K), and shock tracers such as CH3OH, HNCO, and SiO. This, together with the lack of PDR tracers such as HOC+, HCO, and c-C3H2, makes Arp 220 resemble the spectrum of a giant hot core-like starburst. On the other hand, Mrk 231 has higher abundances of HCN, H13CN, and HCO+, like the values of NGC 1068 and NGC 7469, thus being more similar to an AGN-dominated galaxy.
Acknowledgements.
This work has been partially funded by MICINN grants AYA2010-21697-C05-01 and FIS2012-39162-C06-01, and Astro-Madrid (CAM S2009/ESP-1496). We wish to thank Jacques Le Bourlot and the Paris’ Master of Astrophysics students for sharing their M 82 data with us, observed with the IRAM 30 m telescope at 3 mm wavelengths. These data were added to our own observations.References
- Aalto et al. (2002) Aalto, S., Polatidis, A. G., Hüttemeister, S., & Curran, S. J. 2002, A&A, 381, 783
- Aalto et al. (2007) Aalto, S., Spaans, M., Wiedner, M. C., Hüttemeister, S. 2007, A&A, 464, 193
- Aalto (2008) Aalto, S. 2008, Ap&SS, 313, 273
- Aalto et al. (2012) Aalto, S., García-Burillo, S., Muller, S., et al. 2012, A&A, 537, A44
- Aladro et al. (2011a) Aladro, R., Martín-Pintado, J., Martín, S., Mauersberger, R., & Bayet, E. 2011a, A&A, 525, A89
- Aladro et al. (2011b) Aladro, R., Martín, S., Martín-Pintado, J., et al. 2011b, A&A, 535, A84
- Aladro et al. (2013) Aladro, R., Viti, S., Bayet, E., et al. 2013, A&A, 549, A39
- Amo-Baladrón et al. (2009) Amo-Baladrón, M. A., Martín-Pintado, J., Morris, M. R., Muno, M. P., & Rodríguez-Fernández, N. J. 2009, ApJ, 694, 943
- Anantharamaiah et al. (2000) Anantharamaiah, K. R., Viallefond, F., Mohan, N. R., Goss, W. M., & Zhao, J. H. 2000, ApJ, 537, 613
- Armijos-Abendaño et al. (2015) Armijos-Abendaño, J., Martín-Pintado, J., Requena-Torres, M. A., Martín, S., & Rodríguez-Franco, A. 2015, MNRAS, 446, 3842
- Bastian et al. (2005) Bastian, N., Gieles, M., Lamers, H. J. G. L. M., Scheepmaker, R. A., & de Grijs, R. 2005, A&A, 431, 905
- Bayet et al. (2009) Bayet, E., Aladro, R., Martín, S., Viti, S., & Martín-Pintado, J. 2009b, ApJ, 707, 126
- Bennett et al. (2005) Bennett, C. J., Jamieson, C. S., Osamura, Y., & Kaiser, R. I. 2005, ApJ, 624, 1097
- Binney et al. (1991) Binney, J., Gerhard, O. E., Stark, A. A., Bally, J., & Uchida, K. I. 1991, MNRAS, 252, 210
- Boksenberg et al. (1977) Boksenberg, A., Carswell, R. F., Allen, D. A., et al. 1977, MNRAS, 178, 451
- Bolatto et al. (2013) Bolatto, A. D., Warren, S. R., Leroy, A. K., et al. 2013, Nature, 499, 450
- Bradford et al. (2003) Bradford, C. M., Nikola, T., Stacey, G. J., et al. 2003, ApJ, 586, 891
- Calzetti et al. (2005) Calzetti, D., Kennicutt, R. C., Jr., Bianchi, L., et al. 2005, ApJ, 633, 871
- Carter et al. (2012) Carter, M., Lazareff, B., Maier, D., et al. 2012, A&A, 538, A89
- Chengalur & Kanekar (2003) Chengalur, J. N., & Kanekar, N. 2003, A&A, 403, L43
- Chiang & Kong (2011) Chiang, Y.-K., & Kong, A. K. H. 2011, MNRAS, 414, 1329
- Chin et al. (1996) Chin, Y.-N., Henkel, C., Whiteoak, J. B., Langer, N., & Churchwell, E. B. 1996, A&A, 305, 960
- Churchwell & Hollis (1983) Churchwell, E., & Hollis, J. M. 1983, ApJ, 272, 591
- Cohen (1976) Cohen, J. G. 1976, ApJ, 203, 587
- Costagliola & Aalto (2010) Costagliola, F., & Aalto, S. 2010, A&A, 515, AA71
- Costagliola et al. (2011) Costagliola, F., Aalto, S., Rodríguez, M. I., et al. 2011, A&A, 528, A30
- Davies et al. (2004) Davies, R. I., Tacconi, L. J., & Genzel, R. 2004, ApJ, 602, 148
- Davies et al. (1998) Davies, R. I., Sugai, H., & Ward, M. J. 1998, MNRAS, 300, 388
- Davis et al. (2013) Davis, T. A., Heiderman, A., Evans, N. J., & Iono, D. 2013, MNRAS, 436, 570
- de Vicente et al. (2000) de Vicente, P., Martín-Pintado, J., Neri, R., & Colom, P. 2000, A&A, 361, 1058
- Downes & Solomon (1998) Downes, D., & Solomon, P. M. 1998, ApJ, 507, 615
- Esquej et al. (2014) Esquej, P., Alonso-Herrero, A., González-Martín, O., et al. 2014, ApJ, 780, 86
- Frerking et al. (1980) Frerking, M. A., Wilson, R. W., Linke, R. A., & Wannier, P. G. 1980, ApJ, 240, 65
- Fuente et al. (2005) Fuente, A., García-Burillo, S., Gerin, M., et al. 2005, ApJ, 619, L155
- Fuente et al. (2008) Fuente, A., García-Burillo, S., Usero, A., et al. 2008, A&A, 492, 675
- Gallagher et al. (2002) Gallagher, S. C., Brandt, W. N., Chartas, G., Garmire, G. P., & Sambruna, R. M. 2002, ApJ, 569, 655
- García-Burillo et al. (2000) García-Burillo, S., Martín-Pintado, J., Fuente, A., & Neri, R. 2000, A&A, 355, 499
- García-Burillo et al. (2002) García-Burillo, S., Martín-Pintado, J., Fuente, A., Usero, A., & Neri, R. 2002, ApJ, 575, L55
- García-Burillo et al. (2001) García-Burillo, S., Martín-Pintado, J., Fuente, A., & Neri, R. 2001, ApJ, 563, L27
- García-Burillo et al. (2010) García-Burillo, S., et al. 2010, A&A, 519, A2
- García-Burillo et al. (2014) García-Burillo, S., Combes, F., Usero, A., et al. 2014, A&A, 567, A125
- Genzel et al. (1995) Genzel, R., Weitzel, L., Tacconi-Garman, L. E., et al. 1995, ApJ, 444, 129
- González-Alfonso et al. (2014) González-Alfonso, E., Fischer, J., Graciá-Carpio, J., et al. 2014, A&A, 561, A27
- Greve et al. (2009) Greve, T. R., Papadopoulos, P. P., Gao, Y., & Radford, S. J. E. 2009, ApJ, 692, 1432
- Guzmán et al. (2014) Guzmán, V. V., Pety, J., Gratier, P., et al. 2014, FaDi, 168, 103
- Handa et al. (1990) Handa, T., Nakai, N., Sofue, Y., Hayashi, M., & Fujimoto, M. 1990, PASJ, 42, 1
- Helfer & Blitz (1995) Helfer, T. T., & Blitz, L. 1995, ApJ, 450, 90
- Henkel et al. (2014) Henkel, C., Asiri, H., Ao, Y., et al. 2014, A&A, 565, A3
- Hollis & Churchwell (1983) Hollis, J. M., & Churchwell, E. 1983, ApJ, 271, 170
- Houghton & Thatte (2008) Houghton, R. C. W., & Thatte, N. 2008, MNRAS, 385, 1110
- Huettemeister et al. (1995) Huettemeister, S., Henkel, C., Mauersberger, R., et al. 1995, A&A, 295, 571
- Inoue et al. (2000) Inoue, A. K., Hirashita, H., & Kamaya, H. 2000, PASJ, 52, 539
- Irvine et al. (1981) Irvine, W. M., Hoglund, B., Friberg, P., Askne, J., & Ellder, J. 1981, ApJ, 248, L113
- Izumi et al. (2013) Izumi, T., Kohno, K., Martín, S., et al. 2013, PASJ, 65, 100
- Jiménez-Serra et al. (2008) Jiménez-Serra, I., Caselli, P., Martín-Pintado, J., & Hartquist, T. W. 2008, A&A, 482, 549
- Kennicutt & Kent (1983) Kennicutt, R. C., Jr., & Kent, S. M. 1983, AJ, 88, 1094
- Knudsen et al. (2007) Knudsen, K. K., Walter, F., Weiss, A., et al. 2007, ApJ, 666, 156
- Kohno et al. (1996) Kohno, K., Kawabe, R., Tosaki, T., & Okumura, S. K. 1996, ApJ, 461, L29
- Kohno et al. (2001) Kohno, K., Matsushita, S., Vila-Vilaró, B., et al. 2001, The Central Kiloparsec of Starbursts and AGN: The La Palma Connection, 249, 672
- Krips et al. (2008) Krips, M., Neri, R., García-Burillo, S., et al. 2008, ApJ, 677, 262
- Krips et al. (2011) Krips, M., Martín, S., Eckart, A., et al. 2011, ApJ, 736, 37
- Lepp & Dalgarno (1996) Lepp, S., & Dalgarno, A. 1996, A&A, 306, L21
- Lindberg et al. (2011) Lindberg, J. E., Aalto, S., Costagliola, F., et al. 2011, A&A, 527, A150
- Markwick et al. (2005) Markwick, A. J., Charnley, S. B., Butner, H. M., & Millar, T. J. 2005, ApJ, 627, L117
- Martín-Pintado et al. (1992) Martín-Pintado, J., Bachiller, R., & Fuente, A. 1992, A&A, 254, 315
- Martín-Pintado et al. (1997) Martín-Pintado, J., de Vicente, P., Fuente, A., & Planesas, P. 1997, ApJ, 482, L45
- Martín-Pintado et al. (2000) Martín-Pintado, J., de Vicente, P., Rodríguez-Fernández, N. J., Fuente, A., & Planesas, P. 2000, A&A, 356, L5
- Martín-Pintado et al. (2005) Martín-Pintado, J., Jiménez-Serra, I., Rodríguez-Franco, A., Martín, S., & Thum, C. 2005, ApJ, 628, L61
- Martín et al. (2003) Martín, S., Mauersberger, R., Martín-Pintado, J., García-Burillo, S., & Henkel, C. 2003, A&A, 411, L465
- Martín et al. (2005) Martín, S., Martín-Pintado, J., Mauersberger, R., Henkel, C., & García-Burillo, S. 2005, ApJ, 620, 210
- Martín et al. (2006a) Martín, S., Martín-Pintado, J., & Mauersberger, R. 2006a, A&A, 450, L13
- Martín et al. (2006b) Martín, S., Mauersberger, R., Martín-Pintado, J., Henkel, C., & García-Burillo, S. 2006b, ApJS, 164, 450
- Martín et al. (2008) Martín, S., Requena-Torres, M. A., Martín-Pintado, J., & Mauersberger, R. 2008, ApJ, 678, 245
- Martín et al. (2009a) Martín, S., Martín-Pintado, J., & Mauersberger, R. 2009a, ApJ, 694, 610
- Martín et al. (2009b) Martín, S., Martín-Pintado, J., & Viti, S. 2009b, ApJ, 706, 1323
- Martín et al. (2010) Martín, S., Aladro, R., Martín-Pintado, J., & Mauersberger, R. 2010, A&A, 522, A62
- Martín et al. (2011) Martín, S., Krips, M., Martín-Pintado, J., et al. 2011, A&A, 527, A36
- Martín et al. (2014) Martín, S., Verdes-Montenegro, L., Aladro, R., et al. 2014, A&A, 563, L6
- Martín et al. (2015) Martín, S., Kohno, K., Izumi, T., et al. 2015, A&A, 573, 116
- Matsushita et al. (1998) Matsushita, S., Kohno, K., Vila-Vilaro, B., Tosaki, T., & Kawabe, R. 1998, ApJ, 495, 267
- Matsushita et al. (2009) Matsushita, S., Iono, D., Petitpas, G. R., et al. 2009, ApJ, 693, 56
- Meier & Turner (2005) Meier, D. S., & Turner, J. L. 2005, ApJ, 618, 259
- Meier et al. (2015) Meier, D. S., Walter, F., Bolatto, A. D., et al. 2015, ApJ, 801, 63
- Meijerink & Spaans (2005) Meijerink, R., & Spaans, M. 2005, A&A, 436, 397
- Meijerink et al. (2007) Meijerink, R., Spaans, M., & Israel, F. P. 2007, A&A, 461, 793
- Meixner et al. (1990) Meixner, M., Puchalsky, R., Blitz, L., Wright, M., & Heckman, T. 1990, ApJ, 354, 158
- Miettinen et al. (2006) Miettinen, O., Harju, J., Haikala, L. K., & Pomrén, C. 2006, A&A, 460, 721
- Mühle et al. (2007) Mühle, S., Seaquist, E. R., & Henkel, C. 2007, ApJ, 671, 1579
- Müller et al. (2001) Müller, H. S. P., Thorwirth, S., Roth, D. A., & Winnewisser, G. 2001, A&A, 370, L49
- Müller et al. (2005) Müller, H. S. P., Schlöder, F., Stutzki, J., & Winnewisser, G. 2005, Journal of Molecular Structure, 742, 215
- Muller et al. (2011) Muller, S., Beelen, A., Guélin, M., et al. 2011, A&A, 535, A103
- Muraoka et al. (2009) Muraoka, K., Kohno, K., Tosaki, T., et al. 2009, PASJ, 61, 163
- Osterbrock & Martel (1993) Osterbrock, D. E., & Martel, A. 1993, ApJ, 414, 552
- Penzias & Burrus (1973) Penzias, A. A., & Burrus, C. A. 1973, ARA&A, 11, 51
- Pickett et al. (1998) Pickett, H. M., Poynter, I. R. L., Cohen, E. A., et al. 1998, J. of Quantitative Spect. and Rad. Transf., 60, 883
- Rathborne et al. (2008) Rathborne, J. M., Lada, C. J., Muench, A. A., Alves, J. F., & Lombardi, M. 2008, ApJS, 174, 396
- Riquelme et al. (2010) Riquelme, D., Bronfman, L., Mauersberger, R., May, J., & Wilson, T. L. 2010, A&A, 523, A45
- Sakamoto et al. (2009) Sakamoto, K., Aalto, S., Wilner, D. J., et al. 2009, ApJ, 700, L104
- Sakamoto et al. (2011) Sakamoto, K., Mao, R.-Q., Matsushita, S., et al. 2011, ApJ, 735, 19
- Salo & Laurikainen (2000) Salo, H., & Laurikainen, E. 2000, MNRAS, 319, 393
- Sanders et al. (2003) Sanders, D. B., Mazzarella, J. M., Kim, D.-C., Surace, J. A., & Soifer, B. T. 2003, AJ, 126, 1607
- Savage & Ziurys (2004) Savage, C., & Ziurys, L. M. 2004, ApJ, 616, 966
- Schinnerer et al. (2000) Schinnerer, E., Eckart, A., Tacconi, L. J., Genzel, R., & Downes, D. 2000, ApJ, 533, 850
- Schuster et al. (2007) Schuster, K. F., Kramer, C., Hitschfeld, M., Garcia-Burillo, S., & Mookerjea, B. 2007, A&A, 461, 143
- Spaans & Meijerink (2007) Spaans, M., & Meijerink, R. 2007, ApJ, 664, L23
- Stacey et al. (1999) Stacey, G. J., Swain, M. R., Bradford, C. M., et al. 1999, The Universe as Seen by ISO, 427, 973
- Sternberg & Dalgarno (1995) Sternberg, A., & Dalgarno, A. 1995, ApJS, 99, 565
- Strickland et al. (2004) Strickland, D. K., Heckman, T. M., Colbert, E. J. M., Hoopes, C. G., & Weaver, K. A. 2004, ApJS, 151, 193
- Suzuki et al. (1992) Suzuki, H., Yamamoto, S., Ohishi, M., et al. 1992, ApJ, 392, 551
- Takano et al. (2014) Takano, S., Nakajima, T., Kohno, K., et al. 2014, PASJ, 66, 75
- Taniguchi et al. (1999) Taniguchi, Y., Ohyama, Y., & Sanders, D. B. 1999, ApJ, 522, 214
- Thaddeus et al. (1985) Thaddeus, P., Vrtilek, J. M., & Gottlieb, C. A. 1985, ApJ, 299, L63
- Taylor et al. (1999) Taylor, G. B., Silver, C. S., Ulvestad, J. S., & Carilli, C. L. 1999, ApJ, 519, 185
- Telesco & Harper (1980) Telesco, C. M., & Harper, D. A. 1980, ApJ, 235, 392
- Tully (1974) Tully, R. B. 1974, ApJS, 27, 437
- Tunnard et al. (2015) Tunnard, R., Greve, T. R., Garcia-Burillo, S., et al. 2015, ApJ, 800, 25
- Turner & Ho (1985) Turner, J. L., & Ho, P. T. P. 1985, ApJ, 299, L77
- Usero et al. (2004) Usero, A., García-Burillo, S., Fuente, A., Martín-Pintado, J., & Rodríguez-Fernández, N. J. 2004, A&A, 419, 897
- van der Werf et al. (2010) van der Werf, P. P., Isaak, K. G., Meijerink, R., et al. 2010, A&A, 518, L42
- Verley et al. (2007) Verley, S., Leon, S., Verdes-Montenegro, L., et al. 2007, A&A, 472, 121
- Viti et al. (2001) Viti, S., Caselli, P., Hartquist, T. W., & Williams, D. A. 2001, A&A, 370, 1017
- Viti et al. (2014) Viti, S., García-Burillo, S., Fuente, A., et al. 2014, A&A, 570, AA28
- Walter et al. (2008) Walter, F., Brinks, E., de Blok, W. J. G., et al. 2008, AJ, 136, 2563
- Watanabe et al. (2014) Watanabe, Y., Sakai, N., Sorai, K., & Yamamoto, S. 2014, ApJ, 788, 4
- Wilson & Rood (1994) Wilson, T. L., & Rood, R. 1994, ARA&A, 32, 191
- Wilson et al. (1991) Wilson, A. S., Helfer, T. T., Haniff, C. A., & Ward, M. J. 1991, ApJ, 381, 79
Appendix A Simulated fit results for individual spectra.
| Line | Frequency | Comments | ||||
|---|---|---|---|---|---|---|
| MHz | K km s-1 | km s-1 | km s-1 | mK | ||
| H13CN | 86340.2 | 3.55 | hf, t | |||
| H13CO+ | 86754.3 | 510 | 95 | 2.07 | t | |
| SiO | 86847.0 | 510 | 95 | 2.40 | t | |
| HN13C | 87090.8 | 510 | 95 | 1.11 | t | |
| C2H | 87316.9 | 22.62 | hf | |||
| HNCO | 87925.2 | 510 | 95 | 6.79 | m | |
| HCN | 88631.8 | 97.47 | hf | |||
| HCO+ | 89188.6 | 90.96 | ||||
| HOC | 89487.4 | 95 | 2.87 | t | ||
| HNC | 90663.6 | 41.45 | ||||
| HC3N | 90979.0 | 95 | 4.34 | |||
| CH3CN | 91987.0 | 510 | 95 | 2.33 | m, t | |
| N2H+ | 93173.7 | 510 | 95 | 13.32 | m | |
| C34S | 96412.9 | 510 | 95 | 4.19 | ||
| CH3OH | 96741.4 | 17.13 | m | |||
| CS | 97981.0 | 95 | 32.04 | |||
| SO | 99299.9 | 3.49 | t | |||
| HC3N | 100076.4 | 95 | 3.51 | t | ||
| CH3CCH | 102548.0 | 95 | 4.23 | m, t | ||
| CH3OH | 108893.9 | 3.28 | t | |||
| HC3N | 109173.6 | 95 | 2.61 | t | ||
| C18O | 109782.2 | 33.65 | ||||
| HNCO | 109905.8 | 510 | 95 | 6.87 | m | |
| 13CO | 110201.4 | 165.00 | ||||
| CH3CN | 110383.5 | 510 | 95 | 2.65 | m, t | |
| C17O | 112359.3 | 510 | 95 | 6.24 | t | |
| CN | 113191.3 | 31.14 | m | |||
| CN | 113491.0 | 91.81 | m | |||
| 12CO | 115271.2 | 1940.18 |
-
Remarks: blended line; multi-transition line; hyperfine transition; tentative detection. Parameters without errors were fixed when fitting the lines.
| Line | Frequency | Comments | |||||
|---|---|---|---|---|---|---|---|
| MHz | K km s-1 | km s-1 | km s-1 | mK | |||
| NH2CN | 80504.6 | 250 | 180 | 3.68 | t | ||
| C2S | 81505.2 | 250 | 200 | 3.08 | t | ||
| HC3N | 81881.5 | 250 | 180 | 38.41 | |||
| c-C3H2 | 82093.6 | 250 | 180 | 8.67 | |||
| HC5N (31-30) | 82539.3 | 240 | 180 | 5.15 | t | ||
| c-C3H2 | 82966.2 | 250 | 180 | 3.94 | t | ||
| CH3OH | 84521.2 | 10.9 | |||||
| OCS | 85139.1 | 250 | 200 | 6.53 | b | ||
| HC18O+ | 85162.2 | 250 | 200 | 3.93 | b | ||
| HC5N (32-31) | 85201.6 | 240 | 180 | 4.78 | b | ||
| c-C3H2 | 85338.9 | 250 | 180 | 31.09 | |||
| CH3CCH | 85457.3 | 250 | 200 | 12.39 | m | ||
| HOCO+ | 85531.5 | 250 | 180 | 1.98 | t | ||
| H42 | 85688.4 | - | 230 | 180 | 8 | b | |
| SO | 86094.0 | 250 | 180 | 4.60 | |||
| H13CN | 86340.2 | 24.25 | hf | ||||
| HCO | 86670.8 | 250 | 200 | 4.68 | b, hf | ||
| H13CO+ | 86754.3 | 250 | 200 | 17.86 | b | ||
| SiO | 86847.0 | 250 | 200 | 22.30 | |||
| HN13C | 87090.8 | 250 | 200 | 9.81 | |||
| C2H | 87316.9 | 106.10 | hf | ||||
| HC5N (33-32) | 87863.9 | 240 | 180 | 4.39 | t, b | ||
| HNCO | 87925.2 | 250 | 200 | 26.99 | m, b | ||
| HCN | 88631.8 | 305.20 | hf | ||||
| HCO+ | 89188.6 | 266.77 | |||||
| HOC | 89487.4 | 250 | 200 | 10.02 | |||
| HNC | 90663.6 | 177.46 | b | ||||
| HC5N (34-33) | 90526.2 | 240 | 180 | 3.99 | t, b | ||
| HC3N | 90979.0 | 250 | 180 | 43.90 | |||
| CH3CN | 91987.0 | 250 | 180 | 18.55 | m, b | ||
| H41 | 92034.4 | - | 230 | 180 | 5 | b | |
| 13CS | 92494.3 | 250 | 200 | 4.65 | |||
| N2H+ | 93173.7 | 180 | 54.89 | m, b | |||
| HC5N (35-34) | 93188.5 | 240 | 180 | 3.59 | t, b | ||
| CH3CHO A | 93580.9 | 250 | 200 | 2.44 | t | ||
| CH3CHO E | 93595.2 | 250 | 200 | 2.43 | t | ||
| C2S | 93870.1 | 250 | 200 | 3.18 | t | ||
| CH3OH | 95169.4 | 5.38 | |||||
| HC5N (36-35) | 95850.7 | 240 | 180 | 3.21 | t, b | ||
| CH3OH | 95914.3 | 250 | 200 | 3.80 | b | ||
| CH3CHO E | 95947.4 | 250 | 200 | 3.04 | b, t | ||
| CH3CHO A | 95963.4 | 250 | 200 | 3.06 | b, t | ||
| C34S | 96412.9 | 250 | 200 | 20.58 | |||
| CH3OH | 96741.4 | 250 | 200 | 78.40 | m, b | ||
| OCS | 97301.2 | 250 | 200 | 6.47 | |||
| CH3OH | 97582.8 | 250 | 200 | 3.89 | |||
| CS | 97981.0 | 162 | |||||
| HC5N (37-36) | 98512.9 | 240 | 180 | 2.83 | t | ||
| H40 | 99023.0 | 237 | 180 | 7 | |||
| SO | 99299.9 | 250 | 180 | 21.91 | b | ||
| NH2CN | 99311.2 | 250 | 180 | 5.58 | m, b | ||
| NH2CN | 99972.7 | 250 | 180 | 5.51 | |||
| HC3N | 100076.4 | 250 | 180 | 47.02 | |||
| NH2CN | 100629.5 | 250 | 180 | 5.66 | m | ||
| HC5N | 101175.1 | 240 | 180 | 2.49 | t | ||
| H2CS | 101477.6 | 250 | 180 | 3.02 | t | ||
| CH3CCH | 102548.0 | 250 | 200 | 18.10 | m | ||
| H2CS | 103040.2 | 250 | 180 | 4.33 | t | ||
| HC5N | 103837.3 | 240 | 180 | 2.16 | t | ||
| SO2 | 104029.4 | 240 | 180 | 2.90 | t | ||
| H2CS | 104617.0 | 250 | 180 | 3.15 | t | ||
| C2S | 106349.7 | 250 | 200 | 2.87 | t | ||
| H39 | 106737.4 | 220 | 181 | 9 | |||
| HOCO+ | 106913.6 | 250 | 180 | 3.07 | t | ||
| 13CN | 108651.3 | 250 | 200 | 9.72 | m, b | ||
| 13CN | 108657.6 | 250 | 200 | 9.72 | m, b | ||
| 13CN | 108780.2 | 250 | 200 | 8.92 | m | ||
| CH3OH | 108893.9 | 250 | 200 | 16.39 | |||
| HC3N | 109173.6 | 250 | 180 | 47.56 | |||
| SO | 109252.2 | 250 | 180 | 7.28 | t | ||
| OCS | 109463.1 | 250 | 200 | 5.65 | b, t | ||
| C18O | 109782.2 | 102.65 | |||||
| HNCO | 109905.8 | 250 | 200 | 35.55 | m | ||
| 13CO | 110201.4 | 370.67 | |||||
| CH3CN | 110383.5 | 250 | 180 | 25.94 | m | ||
| C17O | 112359.3 | 200 | 14.77 | ||||
| CN | 113191.3 | 184.30 | m | ||||
| CN | 113491.0 | 425.50 | m | ||||
| NS | 115153.9 | 250 | 180 | 8.86 | m, b, t | ||
| 12CO | 115271.2 | 4769.30 | b | ||||
| H38 | 115274.4 | - | 230 | 180 | 7 | b | |
| NS | 115556.2 | 250 | 180 | 8.32 | m, t | ||
| See caption of Table 5 for details. |
| Line | Frequency | Comments | |||||
| MHz | K km s-1 | km s-1 | km s-1 | mK | |||
| c-C3H2 | 84727.7 | 300 | 100 | 1.34 | t | ||
| HC18O+ | 85162.2 | 300 | 100 | 3.82 | b | ||
| c-C3H2 | 85338.9 | 300 | 100 | 31.16 | |||
| CH3CCH | 85457.3 | 100 | 23.94 | m | |||
| H42 | 85688.4 | - | 310 | 100 | 11 | b | |
| H13CN | 86340.2 | 300 | 100 | 3.54 | hf, t | ||
| HCO | 86670.8 | 300 | 100 | 2.99 | b, t | ||
| H13CO+ | 86754.3 | 300 | 100 | 8.39 | b | ||
| SiO | 86847.0 | 300 | 100 | 2.87 | b, t | ||
| C2H | 87316.9 | 83.31 | hf | ||||
| HNCO | 87925.2 | 300 | 100 | 2.41 | m, t | ||
| HCN | 88631.8 | 182.00 | hf | ||||
| HCO+ | 89188.6 | 236 | |||||
| HOC | 89487.4 | 300 | 100 | 5.21 | |||
| HNC | 90663.6 | 83.79 | |||||
| HC3N | 90979.0 | 11.64 | |||||
| CH3CN | 91987.0 | 300 | 100 | 2.19 | m, b | ||
| H41 | 92034.4 | - | 280 | 120 | 9 | b | |
| N2H+ | 93173.7 | 100 | 15.35 | m | |||
| CH3CHO A | 93580.9 | 300 | 100 | 2.12 | m, t | ||
| C34S | 96412.9 | 100 | 5.46 | ||||
| CH3OH | 96741.4 | 300 | 100 | 9.17 | m | ||
| CS | 97981.0 | 84.66 | |||||
| H40 | 99023.0 | 100 | 13 | ||||
| SO | 99299.9 | 300 | 100 | 10.39 | |||
| HC3N | 100076.4 | 12.26 | |||||
| CH3CCH | 102548.0 | 100 | 32.01 | m | |||
| H39 | 106737.4 | 100 | 9 | ||||
| CH3OH | 108893.9 | 300 | 100 | 2.39 | m | ||
| HC3N | 109173.6 | 12.14 | |||||
| C18O | 109782.2 | 52.35 | |||||
| HNCO | 109905.8 | 300 | 100 | 4.23 | m, t | ||
| 13CO | 110201.4 | 240.09 | |||||
| CH3CN | 110383.5 | 300 | 100 | 2.56 | m, t | ||
| C17O | 112359.3 | 300 | 100 | 3.55 | t | ||
| CN | 113191.3 | 69.10 | m | ||||
| CN | 113491.0 | 194.80 | m | ||||
| NS | 115153.9 | 300 | 100 | 6.11 | m, b, t | ||
| 12CO | 115271.2 | 3892.23 | b | ||||
| H38 | 115274.4 | - | 300 | 100 | 9 | b | |
| NS | 115556.2 | 300 | 100 | 5.55 | m, t |
-
See caption of Table 5 for details.
| Line | Frequency | Comments | |||||
|---|---|---|---|---|---|---|---|
| MHz | K km s-1 | km s-1 | km s-1 | mK | |||
| H13CN | 86340.2 | 470 | 130 | 1.38 | hf, t | ||
| C2H | 87316.9 | 5.04 | hf | ||||
| HCN | 88631.8 | 38.75 | hf | ||||
| HCO+ | 89188.6 | 18.98 | |||||
| HNC | 90663.6 | 13.23 | |||||
| N2H+ | 93173.7 | 4.70 | m | ||||
| C34S | 96412.9 | 470 | 130 | 1.24 | t | ||
| CH3OH | 96741.4 | 470 | 130 | 1.72 | m, t | ||
| CS | 97981.0 | 7.74 | |||||
| SO | 99299.9 | 470 | 130 | 1.80 | t | ||
| C18O | 109782.2 | 11.34 | |||||
| 13CO | 110201.4 | 50.40 | |||||
| C17O | 112359.3 | 470 | 130 | 2.14 | t | ||
| CN | 113191.3 | 12.16 | m | ||||
| CN | 113491.0 | 34.53 | m | ||||
| 12CO | 115271.2 | 379.30 |
-
See caption of Table 5 for details.
| Line | Frequency | Comments | |||||
|---|---|---|---|---|---|---|---|
| MHz | K km s-1 | km s-1 | km s-1 | mK | |||
| H13CN | 86340.2 | 180 | 4.03 | hf | |||
| HCO | 86670.8 | 1100 | 240 | 1.08 | t, b, hf | ||
| SiO | 86847.0 | 1100 | 240 | 2.36 | t | ||
| HN13C | 87090.8 | 1100 | 150 | 1.20 | t | ||
| C2H | 87316.9 | 18.51 | b, hf | ||||
| HNCO | 87925.2 | 1100 | 240 | 2.20 | m, t, b | ||
| HCN | 88631.8 | 77.84 | hf | ||||
| HCO+ | 89188.6 | 56.30 | |||||
| HOC | 89487.4 | 1110 | 1.23 | t | |||
| HNC | 90663.6 | 31.12 | |||||
| HC3N | 90979.0 | 190 | 3.52 | ||||
| CH3CN | 91987.0 | 1100 | 240 | 2.30 | m, t | ||
| N2H+ | 93173.7 | 240 | 7.62 | m | |||
| C34S | 96412.9 | 1100 | 240 | 2.64 | t | ||
| CH3OH | 96741.4 | 1100 | 240 | 5.93 | m | ||
| CS | 97981.0 | 17.14 | b | ||||
| SO | 99299.9 | 3.13 | |||||
| HC3N | 100076.4 | 190 | 3.95 | ||||
| HC3N | 109173.6 | 190 | 4.19 | t | |||
| C18O | 109782.2 | 14.02 | |||||
| 13CO | 110201.4 | 49.36 | |||||
| CH3CN | 110383.5 | 1100 | 240 | 2.71 | m, t | ||
| CN | 113191.3 | 43.20 | m | ||||
| CN | 113491.0 | 87.19 | m | ||||
| 12CO | 115271.2 | 624.39 | m |
-
CO was fitted with a triple Gaussian, and its parameters refer to the central one. See caption of Table 5 for more details.
| Line | Frequency | Comments | ||||
|---|---|---|---|---|---|---|
| MHz | K km s-1 | km s-1 | km s-1 | mK | ||
| C2H | 87316.9 | 4.19 | hf | |||
| HCN | 88631.8 | 9.18 | hf | |||
| HCO+ | 89188.6 | 10.90 | ||||
| HNC | 90663.6 | 250 | 4.07 | |||
| CS | 97981.0 | 3.48 | t | |||
| C18O | 109782.2 | 4850 | 250 | 1.58 | t | |
| 13CO | 110201.4 | 8.92 | ||||
| CN | 113191.3 | 6.33 | m, t | |||
| CN | 113491.0 | 14.14 | m | |||
| 12CO | 115271.2 | 208.61 |
-
See caption of Table 5 for details.
| Line | Frequency | Comments | ||||
|---|---|---|---|---|---|---|
| MHz | K km s-1 | km s-1 | km s-1 | mK | ||
| H13CN | 86340.2 | 4.46 | hf | |||
| H13CO+ | 86754.3 | 5350 | 390 | 0.95 | b, t | |
| SiO | 86847.0 | 5350 | 3.42 | b | ||
| C2H | 87316.9 | 6.29 | hf | |||
| HCN | 88631.8 | 18.02 | hf | |||
| HCO+ | 89188.6 | 450 | 9.13 | |||
| HNC | 90663.6 | 17.24 | ||||
| HC3N | 90979.0 | 8.11 | ||||
| HC3N,v7=1 | 91202.7 | 5331 | 390 | 1.67 | t | |
| HC3N,v7=1 | 91333.4 | 5331 | 390 | 1.67 | t | |
| CH3CN | 91987.0 | 5350 | 3.32 | m | ||
| N2H+ | 93173.7 | 5.42 | m | |||
| C34S | 96412.9 | 450 | 2.46 | t | ||
| CH3OH | 96741.4 | 5350 | 390 | 2.09 | m, t | |
| CS | 97981.0 | 9.14 | ||||
| HC3N | 100076.4 | 10.00 | ||||
| HC3N,v7=1 | 100322.4 | 5331 | 390 | 2.38 | ||
| HC3N,v7=1 | 100466.2 | 5331 | 390 | 2.39 | ||
| HC3N | 109173.6 | 11.78 | ||||
| HC3N,v6=1 | 109422.0 | 5331 | 390 | 3.28 | ||
| HC3N,v7=1 | 109598.8 | 5331 | 390 | 3.29 | ||
| C18O | 109782.2 | 5330 | 450 | 9.02 | b | |
| HNCO | 109905.8 | 2.64 | m, b | |||
| 13CO | 110201.4 | 5330 | 450 | 9.71 | b | |
| CH3CN | 110383.5 | 5350 | 4.18 | m, b | ||
| CN | 113191.3 | 4.92 | m | |||
| CN | 113491.0 | 9.67 | m | |||
| 12CO | 115271.2 | 207.80 |
-
See caption of Table 5 for details.
| Line | Frequency | Comments | |||||
|---|---|---|---|---|---|---|---|
| MHz | K km s-1 | km s-1 | km s-1 | mK | |||
| H13CN | 86340.2 | 210 | 2.02 | hf, t | |||
| C2H | 87316.9 | 210 | 1.46 | hf, t | |||
| HCN | 88631.8 | 8.86 | hf | ||||
| HCO+ | 89188.6 | 5.23 | |||||
| HNC | 90663.6 | 3.06 | |||||
| HC3N | 90979.0 | 210 | 1.10 | t | |||
| CS | 97981.0 | 210 | 1.96 | t | |||
| HC3N | 100076.4 | 210 | 1.40 | t | |||
| HC3N | 109173.6 | 210 | 1.68 | t | |||
| C18O | 109782.2 | 210 | 1.57 | ||||
| 13CO | 110201.4 | 210 | 1.81 | ||||
| CN | 113191.3 | 1.32 | m, t | ||||
| CN | 113491.0 | 3.46 | m | ||||
| 12CO | 115271.2 | 210 | 44.25 |
-
See caption of Table 5 for details.