Accurate and MeV-electron track reconstruction with an ultra-low diffusion Xenon/TMA TPC at atmospheres
Abstract
We report the performance of a 10 atm Xenon/trimethylamine time projection chamber (TPC) for the detection of X-rays (30 keV) and -rays (0.511-1.275 MeV) in conjunction with the accurate tracking of the associated electrons. When operated at such a high pressure and in 1%-admixtures, trimethylamine (TMA) endows Xenon with an extremely low electron diffusion ( mm- (longitudinal), mm- (transverse) along 1 m drift) besides forming a convenient ‘Penning-Fluorescent’ mixture. The TPC, that houses 1.1 kg of gas in its fiducial volume, operated continuously for 100 live-days in charge amplification mode. The readout was performed through the recently introduced microbulk Micromegas technology and the AFTER chip, providing a 3D voxelization of 8mm8mm1.2mm for approximately 10 cm/MeV-long electron tracks. Energy resolutions at full width half maximum (FWHM) inside the fiducial volume ranged from (30keV) to (1.275MeV).
This work was developed as part of the R&D program of the NEXT collaboration for future detector upgrades in the search of the neutrino-less double beta decay () in 136Xe, specifically those based on novel gas mixtures. Therefore we ultimately focus on the calorimetric and topological properties of the reconstructed MeV-electron tracks. In particular, the obtained energy resolution has been decomposed in its various contributions and improvements towards achieving the levels obtained in small sensors are discussed.
keywords:
Double-beta decay , gamma and electron detection , microbulk Micromegas , time projection chamber , trimethylamine , high pressure Xenon , Fluorescent mixtures , Penning effectPACS:
29.40 , CsThe NEXT collaboration
, , , , , , , , , , , , , , , , , , , , , , , , , , , , , , , , , , , , , , , , , , , , , , , , , , , , , , , , , , , , , , , , ,
C. , , , , , , , , , , , , , , , , ,
1 Introduction
The ability to perform -ray spectroscopy in conjunction with the accurate electron(s) reconstruction is of contemporary interest in fundamental science and technology. Such an asset is of utmost importance for instance in some implementations of Compton cameras either in standard [1] or electron-tracking mode [2], and X-ray polarimetry [3, 4] as well as nuclear physics [5, 6]. Generally speaking, a ‘dream’ scenario for detection is that where full event containment can be achieved in a medium with sparse ionization; an optimal (‘intrinsic’) energy resolution emerges from the subsequent sub-Poisson fluctuations of the released charge [7], while the sense of the momentum vector can be obtained through resolving distinct track features such as characteristic X-ray emission at production and Bragg peak [8]. Reconstruction of the track’s direction requires multiple scattering to be minimized and fidelity to the primary ionization trail to be ensured by proper design choices. If such is the case, accurate information about the photon energy, direction and sense of its momentum vector and polarization can be retrieved from the emerging lepton tracks, involving in general multi-site cluster reconstruction algorithms. For very rare nuclear -decays, on the other hand, an extremely high selectivity and background suppression can be achieved from the combined calorimetric and topological information [5].
2 High Pressure Xenon TPCs for MeV-’s and electrons, and the case of NEXT
High pressure Xenon time projection chambers (TPCs) capable of simultaneously reconstructing the energy and trajectory of MeV-electrons to great accuracy have been extensively discussed recently, and the reader is referred to [9, 10] for details. As a gas, Xenon allows the initial ionization to span over a considerable distance even at high pressure ( cm/MeV at 10 bar) expanding the track details and facilitating its reconstruction. At the same time, lepton tracks can be fully contained up to energies of the order of 10 MeV for a 100 kg/10 bar detector, by virtue of the high stopping power of Xenon. The scale of a cylindrical 1 ton/10 bar detector with a height/diameter aspect ratio approaches the asymptotic mean free path for pair production m, ensuring a high detection efficiency for all energies and event containment up to 10’s of MeV.111 is the radiation length.
The excellent tracking prospects of gaseous Xenon come at a modest worsening of the energy resolution relative to that of state of the art Germanium detectors:
| (1) |
I.e., for a fixed energy deposit (), resolution is dictated by the Fano factor () and the average energy needed to create an electron-ion pair ( eV), [9]. In practical detectors this value can be approached through secondary light amplification (electroluminescence) [11], a process that benefits from pressurization [12]. For the simultaneous reconstruction of the MeV-electron track, the separate optimization of the tracking (eg. with SiPMs) and calorimetric function (PMTs) has been pursued and demonstrated by the NEXT collaboration [13, 14, 15].
NEXT detection technique, based on the accurate reconstruction of the 2-electron tracks emerging from the 136Xe decay with a total energy equaling MeV, aims at suppressing the bulk of -ray backgrounds from natural radioactivity with rejection factors of , as required for the exploration of the inverted hierarchy of neutrino masses. At such a sensitivity level, achieving background-free conditions (if possible at all) requires advances on the topological analysis beyond the double Bragg-peak (double ‘blob’) identification long championed by the Gotthard collaboration [8]. Arguably, the detailed tracking in an axial magnetic field may provide a new path [16]: in this case -backgrounds display 1 blob and 1 definite curvature (or chirality), while a signal will double these features. For a relativistic track propagating over a distance , the kick angle and the angular straggling projected into the bending plane can be approximated, respectively, by [17]:
| (2) | |||||
| (3) |
For practical magnetic-fields () and pressures () this sets the desirable tracking step at the mm-level, below which multiple-scattering overrules magnetic bending.222It is later shown that the spatial extent of an MeV-electron blob at 10 bar is 2 mm (-). The suitability of mm-tracking will be demonstrated elsewhere, with the support of detailed simulations. Extracting additional topological information in the quest therefore implies that any blurring introduced by the diffusion of the initial ionization or the instrumental response should be minimized accordingly. Since this is not viable in pure Xenon, with an electron diffusion at the scale of 1 cm for 1 m drift [11], the possibility of a new generation of Xe-TPCs with a 10-fold increased track sharpness is being explored. Achieving this goal, while preserving both the near-intrinsic calorimetric performance and the primary scintillation at the m-scale, presents a formidable challenge.
3 Trimethylamine and its ‘magic’ mixtures with Xenon
It has been noted that Xenon, when mixed with Trimethylamine (TMA: N(CH3)3) may, besides reducing the electron diffusion, form a mixture capable of simultaneously displaying Penning effect and scintillation [18]. This concept is dubbed, hereafter, ‘Penning-Fluorescent’. The idea that Xenon VUV-light may be efficiently re-absorbed in fluorescent and ionization degrees of freedom of the additive has appealing implications, allowing an improvement of the energy resolution through the reduction of the Fano factor and the increase of the ionization response , as well as wavelength-shifting the primary and secondary scintillation. The possibility of using TMA for fine-tuning recombination in the search for directional dark-matter signals [19] as well as for charge neutralization of Ba++ to Ba+ (central to some Ba-tagging schemes, [16, 20]) adds further value to this molecule, however these sophisticated scenarios (although qualitatively verified) remain speculative at the moment and are not discussed here.
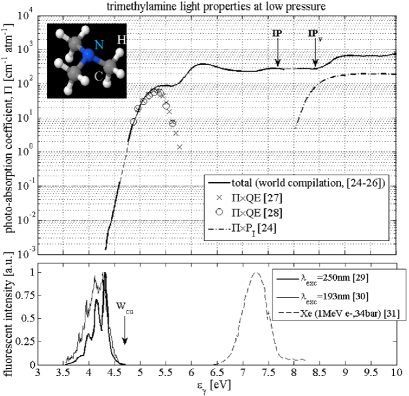
Trimethylamine is the smallest tertiary amine, and it is known to display a strong (and relatively fast) fluorescence from its lowest Rydberg 3s state ( ns), with quantum yields up to 100% depending on the excitation wavelength . As for the case of ammonia, a large Stokes shift arises due to the transition between a pyramidal and planar geometry during the photon absorption-emission process. Hence, self-transparency can be anticipated for 1% admixtures with noble gases up to 10’s of meters at 10 bar (Fig. 1). Contrary to ammonia, the photo-absorption coefficient of TMA does not present marked vibrational bands, a consequence of the smearing introduced by the methyl rotor groups. This fact provides, on the other hand, additional electron cooling and so electron diffusion coefficients as low as - have been reported in [21]. Such a diffusion would imply for a 10 bar detector a spread of the initial ionization at the scale of 1 mm- over a 1 m path, as confirmed by this work, representing the smallest electron diffusion of any existing TPC that is known to the authors.
The TMA fluorescence spectrum is centered at around 300 nm and conveniently ends at the work function of copper (Fig. 1-down) thus reducing feedback from the photo-effect at metal surfaces. TMA itself is strongly opaque to Xenon light, with a mean free path of 0.4 mm for a 1% TMA admixture at 10 bar.333Importantly, Xenon emission sits below the vertical ionization potential of TMA (Fig. 1), suppressing the track blurring that would be originated by photo-effect in the gas. With additional VUV-quenching provided during the Xe-excimer formation stage (e.g., through the scintillating, Penning and photo-dissociative pathways made available by TMA) stable charge amplification up to several ’s can be achieved for pressures not exceeding 5 bar [21, 22, 23]. The gain enhancement relative to that in pure Xenon has been often interpreted as a consequence of the close proximity of the TMA ionization potential to the energy of the excited states of Xe species, i.e., to the Penning effect.
In this work it is described, mainly throughout section 4, the technical behaviour of a Xe-TMA TPC based on a specific charge-amplifying structure (Micromegas). We later extend the experimental survey on electron swarm properties of Xe-TMA mixtures at 10 bar in section 5, illustrating their impact in the reconstruction of extended tracks in section 6. Section 7 is devoted to a discussion on the calorimetric response and the Penning-Fluorescent characteristics.
4 Experimental setup: NEXT-MM
4.1 System description and Micromegas readout plane
NEXT-MM is a 73 liter cylindrical vessel made of stainless steel, equipped with a field cage and mm mm pixelated Micromegas anode, assembled and read out in TPC fashion. It has been developed by the NEXT collaboration to assess the performance of this family of micro-patterned charge readouts on large areas (700 cm2) and high pressure, so as to accurately study MeV-electron tracks in low-diffusion mixtures for realistic conditions of event containment. The TPC constituent materials are chosen to be radiopure: copper, PEEK, Teflon™ and polyimide, the main exception being the (solder-less) multi-pin signal connectors based on LCP.444Liquid crystal polymer. ‘All-in-one’ sensor+cable designs combined with shielding is the most readily available solution to this persistent problem. The Micromegas were specially manufactured at CERN with the ‘microbulk’ technique [32] provided it grants a radioactivity content below 0.4 Bq/m2 for the 238U and 232Th natural chains [33]. Their progeny (214Bi and 208Tl) constitutes the main background in 136Xe experiments [13, 34]. Besides the presence of structural copper, the TPC anode consists of a modest mass of 3 g/m2 of polyimide, from which much lower activities can be expected upon optimization of the fabrication process.
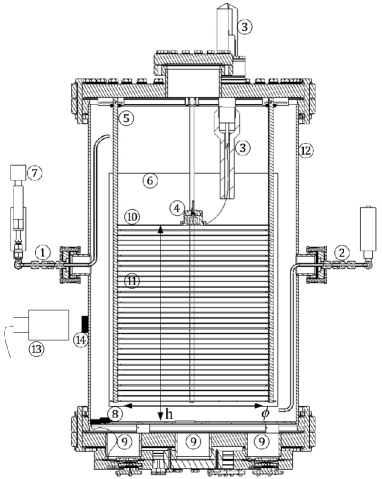
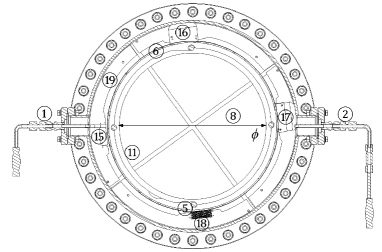
A cross-section of the vessel together with a close-up of the anode region are shown in Fig. 2. The TPC has been designed to house about 1 kg of Xenon in its active volume when operated at 10 bar: cm cm. A detailed description of the main TPC components, pressure, vacuum and recovery gas lines can be found in [22] and [35].
Technically, the TPC readout plane was made through a 4-fold sectorial arrangement with each sector enjoying the largest Micromegas manufacturable in the microbulk to date ( cm2). The construction procedure relies on the chemical etching of doubly copper-clad polyimide foils, being performed in the present case on a 100 m square pattern with 40 m diameter holes placed at the square’s vertexes. Within 50 m of the holes’ entrance, corresponding to the thickness of the polyimide layer through which the gas amplification takes place, the second copper plate (later acting as anode) is etched with a pattern of mmmm induction ‘pixels’. The number of amplification holes nears 7 million.
For optimization of the Micromegas operation under Xenon-TMA we relied on ground-breaking work performed on small readouts in [22]. The best energy resolution there obtained was for 22 keV X-rays (FWHM), with a maximum operating gain of 400 at 10 bar.
4.2 Data taking and analysis
Electron tracks used throughout this work were generated by means of -sources. The released primary ionization drifts towards the TPC anode where it avalanches inside the Micromegas holes, inducing signals on its pixelated anode that can be recorded with specific sampling-ADC electronics, presently based on the AFTER chip [36]. In the absence of light sensors inside the TPC that would be capable of recording the initial scintillation, the -information was provided by radiation emitted synchronously from the source, triggering the data acquisition system. For pressures around atmospheric the trigger signal was obtained with the help of a 241Am source, the -particles from its decays being conveniently tagged by a silicon diode in close proximity. Such a trigger system was encapsulated in a Teflon enclosure above the cathode and served as a source of quasi-simultaneous 237Np X-rays in the range - keV, emitted through an opening in the cathode itself (Fig. 2-\small4⃝). A 22Na source located at about mid-drift was used for the measurements at 10 bar (Fig. 2-\small14⃝, -ray energies: , MeV).
The experimental procedure started with a bake-out cycle of the vessel, gas injection and purification through recirculation, and electric field conditioning. Typically, this lasted about 2 weeks. Following that and prior to the start of long data takings, the operating gain and drift field were systematically scanned for optimal working conditions: V/cm/bar, (at 1 bar); V/cm/bar, (at 10 bar). Those were found to provide the best balance between Micromegas and field cage stability, highest signal-to-noise (S/N) ratio, convenient drift times, low recombination and negligible attachment. It had been found in earlier works that TMA admixtures around 1% are convenient both in terms of Micromegas gain response [22] and reduced diffusion [21] and so we concentrated on such a range. On the other hand, such concentrations would plausibly allow extracting the maximum light yield from the primary TMA scintillation as well as maximizing Penning (section 8).
The data analysis proceeds starting from the 511-point waveform recorded by each of the readout channels, with an event being a collection of waveforms. The analysis chain resembles, although supersedes, the one in [21]:
-
1.
Zero-suppression. A global threshold is chosen relative to the system equivalent noise charge (ENC) at about -ENC, set to minimize the presence of noisy channels and cross-talk: a) the non-firing pixels and b) the non-firing time bins of the fired pixels are removed from the analysis chain. The threshold is defined over a certain charge pedestal, that is determined pulse-by-pulse and subtracted.
-
2.
Basic pulse shape analysis. Basic parameters of each waveform being above threshold are obtained: - pixel coordinates, position along the drift region (), waveform integral (), width (), etc.
-
3.
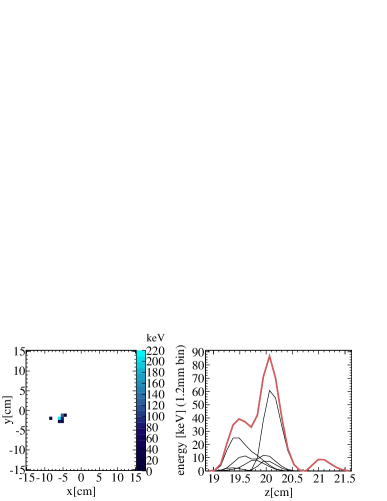
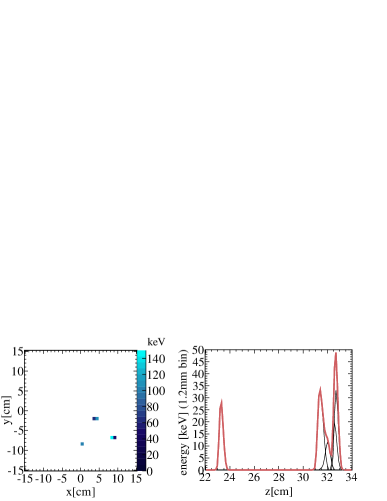
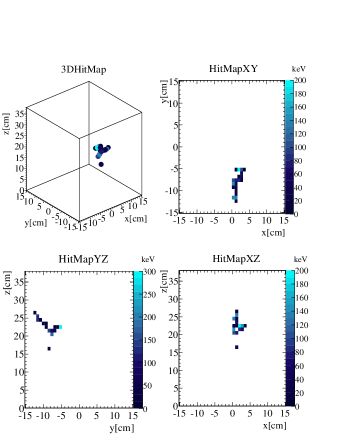
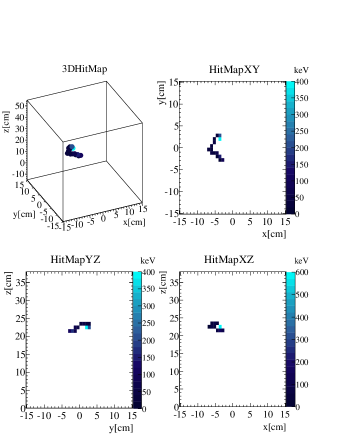
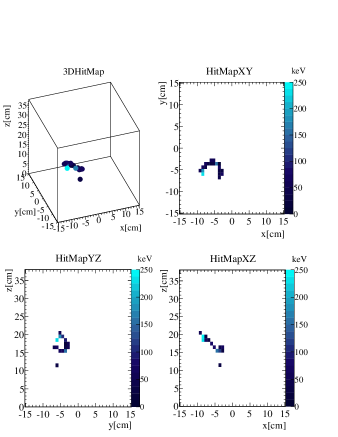
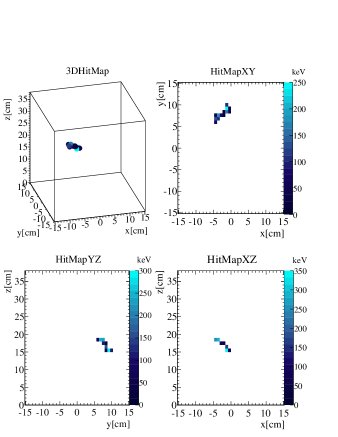
Cluster finder. Two dimensional ionization clusters (projected in the - plane) are identified and tagged with a recursive depth-first search (DFS) method. For operational purposes a cluster is considered to be connected if a path exists between any two pixels belonging to it; a path is a superposition of segments; a segment is a line joining two neighbours; each pixel has 8 neighbours. Examples of events consisting of 1, 2, and 3 clusters are given in Fig. 3.
-
4.
Identification of displaced X-rays. Displaced clusters with an energy in the range - keV are identified and undergo a Gaussian fit to refine their main parameters relative to the estimate in (2).
-
5.
Quality cut. Events with fluctuating base-lines, anomalous noise or saturation are discarded.
-
6.
Volume fiducialization. Events not fully contained within 1 cm of the boundaries of the active region - are removed.
-
7.
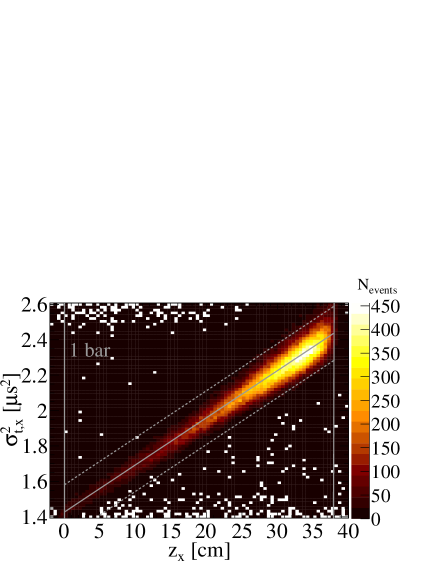
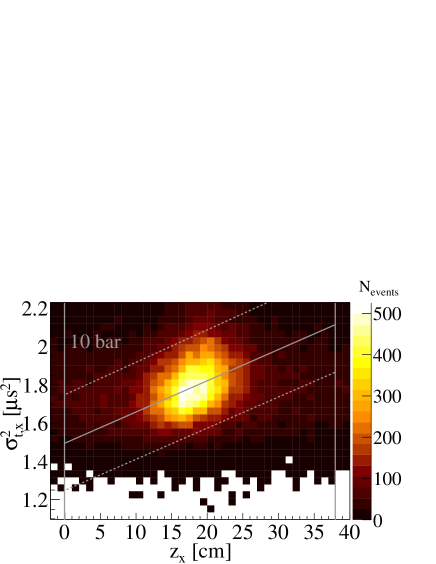
Suppression of random coincidences. Random coincidences are suppressed by resorting to the physical correlation between a waveform’s width and its position along the drift coordinate . This correlation, stemming from the longitudinal electron diffusion, is particularly strong for X-ray clusters due their nearly point-like nature (see Fig. 10 for a graphical explanation).
-
8.
Event selection and analysis. Physical criteria are imposed in order to select the events of interest.
In the following, a magnitude may be attributed to a generic event (), to a gamma-ray event (), to an electron track within an event () or to an X-ray within an event (): refers to energy-weighted positions projected into the readout plane, refers to the arrival time of the maximum of the associated sum-pulse, to its width, to its sum-energy.
4.3 Calibration
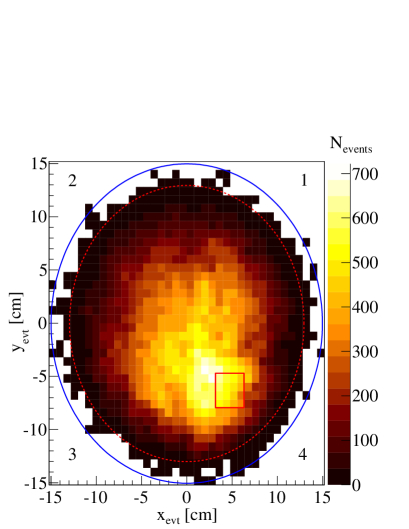
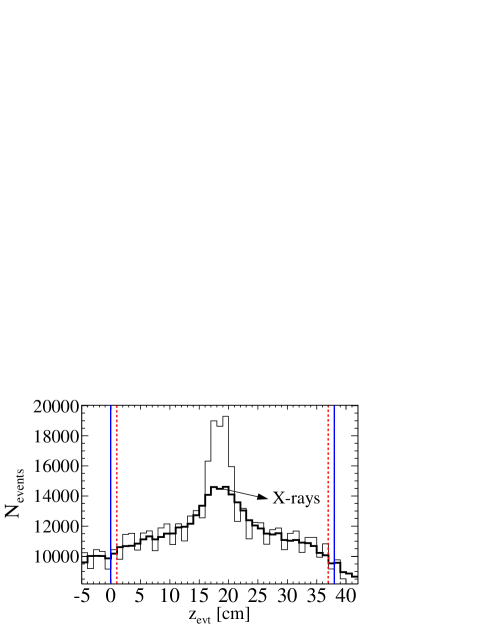
Data are first examined after step (5), Fig. 4. Reference positions are identified in the distribution of arrival times of the events’ ionization, providing an estimate of the position (Fig. 4-down). The slope of the vs correlation for X-ray clusters is stored for future cuts. Gain variations from sector to sector are corrected (10-20%) and the integral of the waveforms converted to energy.
After these preliminary calibrations, a pixel-by-pixel gain equalization is performed iteratively by aligning the pixel energy distributions obtained over the - plane. Such pixel distributions are formed by histogramming the energy of X-ray clusters for which the contribution of the given pixel is the highest. This calibration procedure, that involves a mild sector-wise correction of gain transients (5-10%), converges after 2-5 iterations when the energy resolution reaches an optimum.


The distribution of the per pixel ratios of the keV X-ray peak energy relative to the average value over the whole readout plane are shown in Fig. 5-up, each entry being weighted by the number of X-rays counted in that pixel. These distributions, obtained before and after the calibration procedure, inform about the robustness and quality of the algorithm, their final widths being below 1%(1 bar) and 2%(10 bar) FWHM, nowhere near influencing the system resolution obtained after calibration: (1 bar) and (10 bar), Fig. 5-down. No sizeable deterioration of the latter values could be appreciated upon reduction of the statistics available for calibration by a factor .
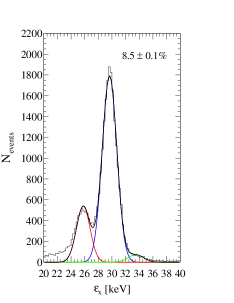
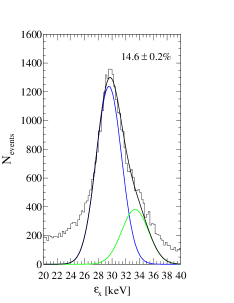
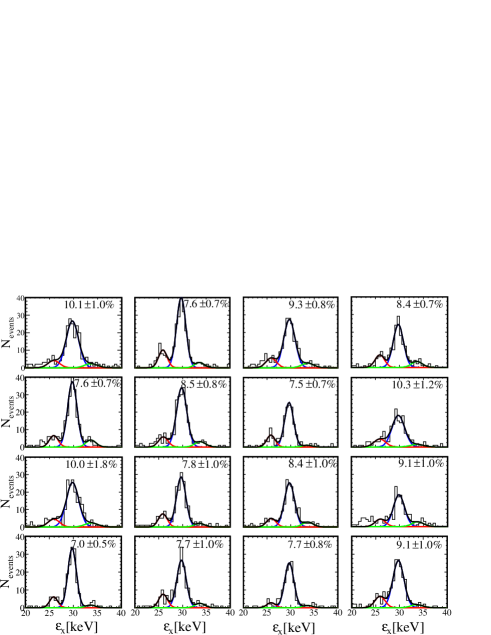
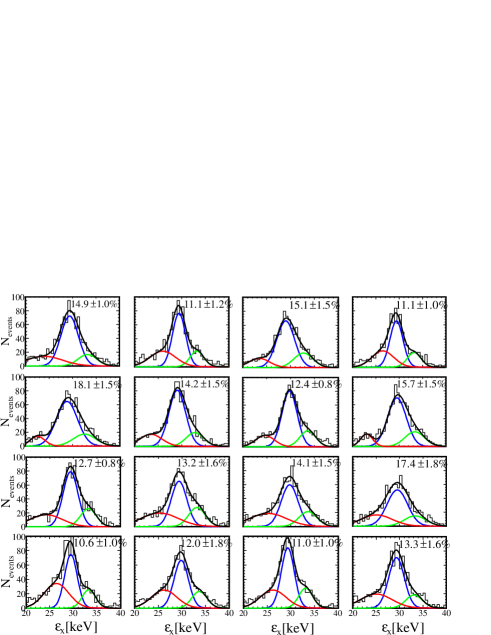
Fig. 6 shows the energy distributions and fitting functions used for calibration in a region (squared area in Fig. 4), after calibration converged. A description of the fit details has been captioned. Although a peak-alignment with the anticipated % precision can be appreciated, there is a significant variability in the width of the main peak, beyond the statistical uncertainty of the fit.
4.4 Long-term stability and technical performance
At 10 bar, about 11 million -events from a 15 kBq 22Na source were taken during April-July 2014, totalling 100 live-days. System operation at nominal working conditions proceeded continuously for 24 h a day and largely without manual intervention: no dedicated shifts were necessary except for sporadic monitoring of pressure and the current readings of the HV power supply for safety reasons. The bias of the readout plane was controlled with a N1471 CAEN power supply, that would halt operation sector-wise in the event of an over-current exceeding 200 nA for more than 10 s. Effective data takings took place for about 30% of the total live-time, with the interval between acquisition runs dedicated to analysis and diagnostics.
The level of pixel functionality was 90% throughout the measurements, the non-functionality approximately shared between permanently damaged pixels and connectivity issues (the latter discussed elsewhere [35]). Most of the damage arose during earlier measurements with -sources and low-energy X-rays in [21, 35] as a consequence of sustained over-current leading to violent sparking, the main causes identified being: i) readout mishandling, ii) -emitter contamination of the cathode after prolonged use of a Rn source ([35]), and iii) damage during normal operation with -sources at relatively high gains. In case of damage, a manual intervention rendered the pixel electrically floating, restoring the electrostatic equilibrium in the affected region. The fringe fields resulting from this indirect biasing of the pixel potential do not penetrate beyond 1% of the neighboring pixels, thus ensuring normal detector operation except for the modest geometrical loss associated to the intervention.
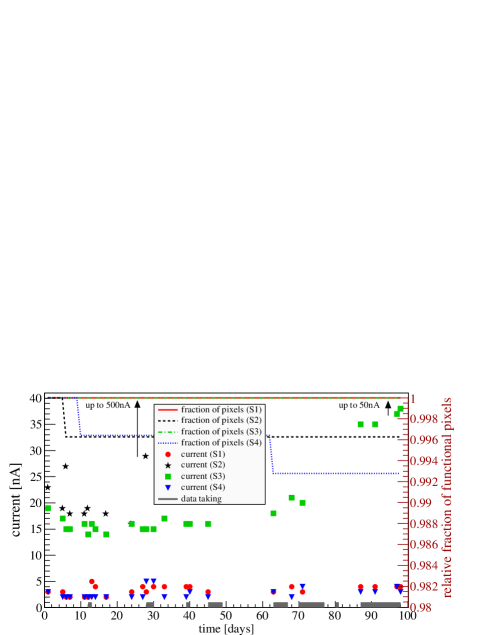
Although dark currents normally stayed within 0.015-0.03 nA/cm2, values as high as 0.3 and even 3 nA/cm2 were reached in two of the sectors (Fig. 7). This did not affect detector operation except for a somewhat lower gain in the most extreme case. The absence of a strong gain drop or hot spot suggests that these leaks may be related to loss of insulation downstream the amplification gap. Weak points may appear at connectors and cable traces that result indirectly biased when a pixel is left floating during the aforementioned process.
The presence of micro-discharges in non-insulated Micromegas operated close to breakdown is a well documented phenomenon (see for instance [37] and references therein), resulting in the present case in an average rate of current excursions about 10 /min/m2. Provided the pre-amplifier input is protected they have no influence in the detector stability. As shown below, they have also a negligible impact in the system exposure, since their natural scale is that of few amplification holes. In most cases this phenomenon affects only one pixel ( pF) during a short period of time. More intense current excursions are exponentially less frequent although potentially more harmful.
Four types of discharges can be found in this system, qualitatively enumerated below in order of increasing strength:
-
I
Low intensity: current excursions at the level of 20-60 nA.
-
II
Medium intensity: current excursions exceeding the HV current-limit of 200 nA, resulting in a HV trip.
-
III
High intensity: current excursions exceeding the HV current-limit of 200 nA during 10 s, resulting in a HV ramp down.
-
IV
Permanent damage: a high intensity discharge that permanently develops a high conductivity path.
Incidentally, stronger micro-discharges were found to have also a stronger impact on the fraction of system exposure that is affected, . This magnitude can be approximated by the micro-discharge rate, and the area () and time () affected after each occurrence, as detailed in Table 1:
| (4) |
After accounting for all instabilities in the readout plane, the overall reduction in exposure is at the level of , seemingly of little practical importance. Moreover, if an automatic method would be implemented for leaving a damaged pixel in open-circuit after IV-type discharges, operation without manual intervention becomes possible in m2 experiments for Micromegas operating close to breakdown.
| type | rate | Taff | Aaff | Aloss | Mt/Mt |
|---|---|---|---|---|---|
| I | 10/(min m2) | 2 s | pixel | - | |
| II | 2/(h m2) | 10 s | sector | - | |
| III | 5/(d m2) | 2 min | sector | - | |
| IV | 1%/y | 2 h | sector | pixel |
A priori more worrisome for long-term operation is the initial damage and the rate of new damage. As for the initial 5% damage, it is difficult to state which part is unavoidable during the commissioning and system conditioning. Certainly 1% levels would be approachable through a factor reduction in pixel size and improved system handling. Implementation of a tight quality control (QC) would bring additional gain. The chosen TPC orientation maximizes the accumulation of dust, that should be avoided in an experiment if no particular geometrical constraint exists. The remaining damage rate of 1%/year would benefit in a similar way from the above measures.
5 Response to keV X-rays and comparison with earlier results
5.1 Energy resolution and intrinsic performance
The energy resolution obtained for X-rays after calibration is compiled as a function of the drift field in Fig. 8 (circles). The horizontal bands show, as a reference, the energy resolution obtained in small setups and for similar gains [22]. We refer to this resolution, hereafter, as ‘intrinsic’ (to the charge-amplification readout). Since such an intrinsic response offers a promising extrapolation to the energy we discuss below the observed excess.
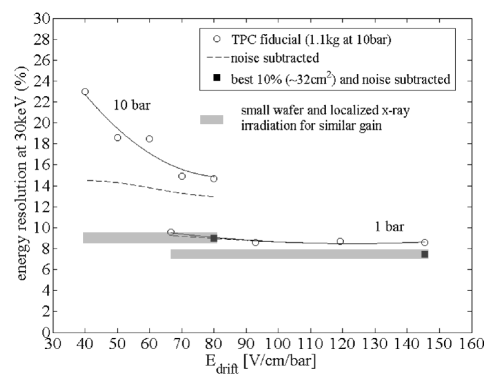
On the one hand the degradation with lower drift field cannot be attributed to attachment or recombination since charge losses from 80 to 40 V/cm/bar amount to some 10% (subsection 5.2), hence implying a negligible contribution to the resolution below 3% (to be summed in quadrature).555This follows the canonical formula for the case where recombination is decoupled from other processes: , for 30 keV X-rays in Xenon. Instead, the reason for the observed behaviour can be found on a relatively low S/N ratio and a reduced sampling frequency at low drift fields. The latter is determined by the limited number of sampling points provided by the electronics (511) in connection with the reduced drift velocity. In fact, given the response function of the AFTER chip for -excitation:
| (5) |
even for the longest shaping time available (s), the minimum sampling time achievable (if recording the complete drift region) barely satisfies the Shannon-Nyquist condition for the lowest drift fields. Additional contributions to this response such as the ion transit time along the Micromegas amplification gap or the extension of the electron track are expected to be small and indeed s described well the temporal width of X-rays found close to the anode.
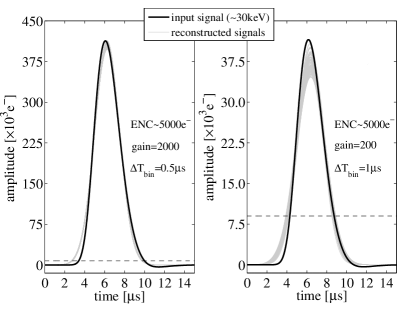
From the above perspective it can be expected that the deterioration of the energy resolution at low fields comes from the inability to accurately reconstruct the integral of , as illustrated by simulation in Fig. 9-up. For clarity, displays here the amplitude of a 30 keV charge deposit after including the longitudinal charge spread at about mid-drift (black line), as seen by the acquisition system. The resulting waveform is randomly sampled with the corresponding time bin and smeared with white noise, a Gaussian fit finally implemented exactly as done in the data analysis (grey lines). Simulations indicate that, if assuming ENCe- (50% in excess of the average ENC measured over the whole readout plane), most of the observed deterioration in the reconstructed pulse integral can be explained (dashed lines in Fig. 8).
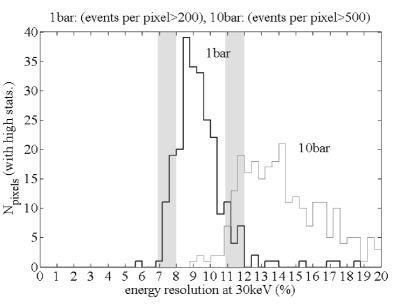
A second source of deterioration can be found in the aforementioned variation of the energy resolution from pixel to pixel, illustrated in Fig. 9-down by histogramming the energy resolution of those pixels with higher statistics. Even if accepting the presence of statistical and systematic effects in the fits of Fig. 6, some additional contribution seems to be needed to explain the spread of these distributions. In particular, the larger spread observed at high pressure can be qualitatively understood from the steeper behaviour of the gain vs amplification field () systematics in [22], with the quantity increasing with operating pressure. A recent microscopic simulation of the Micromegas readout shows that the energy resolution at high pressure is indeed much more vulnerable to the geometrical tolerances in the diameter of the amplification holes, by a factor [41]. If approximately selecting the best 10% pixels (outliers removed) values closer to intrinsic can be found (shadowed bands in Fig. 9). An approximate decomposition of the energy resolution for the highest drift fields studied is:
| (6) | |||
| (7) |
that includes the contributions intrinsic to the readout (int), signal to noise (S/N) and pixel-to-pixel (p-p). It must be noted that collimation at the level of few mm2 (much smaller than the pixel size in NEXT-MM) is often used in test setups and that there is an implicit selection bias in that under-performing wafers are discarded before characterization or suffer from early damage. Microbulk Micromegas even on modest sizes of 10’s of cm2 as those used in CAST already show energy resolutions mildly higher than intrinsic [38]. Put simply, any residual gain variation below the minimum resolvable unit of a pixel (or a strip, in that case) is hardly correctable during an experiment.
5.2 Parameters of the electron swarm
The precision in the topological reconstruction of the ionization trail left by a primary track in a TPC depends on the native system voxelization (pixel size, time bin) and the ‘swarm’ properties of the electrons released: drift velocity and pressure-normalized diffusion coefficients . The reconstructed energy may be limited, on the other hand, by losses due to electron-ion recombination or electron attachment (, ):
| (8) | |||||
| (9) | |||||
| (10) |
refers to the charge collected as a function of the electric field and drift distance, and represents the amount of charge released by the event in the absence of recombination. These electron swarm parameters can be extracted from the same X-ray sub-sample used for the calorimetric analysis of subsection 5.1, provided their point-like nature allows approaching the -type ionization conditions assumed in eqs. 8-10: i) the drift velocity is determined from the difference in arrival times of X-ray clusters produced at two well defined positions and ii) the longitudinal diffusion and attachment coefficients are obtained from the vs and vs cluster behaviour (eqs. 8, 10). It is in principle possible to extract the transverse diffusion coefficient through a separate analysis, however the spatial sensitivity at 10 bar was found not to be sufficient for this. Details on the extraction of , for 1-3 bar can be found in [22] and so here only the 10 bar analysis is described.
The drift velocity was determined from the TPC anode and 22Na source positions, the latter identified as a pronounced peak in the X-ray time distribution, corresponding to cm (Fig. 4). Arrival times from clusters in the TPC-anode region are synchronous with the NaI(Tl) trigger signal and could be identified with an estimated 2 cm uncertainty.
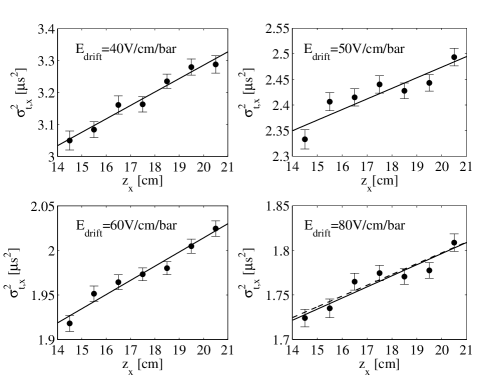
Concerning longitudinal diffusion, the vs correlation considerably widened at 10 bar as compared to 1 bar (Fig. 10). This is consistent with the 10-fold S/N reduction and the associated deterioration in the reconstruction of the pulse characteristics. In order to minimize the additional blurring introduced by random coincidences at 10 bar, the main electron track associated to the X-ray was requested to be in the range cm. Linear fits in a selected region in around the source position yielded the desired slopes (shown in Fig. 11). For illustration, the simulation of the pulse reconstruction procedure at various -positions was performed, and the final lineal fit is shown for the 80 V/cm/bar case (dashed line). The parameters used in the simulation are s, ENC=7500e-, s, ENC, gain, and the slope introduced was the measured one. It is important to note that the systematic upwards shift (resulting from the effective increase of the pulse width during reconstruction) is correctly captured in simulation, and it is qualitatively reproduced for lower fields where the effect is considerably larger. However, even in this highly non-ideal situation, the reconstructed slope stays within 5% of the value introduced, at most. The uncertainty in the determination of the longitudinal diffusion coefficient is obtained from this 5%, the 10% uncertainty in the drift velocity, the statistical error of the linear fit and the variations for different assumptions on the fitting range. When summed in quadrature, the resulting uncertainty lies in the range 10-15%.
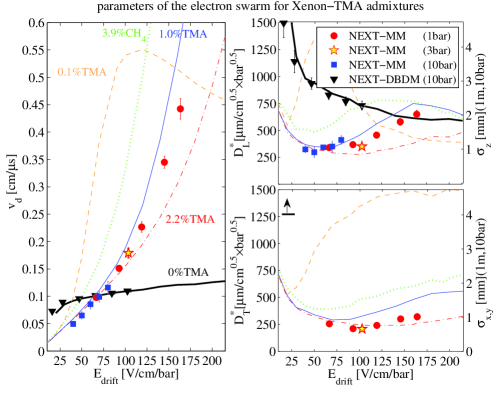
Fig. 12 shows a compilation of the main results in the field region that is of interest for the NEXT experiment together with a comparison with the microscopic code Magboltz 10.0.1 [39]. Additional measurements performed in small setups at various pressures can be found in [21] (drift velocity) and [19] (drift velocity and longitudinal diffusion coefficient), showing good mutual agreement. The combined results convey evidence of the strong electron cooling properties of TMA, showing a reduction in diffusion within factors of (L), (T) of the ones achievable in pure Xenon, and significantly outperforming the expectation for Xe-CH4 admixtures [8] by nearly a factor . Xe-TMA sets the diffusion scale in Xenon mixtures to 1 mm for 1 m drift at 10 bar, less than a part in 200 relative to the size of a event at the same pressure.
Interestingly, the cross-over shown by the drift velocity in Xe-TMA mixtures relative to pure Xenon is well reproduced, and so below 75 V/cm/bar the mixture becomes actually slower than pure Xenon. Since this type of systems often operate in a closed gas loop, a high sensitivity of the drift velocity to the reduced field may turn to be a relevant practical advantage, allowing the optimization of the voxelization along during operation.
The dependence of the X-ray energy peak with the drift distance is shown in Fig. 13-up for V/cm/bar. Further to the cut, random coincidences have been suppressed through a - correlation cut (dashed lines in Fig. 10). The resulting vs distribution is binned and fitted iteratively to a Gaussian function, yielding for the highest field an attachment coefficient /m after an exponential fit (corresponding to an electron lifetime of 12 ms).
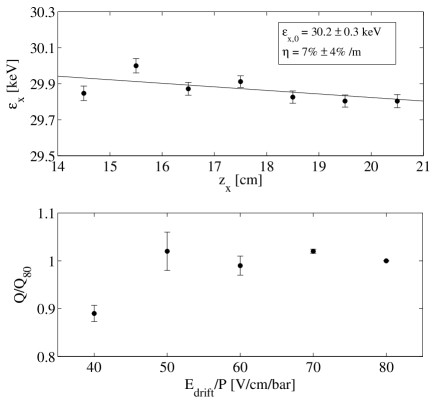
At last, the relative fraction of primary ionization that is recombined can be obtained by studying the variations of the X-ray energy peak position (back-converted to charge), obtained at about mid-drift and corrected for attachment. Due to the anticipated smallness of the effect the analysis has several caveats, in particular in view of the variation of the sampling time and diffusion with field. Simulation indicates that any systematic shift of the reconstructed pulse integral is below 1% even for the lowest fields, and diffusion is relatively stable (Fig. 12), so we may neglect any effect related to the pulse shape reconstruction. The remaining systematic effects are connected to the presence of (not understood) gain transients at the level of 5% and to the stronger -dependence of the reconstructed energy at low fields, implying up to a 10% correction. Under these assumptions a coarse estimate of the maximum recombination observed in present X-ray data is , the statistical uncertainty coming from sector-to-sector variations (Fig. 13-down). Within such a large uncertainty, this value is compatible with the charge loss reported in [41], that sets a scale for recombination at the level in TMA admixtures at 10 bar.
6 Extended electron tracks from -rays
A typical -ray coincidence spectrum obtained for single-tracks after calibration is shown in Fig. 14. The TPC working conditions are: Xenon/trimethylamine filling gas at 99/1 volume admixture, bar ( deg), V/cm/bar, kV/cm/bar. These settings correspond to a gain for the Micromegas readout of about , with the main TPC charge-drift properties being mm/s, m) mm, m) mm (from Fig. 12), /m (Fig. 13). Indirect estimates for initial charge recombination, Penning transfer probability and primary scintillation yield are (section 5.2), and ph./MeV (given later in section 7.2), respectively. The remaining parameters impacting the accuracy of the reconstructed track are the threshold energy keV (ENC=5000e-), the response function (dominated by the AFTER chip) of 1.2 s- (1.4 mm) and a time sampling of 1 s (1.2 mm), that ultimately results in a native 3D-voxelization of 8 mm mm mm.
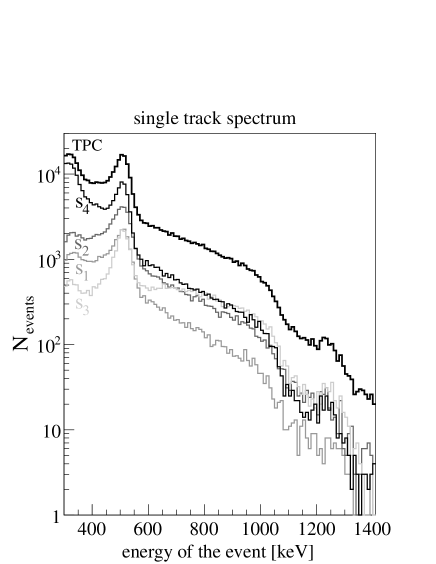
The most prominent features in the spectrum correspond to the photo-peaks from the annihilation of the e+ emitted in the 22Na decay, at 0.511 MeV, and the -emission after the daughter’s decay at 1.275 MeV. The energy resolution is not sufficient to separate the escape peak associated to the 0.511 MeV interactions, appearing as a shoulder to the left of the main peak. For sector (where the gain was lower) and sector (that showed larger gain transients) the tails to the left are more pronounced and the resolution worsened. The suppression of the 0.511 MeV region in sector relative to the high energy Compton contribution is due to the trigger geometry (the solid angle for 0.511 MeV is determined by the coincidence with the NaI(Tl) detector, covering mostly sectors 1, 2 and 4).
6.1 Calorimetry
We focused on events that satisfy the analysis criteria 5-6 (subsection 4.2), and concentrate in particular on electron tracks displaying characteristic X-ray emission. This additional criterion allows suppressing the escape peaks and multi-Compton events as well as random coincidences. The latter can be achieved through the vs correlation cut on the X-ray cluster.666It can be noted that, coincidentally, the selected sub-sample is the one used for extracting the electron swarm parameters, where emphasis was put on the X-ray behavior.
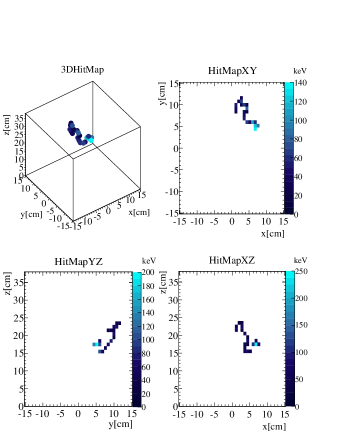
An example of a typical 0.511 MeV event is shown in Fig. 3 (middle panel). Electrons with this energy deposit about 1/2 of their energy in the track’s last stage as a result of the Bethe-Bloch increase (Bragg peak) and the increased multiple scattering, a region generically referred to as ‘blob’. The approximately equal energy sharing between the blob and the (nearly) ‘mip’ region results in relatively small tracks of 3-4 cm length. As later shown, electrons from the 1.275 MeV region can reach, on the other hand, considerably longer extensions of up to 10-15 cm (Fig. 20).

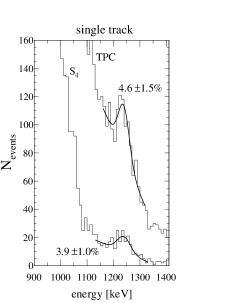
The spectrum obtained in the 0.511 MeV region for the full TPC after fiducialization (1.1 kg) is consistent with an energy resolution of (Fig. 15-left), while the sector with the highest statistics and S/N (S4) performs at %. The energy resolution obtained in the 1.275 MeV region can be estimated from the high statistics single-track sample as 4.6%(TPC) and 3.9%(S4), Fig. 15-right. Therefore we come to energy resolutions for MeV-electron tracks of - (0.511 MeV) and - (1.275 MeV), compatible with -scaling. These numbers are within a factor of the obtained for X-rays in section 5.1, that deviates from the intrinsic energy resolution of the Micromegas readout at 10 bar: . A plausible explanation for the deterioration of the calorimetric response to X-rays has been attributed to the low S/N and non-uniformity of the readout. However, the energy resolution obtained for MeV-electron tracks suffers from yet another , for which it seems that a different source is needed.
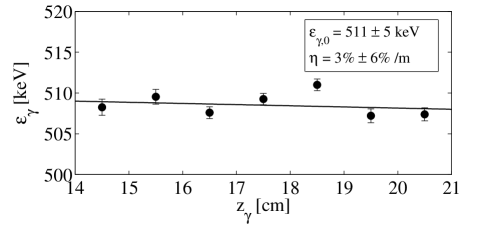
It must be noted that the positions of the 0.511 MeV and 30 keV energy peaks are well reproduced after X-ray calibration within 2% (Figs. 13, 16), showing little evidence for attachment or strong additional recombination besides that observed for X-rays. A marginal correlation of the reconstructed energy with the track orientation and the number of pixels fired was observed, that may be an indication of an imperfect calibration, however it was just too small to be easily correctable, and clearly does not account for the observed deterioration. Very modest, , improvements could be achieved by selecting specific regions along or across the chamber. The main explanation in hand comes from a relatively large system cross-talk originated during signal transmission (-), that is characterized in the present case by perfectly unipolar signals, and that appears synchronized with the event’s largest pulses.777The best explanation for this anomalous cross-talk is the presence of resistive paths or dielectric shunting conductances between some of the traces (either at the cables or at the footprints), something that had been qualitatively identified earlier. The complexity associated to the unambiguous identification of a cross-talk event, due to the presence of net charge, discouraged us from the production and study of detailed cross-talk maps. A soft anti-coincidence condition in a s (mm) window around the time of the event allows to suppress them when they appear isolated, however it is virtually impossible to avoid their contribution if they are produced onto the pixels already having a signal above or just near threshold. A ball-park estimate treating cross-talk as correlated noise with a flat probability in the range 0-1/20 would yield 3.5% additional peak broadening, while an average of 1.7 pixels showing cross-talk would plausibly explain the observed discrepancy between X-rays and extended electron tracks.
6.2 Track topology
Besides the calorimetric function, an essential feature for applications is the accurate reconstruction of the electron track end-point (blob). This is illustrated in Fig. 20 through several hand-picked single-track events in the energy region around 1.275 MeV. In this (biased-by-selection) sub-sample, that roughly describes the behaviour of about 1/3 of the events in this energy region, the end-blob is visible to the naked eye. The remaining 2/3 consist of cosmic rays, highly bent tracks and multi-Compton events. The selected energy approaches the most probable electron energy in the neutrino-less decay mode (), hence effectively indicating how ‘half’ of the expected signal from the long sought decay looks like.
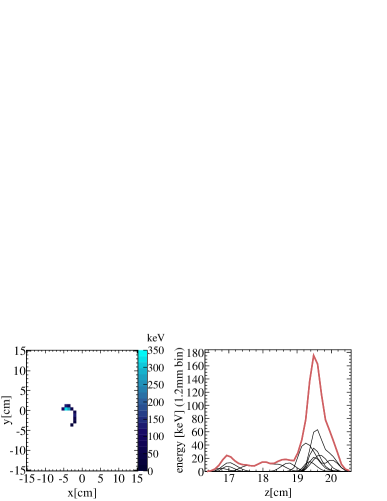
The main practical limitation for recognizing a double-blob event is the inability to adequately ‘un-fold’ the tortuous electron tracks into a straight line where the blob(s) cannot be mistaken. If no attempt is made to quantify the final figure of background/signal suppression, the problem can be analyzed through a sub-sample of tracks selected to be straight along a particular spatial direction. As will be immediately shown, 0.511 MeV tracks are long enough to allow a separation of the mip and blob region, and so their analysis universally describes the final part of any electron of arbitrary energy in the present experimental conditions. Provided the system’s native voxelization is 8mm8mm1.2mm we focus on the coordinate due to its higher resolution: Fig. 17 shows the superposition of all event pulses, aligned with respect to the position of its maximum and divided by the number of events, for different track lengths along the -coordinate.
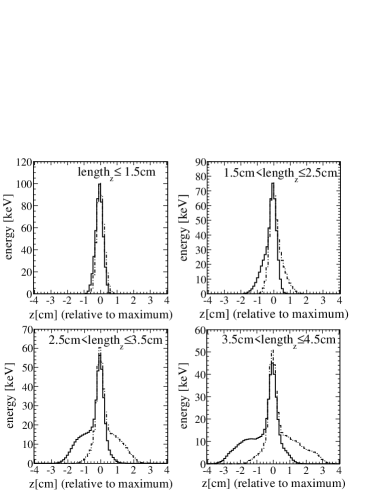
As expected, the Bragg peak can be distinctly identified in extended tracks, with a blob to mip energy ratio of 5. The blob width is 2.5 mm-, being only partly explained by the electronics response function (1.4 mm), and with negligible contributions from binning (0.3 mm) and diffusion (0.55 mm). This sets the physical scale of the electron blob at about 2 mm- (for 10 bar Xenon) implying that in present conditions not just the blob but its details start to be resolvable.
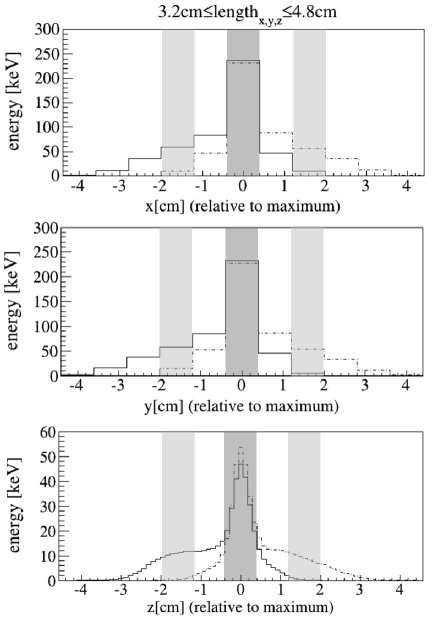
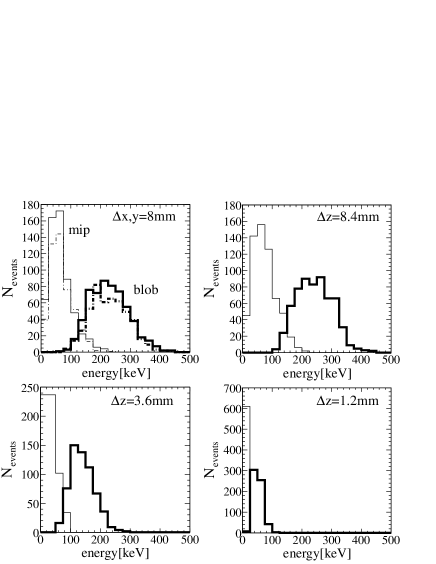
The influence of the pixelization in track reconstruction can be easily appraised by performing the same analysis for the longest tracks in all 3 directions of space (Fig. 18). Clearly, the wider pixelization (8 mm) results in a loss of information, but how important is it?: Fig. 18 describes the average behaviour and extension of the final energy blob in MeV-electron tracks but does not give an idea about the energy loss fluctuations. By approximately selecting 8mm-regions both around the ‘blob’ and ‘mip’ regions (bands in Fig. 18) identification can be attempted track-by-track, resulting in the distributions shown in Fig. 19-up for and (up-left) and (up-right). The probability to mistakenly interpret a 8 mm mip region as a blob is below 1/20 at a signal efficiency of 96%, if a sharp cut at 150 keV is used. The situation improves for smaller intervals until the mip and blob distributions completely decouple if the native pixelization (1.2 mm) is chosen. This again suggests that the blob region is being resolved in present experimental conditions and that mm-scale tracking capabilities are an important asset.

7 Discussion
7.1 System aspects
From the calorimetric point of view the performance of NEXT-MM 1kg/10bar Xenon TPC compares favourably with earlier results for similar systems (Table 2) with exception of the NEXT baseline technology, based on electroluminescence. The energy resolution for a charge-readout system may be decomposed according to the contributions that have been identified in this work as:
| (11) | |||||
| (12) |
From left to right the terms in eq. 11 correspond to the intrinsic contribution from the Micromegas readout (including effects in drift and amplification regions), gain spread in the amplification holes (experimentally manifested as pixel-to-pixel variations of the resolution after gain equalization), limited S/N and sampling frequency, cross-talk, and calibration effects. Eq. 12 shows the canonical formula for the intrinsic energy resolution under the assumption of decoupled fluctuations, with corresponding to the variance to gain-squared ratio of the multiplication process. Once is obtained from microscopic simulation, this formula describes small Micromegas X-ray data to good accuracy [41]. Additional physical limitations to eq. 12 for MeV-electron tracks can be reasonably discarded: i) Recombination for 0.511 MeV tracks is from present data compatible with that observed for X-rays while a small effect is present at 1.275 MeV ; ii) physical characteristics of the track like bremsstrahlung [9] are determined by the amount of Xenon and therefore any contribution to the energy resolution is largely constrained by the most accurate measurements in table 2; iii) effects related to the track orientation and charge density in the amplification holes were too small to be isolated in this analysis.
From the previous arguments it may be assumed that the measured energy resolution is dominated by instrumental limitations and not by the different physical behaviour of X-ray and -tracks. Several sources of improvement can be identified: i) according to [36] noise minimization down to ENCe- is feasible with a reduced cable capacitance down to 50 pF (Cpix+C pF in this system [35]) while increased sampling frequency () and cross-talk optimization in cables and connections should suppress the most important contributions to eq. 11: and . The implementation of well targeted QC procedures in connection with hole-pattern optimization, geometrical gain compensation [42] or increased fabrication accuracy could bring further improvements in the magnitude and uniformity of the operating gain. This will help at further reducing the terms and , but it remains to be demonstrated.
| (1 MeV) | energy | gas | ||
| Gotthard[8] | 10.6% | 511 keV | 5 bar | Xe/CH4 |
| EXO200[43] | 8.5% | 1000 keV(int.) | liquid | Xe |
| NEXT[15] | 1.15%(0.97%) | 511(30) keV | 10 bar | Xe |
| this work | 4.5-5.5%(2.5%) | 511(30) keV | 10 bar | Xe/TMA |
| this work | 4.4%-5.2% | 1275 keV | 10 bar | Xe/TMA |
| small MM[22] | 1.4% | 22 keV | 10 bar | Xe/TMA |
| small MM[52] | 4.8% | 22 keV | 10 bar | Xe |
| Fano limit [9] | 0.45% | - | gas | Xe |
Besides the good energy resolution observed for 0.511 MeV electrons these type of readouts have remarkable strengths, like the easiness and scalability of the readout segmentation, simplicity and high fidelity to primary ionization. The chosen voxelization of 8 mm mm mm provides a clean separation between blob and mip regions, largely unaffected by diffusion even at the 1m-scale. The detector can work stable for 100 live-days without signs of deterioration except for a mild damage rate extrapolable to about 1%/year or less due to conditioning effects.
7.2 Penning-Fluorescent behaviour
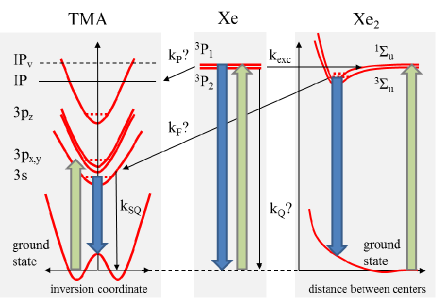
Indirect evidence for Penning-transfer reactions in Xe-TMA mixtures has been obtained in wire-chambers [23], GEMs [44], and Micromegas [22]. Their scintillating properties on the other hand have been reported recently [40]. If considering only energy transfers between the lowest lying states, the behaviour of a (VUV-quenched) Penning-Fluorescent mixture can be illustrated through the simplified Xe-TMA diagram in Fig. 21. The relevant reaction rates are (Xe∗ quenching by TMA), (Penning transfer rate), (fluorescent transfer rate) and (TMA self-quenching rate), of which the first three are unknown. In this discussion we interpret these rate constants as effective parameters, keeping in mind that more complex behaviours may ensue, e.g., with fluorescence sequentially following Penning.
First, it must be noted that a lower bound to the primary scintillation expected from a Xenon-TMA mixture can be derived from studies at low pressure, by considering only direct TMA excitation/scintillation and self-quenching. Hence, we conservatively omit the presence of Xe∗, XeTMA∗(3s) transfers (), and the quenching of TMA excited states by Xenon species, following [29]. Such a bound results in:
| (13) |
as a function of concentration () and pressure (). By considering for TMA a typical value eV (), the measured lifetime of the 3s state ( ns) and the TMA self-quenching rate ( ns-1 bar-1), evaluation of eq. 13 leads to S1 yields up to 100’s of ph/MeV, depending on pressure [45]. Additional scintillation hangs on the ability of TMA to quickly dissipate, collisionally, a fairly large amount of internal excess energy ( eV) following the Xe∗, XeTMA∗ transfers; relaxation to the 3s state may in this way happen while avoiding the dissociative pathways [29]. Although with limited efficiency, this transfer process is strongly hinted by the measurements in [40].
To the extent that energy transfers occur with the Xe∗ states, Penning reactions are energetically viable:888Other channels are generally present [48], but they do not change the general argument followed here.
| (14) |
The increased charge collection associated to the presence of Penning transfers can be a beneficial agent, reducing the Fano factor [49] and increasing the ionization response of the admixture; in the case of charge multiplication the avalanche fluctuations are reduced at any given gain [50]. By comparing Magboltz simulations with data obtained from charge amplification in Micromegas, an approximate functional behaviour of the Penning probability has been derived in [41], as:
| (15) |
where represents an effective life-time of the state from which Penning takes place. Maximum Penning transfer rates in the range 10-30% are hence obtained, decreasing with pressure.
7.3 Outlook
It has been shown that the use of trimethylamine as VUV-quencher in Xenon results in a 20-fold reduction of the transverse diffusion relative to pure Xenon. Besides allowing the stable operation of microbulk Micromegas at 10 bar, Xe-TMA exhibits substantial primary scintillation above nm, at the level of ’s ph/MeV [40]. The energy resolution obtained for 0.511 MeV ’s is at least better than the one obtained earlier with wire chambers, with Xe-TMA reducing electron diffusion in factors of in all 3 space dimensions relative to, e.g., Xe-CH4.
From the above considerations it may seem that, if present radiopurity levels of microbulk Micromegas (0.4 Bq/m2) can be reduced to the levels expected from the raw materials alone, re-sizing the present concept ‘as is’ could greatly improve on earlier limits obtained for -decay in high pressure Xenon in [8]. In this scenario, the optimum pressure is undoubtedly an essential variable to be considered. Gains of 2000 were shown for small sensors at 5 bar in [22] as compared to 400 at 10 bar. A maximum gain of 200 could be achieved for the present cm2-readout system, limiting the energy resolution.
Despite the positive comparison with earlier attempts in charge-mode readouts, it remains unclear to this collaboration how such a technological approach could outperform an electro-luminescence option, specially if more conventional low-diffusion mixtures at tolerable VUV-quenching rates do exist, as it seems [53]. On the other hand, although much more challenging, the studies performed on Xe-TMA show that the existence of a magic ‘Penning-Fluorescent’ mixture with high Penning and (wavelength-shifted) fluorescence yields cannot be discarded out of hand. Work in this direction will continue.
8 Conclusions
A Time Projection Chamber (NEXT-MM) housing 1.1 kg of Xenon in its fiducial volume and instrumented with a microbulk Micromegas readout plane (manufactured ‘a la’ GEM) has been operated for 100 live-days in a 10 bar Xenon/trimethylamine ‘Penning-Fluorescent’ gas mixture (99/1). The TPC ran continuously and without the need of dedicated shifts, showing a Micromegas damage rate at the halting of operation extrapolable to 1%/year. A seemingly reducible 5% damage was observed during system commissioning. The loss of exposure due to the instabilities introduced by the observed rate of (non-damaging) micro-discharges in the readout was quantified to be less than 0.05%.
We have detailed the calibration procedures and fully characterized the TPC response with Xenon X-rays. The energy resolution (FWHM) ultimately achieved on the full fiducial volume was 14.6% at 30 keV, with contributions from the limited S/N, sampling frequency and non-uniformity of the readout plane explaining the deterioration with respect to results obtained earlier in small setups (9%). At the of 136Xe, and assuming scaling, the calorimetric response to 0.511 MeV and 1.275 MeV electron tracks anticipates FWHM energy resolutions from 3.2%(for the best sector) to 3.9%(full TPC). We have proposed concrete ways to further mitigate the damage rates and to improve the readout. They could bring the energy resolution to the level obtained for X-rays ( at ), or even to the intrinsic value obtained for small sensors ( at ).
A simplified topological analysis carried out with the system’s native voxelization of 8mm8mm1.2mm () indicates a strong enhancement of the mip-to-blob identification capabilities in the -direction to the extent of completely decoupling the mip and blob energy distributions for a sub-sample of 600 selected tracks. Due to the very low electron diffusion measured for the mixture (at the scale of 1 mm for 1 m drift), and the easiness at increasing the readout granularity, the technology introduced thus offers the possibility of mm-accurate true-3D reconstruction of MeV-electron tracks on large detection volumes and at high pressure. In particular, it was shown that the electron end-point or ‘blob’ (2mm- at 10 bar) could be well resolved with little ambiguity.
Taking the performance of the NEXT-MM TPC at face value, the scaling of the present system ‘as is’ could supersede earlier attempts to find the decay with wire-chambers. In order to be competitive with a technology based on electroluminescence, a solution to the ‘-problem’, as well as an enhanced calorimetric response, seem to be needed. Also, by virtue of their low material budget and radiopure materials, Microbulk micromegas hold a promise for ultra-high radiopurity, therefore efforts to improve the present bounds of around 0.4 Bq/m2 for the 238U and 232Th chains should continue.
References
- [1] C.D.R. Azevedo et al., Nucl. Instr. Meth. A, 732(2013)551.
- [2] Y. Matsuoka et al., JINST 10(2015)C01053PET.
- [3] D. Bernard, Nucl. Instr. Meth. A, 729(2013)765.
- [4] J. K. Black, J. Phys. Conf. Ser, 65(2007)012005.
- [5] Álvarez V. et al. (NEXT Collaboration), JINST, 7(2012)T06001
- [6] S. Akkoyun, Nucl. Instr. Meth. A, 668(2012)26.
- [7] G. D. Alkhazov et al., Nucl. Instr. Meth. 48,1(1967)1.
- [8] R. Luescher et al., Phys. Lett. B, 434(1998)407.
- [9] D. Nygren, Nucl. Instr. Meth. A 603(2009)337.
- [10] F. Grañena et al, NEXT letter of intent to Laboratorio Subterraneo de Canfranc, arXiv:0907.4054.
- [11] Álvarez V. et al. (NEXT Collaboration), Nucl. Inst. and Meth. A, 114(2013)101.
- [12] A. J. P. L. Policarpo, Physica Scripta, 23(1981)539.
- [13] Álvarez V. et al. (NEXT Collaboration), JINST 7(2012)T06001.
- [14] Álvarez V. et al. (NEXT Collaboration), JINST, 8(2013)P04002.
- [15] D. Lorca et al., (NEXT Collaboration), JINST, 9(2014)P10007.
- [16] J. J. Gomez-Cadenas, The NEXT experiment arXiv:1411.2433, submitted to Nucl. Phys. B(Proc. Suppl.).
- [17] K.A. Olive et al. (Particle Data Group), Chin. Phys. C, 38, 090001 (2014).
- [18] D. Nygren, J. Phys. Conf. Ser., 309(2011)012006.
- [19] D. C. Herrera, PoS(TIPP2014)057.
- [20] D. Sinclair et al., J. Phys. Conf. Ser. 309(2011)012005.
- [21] V. Alvarez et al. (NEXT Collaboration), JINST 9(2014)C04015.
- [22] S. Cebrian et al., JINST 8 (2013) P01012.
- [23] B. D. Ramsey, P. C. Agrawal, Nucl. Instr. Meth., A 278(1989)576.
- [24] D. Grosjean, P. Bletzinger, IEEE J. Quantum Elect. QE-13, 11(1977)898.
- [25] Eileen Tannembaum, Esther M. Coffin, Anna J. Harrison, J. Chem. Phys. 21(1953)311.
- [26] Arthur M. Halpern, Mary Jo Ondrechen, Lawrence D. Ziegler, J. Am. Chem. Soc. 108(1986)3907.
- [27] Yutaka Matsumi, Kinichi Obi, Chem. Phys. 49(1980)87.
- [28] Clifford G. Cureton et al., Chem. Phys. 63(1981)31.
- [29] Kinichi Obi and Yutaka Matsumi, Chem. Phys. 49(1980)95.
- [30] Job D. Cardoza et al., J. Phys. Chem. A, 112(2008)10736.
- [31] H. A. Koehler et al. Phys. Rev. A, 9,2(1974)768.
- [32] S. Andriamonje et al., JINST 5(2010)P02001.
- [33] T. Dafni et al., Astropart. Phys. 34(2011)354.
- [34] J. Martín-Albo et al. (NEXT Collaboration), Sensitivity of NEXT-100 to neutrinoless double beta decay , to be submitted to JHEP.
- [35] V. Alvarez et al. (NEXT Collaboration), JINST 9(2014)P01301.
- [36] Baron P. et al., IEEE Trans. Nucl. Sci., 55(2008)1744.
- [37] Diego Gonzalez-Diaz, Archana Scharma, JINST 8(2013)T02001.
- [38] S. Aune et al., JINST 8 (2013) C12042.
- [39] S. F. Biagi., http://magboltz.web.cern.ch/magboltz/.
- [40] Y. Nakajima, Measurement of scintillation and ionization yield with high-pressure gaseous mixtures of Xe and TMA for improved 0nu double beta decay and dark matter searches, arXiv:1505.03585 [physics.ins-det].
- [41] E. Ruiz-Choliz, D.Gonzalez-Diaz, A. Diago et al., Modelling the behaviour of microbulk Micromegas in Xenon-trimethylamine gas mixtures, arXiv:1506.05077[physics.ins-det], submitted to Nucl. Instr. Meth. A.
- [42] Y. Giomataris, Nucl. Instr. Meth. , 419(1998)239.
- [43] M. Auger et al., Phys. Rev. Lett. 109(2012)032505.
- [44] F. A. F. Fraga et al., Nucl. Instr. Meth. A, 513(2003)379.
- [45] Diego Gonzalez-Diaz et al., Lessons from the ‘Penning-Fluorescent’ TPC and prospects, arXiv:1504.03640 [physics.ins-det].
- [46] J. B. Nee et al., Chem. Phys. Lett., 318(2008)402.
- [47] Di Zhu, Xion Zhang, Hiroshi Kajiyama, J. Appl. Phys. 112(2012)033304.
- [48] O. Sahin et al., JINST 5(2010)P05002.
- [49] G. F. Knoll, Radiation detection and measurement, John Wiley&Sons, 2010.
- [50] H. Schindler, S. F. Biagi, R. Veenhof, Nucl. Instr. Meth., A 624(2010)78.
- [51] D. R. Nygren, J. Phys. Conf. Ser. 460(2013)012006.
- [52] C. Balan et al. JINST 6(2011)P02006.
- [53] D. Gonzalez-Diaz (NEXT collaboration), NEXT-generation HP Xe-TPCs for the NEXT- experiment, presented at the 7th symposium for low-energy rare event detection.