Onset and cessation of motion in hydrodynamically sheared granular beds
Abstract
We performed molecular dynamics simulations of granular beds driven by a model hydrodynamic shear flow to elucidate general grain-scale mechanisms that determine the onset and cessation of sediment transport. By varying the Shields number (the nondimensional shear stress at the top of the bed) and particle Reynolds number (the ratio of particle inertia to viscous damping), we explore how variations of the fluid flow rate, particle inertia, and fluid viscosity affect the onset and cessation of bed motion. For low to moderate particle Reynolds numbers, a critical boundary separates mobile and static states. Transition times between these states diverge as this boundary is approached both from above and below. At high particle Reynolds number, inertial effects become dominant, and particle motion can be sustained well below flow rates at which mobilization of a static bed occurs. We also find that the onset of bed motion (for both low and high particle Reynolds numbers) is described by Weibullian weakest-link statistics, and thus is crucially dependent on the packing structure of the granular bed, even deep beneath the surface.
pacs:
92.40.Gc, 92.10.Wa, 45.70.Ht, 47.57.GcI Introduction
Fluid flowing laterally over a granular bed exerts shear stress on the grains. This occurs in many natural settings and industrial applications, such as sediment transport in riverbeds Einstein (1950); Charru et al. (2013) and slurries pipes Doron et al. (1987); Capecelatro and Desjardins (2013). The ratio of the shear stress exerted by the fluid on the top of the bed to the buoyancy-corrected particle weight is known as the Shields number Shields (1936). For small , no grain motion occurs; at sufficiently large , however, grains can be entrained by the flow Wiberg and Smith (1987); Buffington and Montgomery (1997); Charru et al. (2004); Ouriemi et al. (2007); Beheshti and Ataie-Ashtiani (2008); Dey and Papanicolaou (2008); Lajeunesse et al. (2010); Derksen (2011); Hong et al. (2015); Houssais et al. (2015). Despite decades of research, the nature of the transition between static and mobilized granular beds is not well understood. The geometric structure of the contact network in the bed determines its mechanical strength Silbert et al. (2002); Peyneau and Roux (2008); Schreck et al. (2010). Bed mobilization is also strongly affected by the complex and unsteady fluid flow above the bed, as well as how strongly the fluid flow couples to the grains, as quantified by the particle Reynolds number Shields (1936); Buffington and Montgomery (1997); Dey and Papanicolaou (2008); Beheshti and Ataie-Ashtiani (2008) that measures how quickly grains equilibrate to the fluid flow. Weak stresses applied to the interior of the bed by fluid flowing through the pore spaces between grains may also play a role in bed mobilization Rose (1945); Beavers and Joseph (1967); Scheidegger (1974). Although empirical hydraulic models capture some important aspects of sediment transport problems Charru et al. (2004), there is at present no fundamental understanding of the relative contributions of these effects on the onset and cessation of grain motion.
In this paper, we study a simplified model of a fluid-driven granular bed to clarify the essential physics at the onset of bed motion. In particular, we seek to understand the nature of the mobile-to-static and static-to-mobile transitions as a function of and and to predict the parameter regime where hysteresis, defined as a finite difference between , above which a static bed will begin to move, and , below which a mobile system will come to rest, occurs.
We performed molecular dynamics (MD) simulations of a two-dimensional (2D) system composed of frictionless disks subjected to a simplified fluid flow that decays from a large value above the bed to a small value inside the bed. Although our model is highly simplified, with, for example, no explicit unsteadiness in the flow or friction between the grains, we find that from the simulations is consistent with the behavior obtained from a large collection of experiments on sediment transport Buffington and Montgomery (1997); Dey and Papanicolaou (2008); Beheshti and Ataie-Ashtiani (2008). In particular, we find plateau values and at low and high , with , and an intermediate regime that connects the two limiting values. In the low limit, there is a sharp transition at between mobile and static beds in the infinite-time and infinite-system-size limits with no hysteresis. In the large limit, we find significant hysteresis, since particle inertia can sustain motion well below the at which bed motion is initiated. We also find that the onset of bed motion at for low and for high depends strongly on system size and exhibits weakest-link statistics Weibull (1939, 1951). Thus, the onset of bed motion in our system depends on the bed packing structure, even deep beneath the surface.
II Details of the model
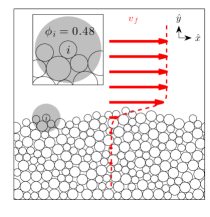
We study a domain of width that contains large and small disks with diameter ratio . There is no upper boundary, and the lower boundary is rigid with infinite friction so that the horizontal velocities of all particles touching it are set to zero. We use periodic boundary conditions in the horizontal direction. The total force on each particle is given by the vector sum of contact forces from other particles, a gravitational force, and a Stokes-drag-like force from a fluid that moves horizontally:
| (1) |
Here, is the particle mass, is the diameter of particle , and are the velocity and acceleration of particle , is the buoyancy-corrected particle weight, sets the drag on disk , is a characteristic fluid velocity at the surface of a static bed, and is the fluid velocity at . is the pairwise repulsive contact force on disk from disk , where is the particle stiffness, is the separation between the centers of the particles, , is the unit vector connecting their centers, and is the Heaviside step function. , the fluid velocity profile, varies smoothly from a large value above the bed to a small value inside the bed. We choose a form that depends only on the local packing fraction : where controls the ratio of the magnitude of the fluid flow above and inside the bed. is calculated in a small circular region with diameter around each particle, as shown in Fig. 1(a). We note that for , a typical value at the bed surface. See Section III.1 for force profiles in static and mobile states.
Three nondimensional numbers govern the behavior of Eq. (1). We set the nondimensional stiffness to be sufficiently large that increasing it has no effect on our results. The other two nondimensional parameters can be written as
| (2) | ||||
| (3) |
The Shields number gives the dimensionless shear force at the top of a static bed. is the ratio of the gravitational settling time to the viscous time scale . Since the particle Reynolds number , where is the kinematic viscosity, and the Stokes drag is proportional to , where is the fluid density, the ratio ( is the mass density of the grains) compares the inertia of grains entrained in the flow to the strength of the viscous drag.
(a)
(b)
To characterize flow onset and cessation in our system, we employed two protocols. In protocol A, to study the mobile-to-static transition, we distributed particles randomly throughout the domain and set a constant value of for a total time of roughly . We consider the bed to be at rest when the maximum net particle acceleration is below a threshold roughly one order of magnitude smaller than and roughly three orders of magnitude smaller than typical values for a moving bed. In protocol B, to understand the dynamics of the static-to-mobile transition, we begin with a static bed from protocol A and slowly increase in increments . If after roughly one inter-grain collision time, then is increased. If , we keep constant until . We designate a system as mobile under protocol B with slightly different criteria: and , where is the average horizontal velocity of all grains and is the settling velocity. These thresholds filter out small rearrangement events, keeping only states with substantial grain motion.
III Results and Discussion
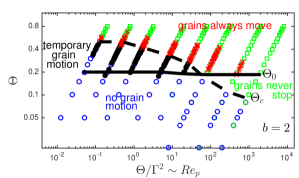
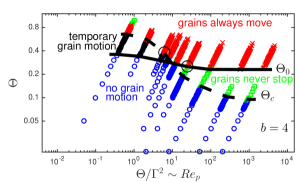
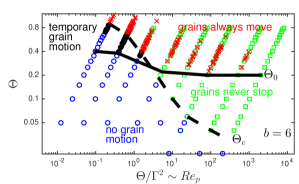
Figure 2 shows the boundaries between mobile and static beds as a function of and from simulations with , 4, and 6. We find a curve above which the particles are unable to find a stable packing under protocol A. In the low- limit near , grain motion is highly overdamped, and particles do not leave the bed. As is increased, the inertial effects of mobilized particles striking the bed make finding a stable configuration more difficult, decreasing significantly. Figure 2 shows parameter values where grain motion does (blue circles) and does not (green squares) stop under protocol A. We then apply protocol B to stopped systems and find another boundary that specifies when grain flow can be initiated. For low , , and bed motion initiated near is temporary. Thus, at low , permanent grain motion is initiated at in the large system limit, as we discuss below. However, in the high- limit where particle inertia is dominant, we observe significant hysteresis: grain motion is initiated at , which is well above the value of where mobile particles colliding with the bed can sustain bed motion. We also note that this result is consistent with Carneiro et al. (2011), where, in simulations of Aeolian transport at high , a significant perturbation or lift force was required near to initiate grain motion. Temporary (filled black circles) and permanent (red crosses) motion under protocol B are also marked in Fig. 2. The basic nature of the flow diagram is insensitive to variations in , although the numerical values for and change. We note the similarities of in Fig. 2 to the experimental and observational data compiled in Buffington and Montgomery (1997); Dey and Papanicolaou (2008); Beheshti and Ataie-Ashtiani (2008), even though our model is highly simplified. Both display a plateau in the onset value of at low , a decrease in the onset value at moderate , and a lower plateau value at high .
(a)
(b)
(c)
The parameter sets the ratios between the fluid velocity above the bed (), at the top of a static bed (), and in the bulk of the bed () where grains are packed densely (at ). If a grain is well above the bed, (since the grain itself contributes to the local packing fraction), so the ratio of the fluid velocity for this grain to the fluid velocity at the top of an otherwise static bed (where and thus ) is . Table 1 shows the ratios , , and for , 4, and 6.
| when | ||||
|---|---|---|---|---|
| 2 | 2.23 | 1.97 | 4.39 | |
| 4 | 4.95 | 3.89 | 19.3 | |
| 6 | 11.02 | 7.69 | 84.8 |
Note that these ratios increase with , and that varying changes all ratios simultaneously. Obviously, a fluid flow model with an additional parameter could decouple the and ratios, but the model used here was chosen as a very simple way to interpolate between a large fluid velocity above the bed and a small fluid velocity inside the bed. Figure 2 shows that the flow diagram is qualitatively the same for , 4, and 6. is relatively insensitive to , but shifts to smaller and the gap between the plateau values at large and small widens with increasing .
III.1 Protocol A: Mobile-to-static transition
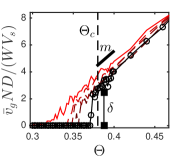
Figure 3 shows data from protocol A near , which we find to be nearly independent of system size, as we discuss below. In Fig. 3(a), we show the time evolution of multiplied by the fill height and normalized by . At short times (red curve), increases linearly with and connects continuously to . This is the expected relation for frictionless granular systems: no motion occurs below the yield stress, while above the yield stress the strain rate increases as a power law in the difference between the applied and yield stresses Xu and O’Hern (2006). However, at long times we observe a discontinuity in at , as has also been observed in experiments Lajeunesse et al. (2010) as well as simulations of Aeolian transport Carneiro et al. (2011) and sheared frictional granular media Otsuki and Hayakawa (2011). The discontinuity in moves toward as time increases. The size of the discontinuity and the slope both scale roughly linearly with , as shown in Fig. 3(b). For Shields numbers below , the grains settle into a stable packing in a time that diverges as , as shown in Fig. 3(c).
(a) (b)
(c)
(d)
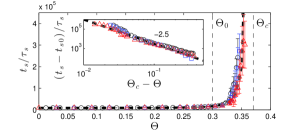
Figure 1 shows that mobile grains are confined to a relatively small layer at the top of the bed. So, for fill heights studied here (), we find the total flow rate as a function of and is insensitive to the system size (recall, is the average velocity of all grains). One might think that the discontinuity in the the flow rate near may disappear in the large-system limit: small systems of grains are able to find a stable configuration, but very large systems will always have a weak spot that does not allow the system to stop. However, this is not the case. Figure 3(d) shows that the behavior near is insensitive to the system size. The stopping time as a function of is shown for three different system sizes, and the three curves are virtually identical. The mean and fluctuations of the stopping time both diverge as a power law as . The data shown is for and , where , and the power law exponent is roughly 2.5. As shown in Fig. 3(c), this exponent is roughly 3 in the low limit, and it decreases with increasing to less than 1 in the high limit. is also shown, and it corresponds reasonably well to where the divergence begins, which suggests that is related to the power law exponent of the divergence.
(a) (b)
(c)
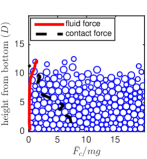
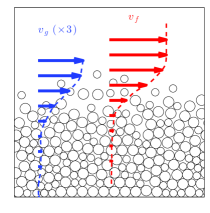
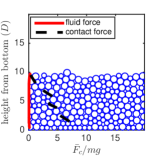
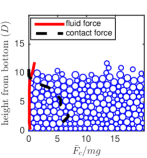
In Figure 4, we show typical force profiles during protocol A for grains under three different conditions. All panels have and , but with varying . Solid red curves show the average force exerted by the fluid on the grains at a particular height. Black dashed curves show the average pressure due to grain-grain contacts as a function of height. To calculate the pressure, we first calculate the force moment tensor at particle by summing over the particles that contact particle to obtain , where is the particle radius, and represent components, and represents the component of the branch vector connecting the center of particle with the point of contact with particle . The mean of the eigenvalues of this tensor provides a grain-scale estimate of the local pressure, which we then average over the horizontal direction to obtain the average contact force . We plot in Fig.4 as a function of height from the lower boundary as a black dashed line, which has roughly slope 1 in all plots. Thus, the contact forces below the surface are dominated by the weight of grains above a particular layer. Figure 4(a) shows , which is below both and , so grains are not moving. Figure 4(b) shows , so the flow is metastable and grains will eventually come to a stop. Figure 4(c) shows , so grains continue to move indefinitely.
III.2 Protocol B: Static-to-mobile transition
For , a sufficiently large perturbation will lead to sustained bed motion. At high , this motion never begins for . But as the red crosses in Fig. 2 show, stable motion is not always initiated at these minimum values, but depends on the particular arrangement of grains in the bed. We show that sustained grain motion is consistent with Weibullian weakest link statistics Weibull (1939, 1951) and that failure events are always initiated at for low and for high for sufficiently large systems.
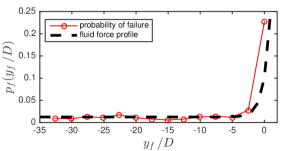
First, we note that although the first large-scale motion of the grains always occurs at the top layer of grains, failure events do not always originate there. If we measure the depth of the particle whose acceleration first exceeds at , we find that it can occur at any depth below the bed surface, with a probability distribution that is proportional to the local applied fluid force as shown in Fig. 5. Essentially, the ratio of the probability of failure at the surface to the probability of failure in the bed is roughly given by the ratio between the fluid force at the top of the bed to that inside the bed , as given in Table 1. Thus, while large-scale particle motion always begins at the surface of the bed, this motion is often correlated to small particle rearrangements that occur deep in the bed.
(a)
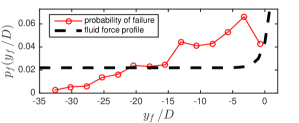
(b)
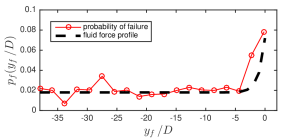
(c)
(a) (b) (c)
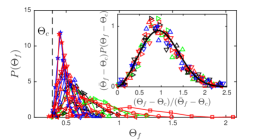
(d) (e) (f)
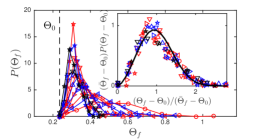
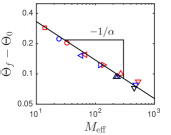
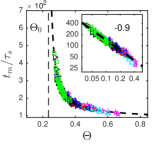
Figure 6(a) and (d) show that the probability distribution approaches for low and for high in the large system limit, where we varied both and to change the system size. The insets show that the distributions collapse when rescaled by their mean values. The system-size dependence suggests a “weakest link” picture: at a given value of excess stress above or (for low and high , respectively), there is a better chance of finding a sufficiently weak local grain arrangement somewhere in a larger system. If we consider the bed to be a composite system of uncorrelated subsystems that fails if any of the subsystems fail, the cumulative distribution for failure is related to that of a single subsystem by
| (4) |
If we assume a Weibull distribution Weibull (1939, 1951); Franklin (2014)
| (5) |
then will have the same form with and . Figure 6(a) and (d) show that does indeed obey a Weibull distribution with shape parameter .
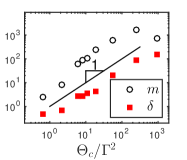
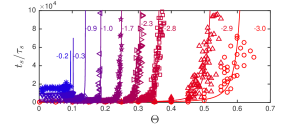
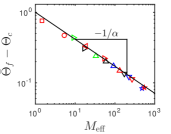
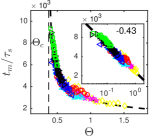
Thus, if Eq. (5) fits the data, and if is constant but as is varied, then Eq. (4) applies, and global failure is caused by the failure of a single member of a collection of uncorrelated subsystems. Figure 6(b) and (e) confirm this, showing that the mean Shields number at flow onset scales as for small and for large , where is the effective system size. This scaling means that larger systems are more likely to fail near or for small and large , respectively. However, systems that fail near these minimum values are very slow to become fully mobilized. To demonstrate this, we consider the mobilization time , defined as the time between the initial force imbalance that leads to failure and the time when reaches its asymptotic value. As shown in Fig. 6(c) and (f), this time scale also diverges as for low and for high , and is independent of system size.
To calculate , we determine and as follows. Since the vertical symmetry is broken by the fluid forcing profile, we calculate by integrating the probability of failure over the depth of the system, which is equal to the fluid force profile. That is, is the integral of the profiles shown in Fig. 5 over the depth of the bed, since the relevant system size for the Weibullian weakest link scaling has to do with the probability of local failure, and, as previously mentioned, particles near the surface cause failure with a likelihood that is greater than particles beneath the surface by a factor . We find that this form for collapses the data for systems that are sufficiently large in the horizontal (periodic) direction. We also check the form of for a case where and , such that , and we find it to collapse the data well according to the Weibullian scaling. The form of confirms our observation that surface grain motion can be initiated from deep beneath the surface, as it is also proportional to the local applied shear force.
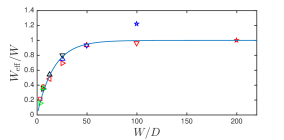
The horizontal dimension is symmetric, but we find finite system-size effects when , where is a horizontal correlation length that varies with . As shown in Fig. 6, we find for large systems, where is calculated using the method described previously. However, when the horizontal dimension becomes small, we observe that is larger than expected, which corresponds to an effective system width that is smaller than the real system width .
If , and we assume that , then we can write
| (6) |
A plot of this quantity is shown in Fig. 7, and the fit line corresponds to
| (7) |
IV Summary
In summary, we performed numerical simulations of a granular bed subjected to a simple fluid shear flow to understand general features of the initiation and cessation of grain motion. The critical Shields number for the onset of grain motion from the simulations is consistent with the behavior from a large body of experimental results Buffington and Montgomery (1997). At low , separates mobile and static beds, but at high , we observe significant hysteresis as a consequence of particle inertia. We find that the onset of grain motion is directly connected to the packing structure, even deep in the bed where there is a weak but nonzero fluid stress Rose (1945); Beavers and Joseph (1967); Scheidegger (1974). Our results from this simple model clarify the essential physics governing the transition between mobile and static beds. In future work, additional effects such as turbulent flow, inter-grain friction, and nontrivial particle shape can be added one-by-one to determine their distinct effects on the onset and cessation of grain motion.
Acknowledgements.
This work was supported by the US Army Research Office under Grant No. W911NF-14-1-0005.References
- Einstein (1950) H. A. Einstein, The Bed-load Function for Sediment Transportation in Open Channel Flows, Technical bulletin (United States. Dept. of Agriculture) (U.S. Department of Agriculture, 1950).
- Charru et al. (2013) François Charru, Bruno Andreotti, and Philippe Claudin, “Sand ripples and dunes,” Annual Review of Fluid Mechanics 45, 469–493 (2013).
- Doron et al. (1987) P. Doron, D. Granica, and D. Barnea, “Slurry flow in horizontal pipes—experimental and modeling,” International Journal of Multiphase Flow 13, 535 – 547 (1987).
- Capecelatro and Desjardins (2013) J. Capecelatro and O. Desjardins, “Eulerian–Lagrangian modeling of turbulent liquid-solid slurries in horizontal pipes,” Intl. J. Multiphase Flow 55, 64–79 (2013).
- Shields (1936) A. Shields, “Anwendung der ähnlichkeitsmechanik und der Turbulenzforschung auf die Geschiebebewegung,” in Mitteilungen der Preussischen Versuchsanstalt für Wasserbau und Schiffbau, Vol. 26 (1936).
- Wiberg and Smith (1987) Patricia L. Wiberg and J. Dungan Smith, “Calculations of the critical shear stress for motion of uniform and heterogeneous sediments,” Water Resources Research 23, 1471–1480 (1987).
- Buffington and Montgomery (1997) J. M. Buffington and D. R. Montgomery, “A systematic analysis of eight decades of incipient motion studies, with special reference to gravel-bedded rivers,” Water Resour. Res. 33, 1993–2029 (1997).
- Charru et al. (2004) F. Charru, H. Mouilleron, and O. Eiff, “Erosion and deposition of particles on a bed sheared by a viscous flow,” J. Fluid Mech. 519, 55–80 (2004).
- Ouriemi et al. (2007) Malika Ouriemi, Pascale Aussillous, Marc Medale, Yannick Peysson, and Élisabeth Guazzelli, “Determination of the critical shields number for particle erosion in laminar flow,” Physics of Fluids 19, 061706 (2007).
- Beheshti and Ataie-Ashtiani (2008) A.A. Beheshti and B. Ataie-Ashtiani, “Analysis of threshold and incipient conditions for sediment movement,” Coastal Engineering 55, 423 – 430 (2008).
- Dey and Papanicolaou (2008) Subhasish Dey and Athanasios Papanicolaou, “Sediment threshold under stream flow: A state-of-the-art review,” KSCE Journal of Civil Engineering 12, 45–60 (2008).
- Lajeunesse et al. (2010) E. Lajeunesse, L. Malverti, and F. Charru, “Bed load transport in turbulent flow at the grain scale: Experiments and modeling,” J. Geophys. Res. 115, F04001 (2010).
- Derksen (2011) J. J. Derksen, “Simulations of granular bed erosion due to laminar shear flow near the critical shields number,” Physics of Fluids 23, 113303 (2011).
- Hong et al. (2015) A. Hong, M. Tao, and A. Kudrolli, “Onset of erosion of a granular bed in a channel driven by fluid flow,” Phys. Fluids 27, 013301 (2015).
- Houssais et al. (2015) M. Houssais, C. P. Ortiz, D. J. Durian, and D. J. Jerolmack, “Onset of sediment transport is a continuous transition driven by fluid shear and granular creep,” Nat. Commun. 6, 7527 (2015).
- Silbert et al. (2002) Leonardo E. Silbert, Deniz Ertaş, Gary S. Grest, Thomas C. Halsey, and Dov Levine, “Geometry of frictionless and frictional sphere packings,” Phys. Rev. E 65, 031304 (2002).
- Peyneau and Roux (2008) Pierre-Emmanuel Peyneau and Jean-Noël Roux, “Frictionless bead packs have macroscopic friction, but no dilatancy,” Phys. Rev. E 78, 011307 (2008).
- Schreck et al. (2010) Carl F. Schreck, Ning Xu, and Corey S. O’Hern, “A comparison of jamming behavior in systems composed of dimer- and ellipse-shaped particles,” Soft Matter 6, 2960–2969 (2010).
- Rose (1945) H. E. Rose, “On the resistance coefficient–reynolds number relationship for fluid flow through a bed of granular material,” Proceedings of the Institution of Mechanical Engineers 153, 154–168 (1945), http://pme.sagepub.com/content/153/1/154.full.pdf+html .
- Beavers and Joseph (1967) Gordon S. Beavers and Daniel D. Joseph, “Boundary conditions at a naturally permeable wall,” Journal of Fluid Mechanics 30, 197–207 (1967).
- Scheidegger (1974) A. E. Scheidegger, The physics of flow through porous media (University of Toronto Press, 1974).
- Weibull (1939) W. Weibull, A Statistical Theory of the Strength of Materials, Ingeniörsvetenskapsakademiens handlingar (Generalstabens litografiska anstalts förlag, 1939).
- Weibull (1951) W. Weibull, “A statistical distribution function of wide applicability,” J. Appl. Mech. 18, 293–297 (1951).
- Carneiro et al. (2011) M. V. Carneiro, T. Pähtz, and H. J. Herrmann, “Jump at the onset of saltation,” Phys. Rev. Lett. 107, 098001 (2011).
- Xu and O’Hern (2006) Ning Xu and Corey S. O’Hern, “Measurements of the yield stress in frictionless granular systems,” Phys. Rev. E 73, 061303 (2006).
- Otsuki and Hayakawa (2011) Michio Otsuki and Hisao Hayakawa, “Critical scaling near jamming transition for frictional granular particles,” Phys. Rev. E 83, 051301 (2011).
- Franklin (2014) Scott V. Franklin, “Extensional rheology of entangled granular materials,” EPL (Europhysics Letters) 106, 58004 (2014).