26Al kinematics: superbubbles following the spiral arms?
Abstract
Context. High energy resolution spectroscopy of the 1.8 MeV radioactive decay line of 26Al with the SPI instrument on board the INTEGRAL satellite has recently revealed that diffuse 26Al has large velocities in comparison to other components of the interstellar medium in the Milky Way. 26Al shows Galactic rotation in the same sense as the stars and other gas tracers, but reaches excess velocities up to 300 km s-1.
Aims. We investigate if this result can be understood in the context of superbubbles, taking into account the statistics of young star clusters and H I supershells, as well as the association of young star clusters with spiral arms.
Methods. We derive energy output and 26Al mass of star clusters as a function of the cluster mass via population synthesis from stellar evolutionary tracks of massive stars. Using the limiting cases of weakly-dissipative and strongly-dissipative superbubble expansion, we link this to the size distribution of H I supershells and assess the properties of likely 26Al-carrying superbubbles.
Results. 26Al is produced by star clusters of all masses above M⊙, roughly equally contributed over a logarithmic star cluster mass scale, and strongly linked to the injection of feedback energy. The observed superbubble size distribution cannot be related to the star cluster mass function in a straight forward manner. In order to avoid that the added volume of all superbubbles exceeds the volume of the Milky Way, individual superbubbles have to merge frequently. If any two superbubbles merge, or if 26Al is injected off-centre in a bigger HI supershell we expect the hot 26Al-carrying gas to obtain velocities of the order of the typical sound speed in superbubbles, km s-1before decay. For star formation coordinated by the spiral arm pattern which, inside corotation, is overtaken by the faster moving stars and gas, outflows from spiral arm star clusters would flow preferentially into the cavities inflated by previous star formation associated with this arm. Such cavities would preferentially be located towards the leading edge of a given arm.
Conclusions. This scenario might explain the 26Al kinematics. The massive-star ejecta are expected to survive yr before being recycled into next-generation stars.
Key Words.:
Gamma rays: ISM – ISM: kinematics and dynamics – ISM: bubbles – ISM: structure – Galaxy: structure1 Introduction
The possibilities to obtain kinematic information for the hot phase of the interstellar medium (ISM) are generally very limited. While multimillion-degree gas is common, and metal lines are observed (e.g., Henley & Shelton 2012), the spectral resolution typically does not allow one to meaningfully constrain flows of hot gas in galaxy clusters (Biffi et al. 2013), and more so for the smaller velocities in the ISM.
The gamma-ray spectrometer aboard INTEGRAL (SPI, Vedrenne et al. 2003; Winkler et al. 2003), has a spectral resolution of 3 keV at 1.8 MeV, where 26Al can be observed through its characteristic gamma-ray decay line. With increasing exposure times (Diehl et al. 2006; Kretschmer et al. 2013, Paper I in the following), it has become possible to measure the centroid position of the line with an accuracy of tens of km s-1, sufficient to clearly observe the Doppler shift due to large-scale rotation along the ridge of the Galaxy within longitudes deg.
Towards the Galactic centre (), the apparent 26Al velocity is zero with a hint for a small blue-shift. For greater positive (negative) longitudes, the projected velocity rises beyond 200 (-200) km s-1. The direction of the line shift corresponds to Galactic rotation, but its magnitude is significantly larger than what is expected from CO and H I . Paper I also showed that an ad hoc model assuming forward blowout at 200 km s-1 from the spiral arms of the inner Galaxy can well explain the data. The physical interpretation would be that 26Al is ejected into the hot phase of the ISM in superbubbles at the leading edges of the gaseous spiral arms. Hydrodynamic interaction with the locally anisotropic ISM would then lead to a preferential expansion of the superbubbles into the direction of Galactic rotation (in addition to out-of-plane-blowout).
The sources of diffuse, interstellar 26Al are massive star winds and supernovae (Prantzos & Diehl 1996). These are energetic events, which lead to the formation of bubbles (one massive star) and, because massive stars often occur together with other massive stars in associations and bound clusters, (e.g., Zinnecker & Yorke 2007; Kroupa et al. 2013; Krumholz 2014), superbubbles. Superbubbles are observed in many different wavelengths (e.g., Krause et al. 2014). Statistical information is, however, mainly restricted to sizes and kinematics of the cavities seen in H I. Bagetakos et al. (2011) analysed 20 nearby spiral galaxies, whose properties are thought to be similar to those of the Milky Way, and found more than 1000 ”H I holes”. We use their data as reference below. Oey & Clarke (1997) have connected the statistics of H I holes to the star cluster mass function, finding that the sizes and velocities of H I holes may be explained by massive star activity in star clusters (compare below, however). Because this association is established now, we will in the following use the term ”HI supershells” instead of ”HI holes”, for clarity.
The 26Al measurement constitutes another piece of statistical information for bubbles and superbubbles. 26Al decays on a timescale of 1 Myr, much less than typical superbubble lifetimes (e.g., Oey & García-Segura 2004; Bagetakos et al. 2011; Heesen et al. 2015). Hence, we may expect it to reflect internal dynamics.
Here, we connect the observed 26Al kinematics to the statistics of star clusters (Sect. 2) and superbubbles (HI supershells, Sect. 3), in order to better understand the large-scale gas flows traced by 26Al. In particular, we are interested to constrain superbubble merging, because superbubble merging may lead to asymmetric motions relative to the parent star clusters, when gas from a high pressure superbubble streams into a low-pressure cavity. We find that star clusters of all masses contribute to the 26Al signal. Oey & Clarke (1997) investigate superbubble merging in the Milky Way with inconclusive results. With updated models and star-formation rate we find frequent merging. Hence, we expect the 26Al-traced hot outflows to be injected into pre-existing superbubbles. We then argue in Sect. 4 that the spatial co-ordination of star formation in the Milky Way by the spiral arms may lead to the observed 26Al kinematics.
2 Which star clusters produce how much 26Al?
Star formation generally takes place in clusters and associations, the majority of which disperse after some time (Lada & Lada 2003; Kruijssen 2012). For the case of bound star clusters it is debated if the dispersal is due to gas expulsion (e.g., Gieles & Bastian 2008). Recent observations did not find the expansion velocities expected if gas expulsion was important (e.g., Hénault-Brunet et al. 2012). Hence, the dispersal is probably related to tidal effects (e.g., Kruijssen et al. 2012a), which could take as long as 200 Myr (Kruijssen et al. 2012b). It is therefore reasonable to assume that for the timescales of interest here, the great majority of massive stars are grouped (compare also Zinnecker & Yorke 2007). The mass function of embedded star clusters (mostly unbound), which is where most star formation takes place locally (Lada & Lada 2003) has a very similar slope than the one of star clusters in external galaxies (compare below). Therefore, we assume just one mass function for star forming regions in the following, and generally use the term ”star cluster” without qualifying adjective to subsume bound and unbound star forming regions.
For spiral galaxies like the Milky Way, the initial cluster mass function (ICMF) is given by (e.g., Larsen 2009; Bastian et al. 2012)
| (1) |
where is the normalisation, the cutoff mass M⊙, and we take the power-law index to be ; compare also the reviews by Lada & Lada (2003); Kroupa et al. (2013); Krumholz (2014). Following Lada & Lada (2003), we adopt a lower limit for star cluster masses of 50 M⊙. Embedded star clusters have not been shown to possess the exponential cutoff. We have, therefore, checked that the presence of the high-mass cutoff only marginally influences our results.
Since only massive stars produce 26Al, we have to relate the occurrence of massive stars to the masses of star clusters. We carry out the entire analysis for both, optimal sampling (Kroupa et al. 2013), where the masses of massive stars are fixed for given star cluster mass, and random sampling (e.g., Krumholz 2014). For random sampling, we fix the stellar mass above 6 M⊙ to the corresponding fraction of the IMF from (Kroupa et al. 2013). While the extreme assumption of optimal sampling has been challenged recently (Andrews et al. 2014), we use it here to demonstrate that even such a strong truncation of the IMFs would not affect the conclusions.
For such groups of massive stars, we use the population synthesis results from Voss et al. (2009) (stellar evolutionary tracks of rotating stars of Meynet & Maeder (2005) and wind velocities from Lamers et al. (1995) and Niedzielski & Skorzynski (2002) for the Wolf-Rayet phase) to obtain the 26Al mass as well as the energy injected into the ISM by massive stars as a function of time and stellar mass. The release of mass, energy and 26Al is largely completed after about 48 Myr, the lifetime of stars of about 8 M⊙, also broadly consistent with the age estimates for H I supershells given by Bagetakos et al. (2011). Not all the stars in a cluster might form at the same time. However typical age spreads within clusters are of order 1 Myr or below (e.g., Niederhofer et al. 2015), which is much shorter than the timescales of interest. We therefore use the star cluster population up to 48 Myr for our model. Following Chomiuk & Povich (2011), we take 1.9 M⊙ yr-1 for the star formation rate of the Milky Way. This sets the constant in eq. (1) to M⊙-1. Uncertainties in this parameter are substantial (compare also Kennicutt & Evans 2012).
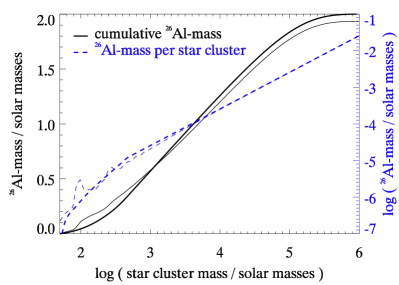
With these assumptions, we calculate the time-averaged 26Al mass for a given star cluster. For each star cluster, we first determine the masses of its stars above 8 M⊙ by the optimal sampling method, the amount of released 26Al from Voss et al. (2009), taking into account radioactive decay, and finally average over time (48 Myr). The result is shown in Fig. 1. Apart from small features towards lower masses, the 26Al yield is almost linear even for optimal sampling. For star clusters below about 1000 M⊙, the sampling method matters. For both, random and optimal sampling, the 26Al mass per cluster drops below the linear relation, because the IMF can no longer be fully sampled (e.g. a 120 M⊙ star may not live in a 50 M⊙ star cluster). We note that using the IMF directly, without dividing the mass of young stars into star clusters, to predict the Galactic 26Al mass yields a higher value by about 20 per cent.
The ICMF has roughly equal mass in each decade of star cluster mass (within the cutoffs). This remains true with the 26Al mass folded in, because the latter is roughly proportional to the star cluster mass: star clusters of each decade in mass, from a few hundred to about M⊙, contribute about equally to the observed 26Al signal (Fig. 1).
3 Superbubble size distributions and merging
Here, we investigate if merging of superbubbles is common in the Milky Way. We follow the overall procedure described in Oey & Clarke (1997), but update the expansion models from our own 3D hydrodynamics simulation studies (compare below). While towards the low mass end, the ICMF includes many objects with only one massive star, which will produce a single-star bubble, we use the term ”superbubble”, below for simplicity for all bubbles produced by the star clusters.
Mac Low & McCray (1988) present a self-similar model for superbubble expansion, where the superbubble expands steadily with radius proportional to a power law in time . About 35 per cent of the injected energy, , is dissipated radiatively in this model. This model should be increasingly adequate for larger superbubbles, with more frequent explosions, and at later times.
In Krause et al. (2013) and Krause & Diehl (2014), we have developed a more strongly dissipative model from 3D hydrodynamics simulations. The reason for the stronger dissipation is the more realistic, non-steady energy input and the emergence of a highly radiative mixing layer due to 3D instabilities. Our results are well approximated by 90 per cent dissipation in the steady energy input phase before the first supernova and a decline of the current energy, , after each supernova with time as (momentum-conserving snowplough). Both are an upper limit on the energy dissipation, as in the pre-supernova phase we still observed a slight dependence on numerical resolution ( per cent dissipation at the highest resolution) and, as the superbubble expands, the density around star clusters will drop below the 10 cm-3 we assumed in the simulations. The strongly dissipative model should be more adequate for superbubbles with few supernovae, and indeed explains, e.g., the X-ray-luminosity–kinematics relation well (Krause & Diehl 2014).
We use the evolution of the superbubble energy from both models and predict the radius in the thin shell approximation following Krause & Diehl (2014). Their eq. (3) for constant ambient density evaluates to
We calculate models for both, random sampling and optimal sampling. For the weakly dissipative models, we also add models where we take a constant ISM pressure of (Jenkins & Tripp 2011) into account which limits the expansion. The momentum equation may then be written as (Krause 2005): , with , which we solve numerically. For this model, we also regard a superbubble as dissolved when the expansion velocity has dropped to 10 km s-1 and perturbations with this velocity had time to grow to the size of the superbubble, similar to the ”stalled and surviving” mode in (Oey & Clarke 1997). We do not investigate this option for the strong dissipation models, because the assumption of momentum conservation after each supernova explosion implies a total pressure force of zero.
For the following analysis, we neglect the shear gradient from galactic rotation. It is typically 10-50 km s-1 kpc-1 (Bagetakos et al. 2011), and therefore has a small effect on active superbubbles, in agreement with the moderate asymmetries found by Bagetakos et al. (2011), but will eventually destroy old ones. The finite exponential scaleheight of the ISM introduces a cutoff in the superbubble radii in the Galactic plane due to blow-out related pressure loss at (Baumgartner & Breitschwerdt 2013). We set this cutoff superbubble radius to 1 kpc for the whole sample, and 0.5 kpc for the Milky Way modelling below due to the lower H I scaleheight (Narayan & Jog 2002; Langer et al. 2014).
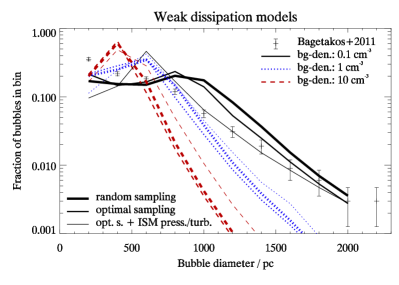
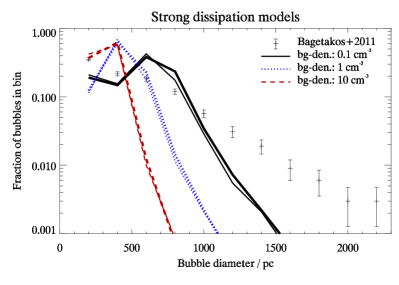
We first calculate the fractional distributions of superbubble diameters for three different assumptions for the background density for the sample of star-forming galaxies from Bagetakos et al. (2011), i.e. kpc, and compare this to the observations in Fig. 2. Generally, models with lower background density provide a better match to the observations. As expected, the weakly dissipative model more closely represents the large superbubbles. The model is not quite satisfactory, because the density required to reach the larger diameters, 0.1 cm-3, is on the low side of values suggested by observations, 0.1-0.7 cm-3(Bagetakos et al. 2011). One might be able to interpret this finding by shear effects, adopting a higher density, i.e. choosing a curve between the dotted blue and solid black lines in Fig. 2.
The strongly dissipative models may produce a significant population at around 1 kpc diameter, but, on the other hand, cannot account for large H I supershells. ISM pressure becomes most important for intermediate-size H I supershells and for low ISM density ( kpc for cm-3). At high ISM densities, ISM pressure is negligible, but in these models many slower and smaller superbubbles are destroyed when considering ISM turbulence, which increases the fraction of larger superbubbles. The IMF sampling method has a minor effect on the results (compare Fig. 2).
We can now predict the superbubble distribution for the Milky Way from the star formation rate using the procedure outlined above, now with kpc. The fractional distributions are identical to Fig. 2, but cut at 1 kpc due to the reduced scaleheight. The observed fractional H I supershell diameter distribution for the Milky Way (Ehlerová & Palouš 2013) is consistent with the one of external star-forming galaxies from (Bagetakos et al. 2011), which we used here.
Because for the Milky Way, the total number of superbubbles is constrained by the star-formation rate, we may now check for superbubble merging by calculating the total volume predicted by our model to be occupied by superbubbles and comparing it to the volume of the Milky Way ISM. The total occupied volume for the given star formation rate exceeds the one of the Milky Way ISM (cylinder: 10 kpc radius, 1 kpc thickness) for all assumptions (Table 1).
This indicates that the superbubbles merge frequently. In the case of merging superbubbles, the total volume is not simply the sum of the individual volumes, but much smaller. The observed volume fractions of H I supershells (3D porosity) are typically below 10 per cent and may reach 20 per cent in later Hubble types (Bagetakos et al. 2011). A superbubble volume fraction around 20 per cent is expected from the hot gas fraction in the ISM simulations of de Avillez & Breitschwerdt (2005). Combined with our analysis, this strengthens the point about superbubble merging. A consistent interpretation would be that the smaller superbubbles in the diameter distribution (Fig. 2) merge to obtain more HI supershells at large diameters. This would also alleviate the requirement for low ambient density (compare above).
There is a lot of direct evidence for superbubble merging in the Milky Way: 29 per cent of the bubbles identified in ”The Milky Way Project”, a citizen science project that identified 5106 bubbles in the Milky Way (many of which are single star bubbles), showed signs of merging (Simpson et al. 2012). Often, secondary bubbles are found on the edge of larger bubbles. Ehlerová & Palouš (2013) calculate the porosity for the Milky Way as a function of radius from 333 identified HI supershells. They find porosities above unity inside of the solar circle, and thus strong overlap of superbubbles. The closest massive star group, Scorpius-Centaurus OB2, is an excellent example for superbubble merging (Pöppel et al. 2010; Preibisch & Mamajek 2008): the different subgroups of the OB association appear to have been triggered by expanding shells from the older parts, and the shell around Upper Scorpius is half merged into an older supershell. The whole structure is expected to merge within a few Myr with the Local Bubble (Breitschwerdt & de Avillez 2006). Evidence for superbubble merging from extragalactic studies is, however, scarce, probably because of the low resolution (typically around 200 pc). H bubbles are however found at the rims of HI supershells (Egorov et al. 2014).
Superbubble merging may produce significant net velocities in ejecta flows with respect to the driving massive-star group. Because the 26Al content is correlated with the energy content of a superbubble (Fig.3), we expect overpressured 26Al-rich material to often stream into lower pressured superbubbles, once the interface is eroded. The situation is similar, if the 26Al production site is located towards one end of an already merged larger superbubble.
| Dissipation | cm-3 | cm-3 | cm-3 |
|---|---|---|---|
| weak | 115/115/33 | 40/38/22 | 11/11/6.1 |
| strong | 47/49 | 12/13 | 3.1/3.3 |
4 A model for the 26Al kinematics

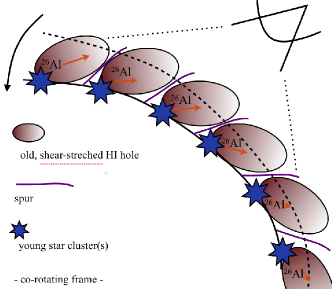
In the preceding sections, we have demonstrated that star clusters of all masses are equally important as 26Al producers, and that, on Galactic scales, star clusters cannot be assigned to individual superbubbles due to frequent superbubble merging. Our model also shows that 26Al injection from star clusters is strongly correlated to energy injection (Fig.3). It follows that 26Al is likely to be observed in motion, and in particular it is likely that it traces gas involved in superbubble merging. Based on these findings, we suggest the following model (Fig.4) to explain the 26Al kinematics.
When spiral arms sweep through the Galactic disc, they trigger the formation of young star clusters that produce large superbubbles, traced as H I supershells. During the observed lifetimes of H I supershells, Myr (Bagetakos et al. 2011), a spiral arm may lag behind stars and gas by as much as a few kpc, due to the pattern speed of the arm which is lower within corotation than the rotational speed of the stars and gas. The current young star clusters in a spiral arm therefore feed 26Al-carrying ejecta into the H I supershells left behind by the receding spiral arm (sketch in Fig. 4).
Despite uncertainties regarding wind clumping (e.g., Bestenlehner et al. 2014) and dust production and clumping (e.g. Indebetouw et al. 2014; Williams 2014), the bulk of 26Al is likely mixed into the diffuse gaseous ejecta, expelled into the hot immediate surroundings of the stars. The ejecta do not keep their initial velocity ( km s-1) for long: for supernovae, they are shocked on timescales of yr (Tenorio-Tagle et al. 1990). For Wolf-Rayet winds inside superbubbles, the free expansion phase can be up to yr, or pc (Krause et al. 2013). The ejecta then travel at a reasonable fraction of the sound speed in superbubbles, km s-1. Here, is Boltzmann’s constant, the proton mass, () the temperature (in units of 0.5 keV), and the numerical factor is calculated for a fully ionised plasma of 90 per cent hydrogen and 10 per cent helium by volume. Measurements of superbubble temperatures range from 0.1 keV to about 1 keV (e.g., Dunne et al. 2001; Jaskot et al. 2011; Sasaki et al. 2011; Kavanagh et al. 2012; Warth et al. 2014), in good agreement with expectations, if instabilities and mixing are taken into account (Krause et al. 2014).
In simulations of merging bubbles (Krause et al. 2013), we find such kinematics for gas flooding the cavities at lower pressure shortly after merging. The ejecta travel about 300 pc during one decay time ( Myr), which corresponds to the size of the smaller H I supershells (Fig. 2), i.e. the decay is expected to happen during the first crossing of the H I supershell.
Hence, we expect a one-sided 26Al outflow at the superbubble sound speed, km s-1, in excellent agreement with the observations and their analysis presented in Paper I.
This model predicts a change in relative outflow direction near the corotation radius. But, corotation in the Galaxy is unfortunately too far out (8.4-12 kpc, e.g., Martínez-Barbosa et al. 2015) to check for direction reversals in the data set of Paper I. At such galactocentric distances, individual 26Al-emission regions are only a few, faint, and not associated with spiral arms. Thus, we do not expect large 26Al velocity asymmetries, in good agreement with the measurements in Cygnus (Martin et al. 2009) and Scorpius-Centaurus (Diehl et al. 2010).
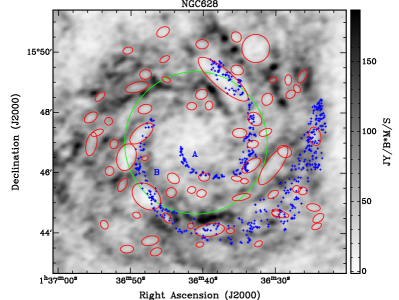
We might, however, expect to find H I supershells associated with the leading-edge of spiral-arm star-formation regions in nearby face-on spiral galaxies, inside their corotation radii. We have investigated this for a few objects by combining H II regions from Honig & Reid (2015) to H I images with H I supershells using corotation radii from Tamburro et al. (2008) and Scarano & Lépine (2013). For NGC~3184 and NGC~5194 we find evidence for H I supershells close to H II regions in the spiral arms. There is no clear trend where the H I supershells are located with respect to the H II regions in NGC~5194, whereas more supershells appear on the trailing edge for NGC~3184.
In the case of NGC~628 (Fig. 5), Honig & Reid (2015) map H II regions for two arms, ’A’ and ’B’, and inside corotation, H I supershells are indeed found close to and overlapping with the H II regions, preferentially at their leading edges. Especially for arm ’B’, which is located in an H I rich part of the galaxy, the H I supershell locations relative to the H II regions change strikingly near the corotation radius: Inside, three prominent H I supershells lie towards the leading edge of the H II arm, extending over about a quarter of a turn. Only one small supershell is located at the trailing edge. From about the corotation radius outwards, the H I supershells are spread over the widening H II arm. None is clearly associated with the leading or trailing edges. It is beyond the scope of this article to explain the differences between these galaxies. The fact that the effect we postulate is consistent with the data in NGC 628 is, however, encouraging.
The 26Al decay time is comparable to the crossing time through the H I supershell, and thus we expect to observe it while it crosses the HI supershells. A few Myr later, 26Al should isotropise, advect ”vertically” into the halo (e.g., de Avillez & Breitschwerdt 2005), or mix due to interaction with the cavity walls. Most of the 26Al has then decayed, and the contribution to the observed -ray signal is small.
5 Conclusions
We interpret the observed 26Al kinematics in the Galaxy as a consequence of superbubble formation propagating with the spiral arms and merging of young superbubbles into older H I supershells, with outflows from currently star-forming regions into the pre-shaped cavities from preceding star-formation towards the leading edges of spiral arms.
The model does not rely on independent offsets between young stars and gaseous spiral arms, which might be created by other – not feedback related – processes and which are a matter of ongoing research (compare, e.g., the review by Dobbs & Baba 2014).
We conclude that 26Al mainly decays during the first crossing of superbubbles while in the hot phase. The bulk of 26Al is therefore not mixing with cold gas on its decay timescale. 26Al has however been found in meteorites indicating its presence in the gas that formed the Sun (e.g., Gounelle & Meynet 2012). The corresponding fraction of 26Al required to mix into a star-forming cloud during the decay timescale is, however, small (Vasileiadis et al. 2013), and would hardly affect our model.
Acknowledgements.
This research was supported by the cluster of excellence “Origin and Structure of the Universe” and by Deutsche Forschungsgemeinschaft under DFG project number PR 569/10-1 in the context of the Priority Program 1573 “Physics of the Interstellar Medium. K. K. was supported by CNES.References
- Andrews et al. (2014) Andrews, J. E., Calzetti, D., Chandar, R., et al. 2014, ApJ, 793, 4
- Bagetakos et al. (2011) Bagetakos, I., Brinks, E., Walter, F., et al. 2011, AJ, 141, 23
- Bastian et al. (2012) Bastian, N., Konstantopoulos, I. S., Trancho, G., et al. 2012, A&A, 541, A25
- Baumgartner & Breitschwerdt (2013) Baumgartner, V. & Breitschwerdt, D. 2013, A&A, 557, A140
- Bestenlehner et al. (2014) Bestenlehner, J. M., Gräfener, G., Vink, J. S., et al. 2014, A&A, 570, A38
- Biffi et al. (2013) Biffi, V., Dolag, K., & Böhringer, H. 2013, MNRAS, 428, 1395
- Breitschwerdt & de Avillez (2006) Breitschwerdt, D. & de Avillez, M. A. 2006, A&A, 452, L1
- Chomiuk & Povich (2011) Chomiuk, L. & Povich, M. S. 2011, AJ, 142, 197
- de Avillez & Breitschwerdt (2005) de Avillez, M. A. & Breitschwerdt, D. 2005, A&A, 436, 585
- Diehl et al. (2006) Diehl, R., Halloin, H., Kretschmer, K., et al. 2006, Nature, 439, 45
- Diehl et al. (2010) Diehl, R., Lang, M. G., Martin, P., et al. 2010, A&A, 522, A51
- Dobbs & Baba (2014) Dobbs, C. & Baba, J. 2014, PASA, 31, 35
- Dunne et al. (2001) Dunne, B. C., Points, S. D., & Chu, Y.-H. 2001, ApJS, 136, 119
- Egorov et al. (2014) Egorov, O. V., Lozinskaya, T. A., Moiseev, A. V., & Smirnov-Pinchukov, G. V. 2014, MNRAS, 444, 376
- Ehlerová & Palouš (2013) Ehlerová, S. & Palouš, J. 2013, A&A, 550, A23
- Gieles & Bastian (2008) Gieles, M. & Bastian, N. 2008, A&A, 482, 165
- Gounelle & Meynet (2012) Gounelle, M. & Meynet, G. 2012, A&A, 545, A4
- Heesen et al. (2015) Heesen, V., Brinks, E., Krause, M. G. H., et al. 2015, MNRAS, 447, L1
- Hénault-Brunet et al. (2012) Hénault-Brunet, V., Evans, C. J., Sana, H., et al. 2012, A&A, 546, A73
- Henley & Shelton (2012) Henley, D. B. & Shelton, R. L. 2012, ApJS, 202, 14
- Honig & Reid (2015) Honig, Z. N. & Reid, M. J. 2015, ApJ, 800, 53
- Indebetouw et al. (2014) Indebetouw, R., Matsuura, M., Dwek, E., et al. 2014, ApJ, 782, L2
- Jaskot et al. (2011) Jaskot, A. E., Strickland, D. K., Oey, M. S., Chu, Y.-H., & García-Segura, G. 2011, ApJ, 729, 28
- Jenkins & Tripp (2011) Jenkins, E. B. & Tripp, T. M. 2011, ApJ, 734, 65
- Kavanagh et al. (2012) Kavanagh, P. J., Sasaki, M., & Points, S. D. 2012, A&A, 547, A19
- Kennicutt & Evans (2012) Kennicutt, R. C. & Evans, N. J. 2012, ARA&A, 50, 531
- Krause (2005) Krause, M. 2005, A&A, 431, 45
- Krause et al. (2014) Krause, M., Diehl, R., Böhringer, H., Freyberg, M., & Lubos, D. 2014, A&A, 566, A94
- Krause et al. (2013) Krause, M., Fierlinger, K., Diehl, R., et al. 2013, A&A, 550, A49
- Krause & Diehl (2014) Krause, M. G. H. & Diehl, R. 2014, ApJ, 794, L21
- Kretschmer et al. (2013) Kretschmer, K., Diehl, R., Krause, M., et al. 2013, A&A, 559, A99
- Kroupa et al. (2013) Kroupa, P., Weidner, C., Pflamm-Altenburg, J., et al. 2013, in Planets, Stars and Stellar Systems, ed. T. Oswalt & G. Gilmore (Springer Netherlands), 115–242
- Kruijssen (2012) Kruijssen, J. M. D. 2012, MNRAS, 426, 3008
- Kruijssen et al. (2012a) Kruijssen, J. M. D., Maschberger, T., Moeckel, N., et al. 2012a, MNRAS, 419, 841
- Kruijssen et al. (2012b) Kruijssen, J. M. D., Pelupessy, F. I., Lamers, H. J. G. L. M., et al. 2012b, MNRAS, 421, 1927
- Krumholz (2014) Krumholz, M. R. 2014, Physics Reports, 539, 49
- Lada & Lada (2003) Lada, C. J. & Lada, E. A. 2003, ARA&A, 41, 57
- Lamers et al. (1995) Lamers, H. J. G. L. M., Snow, T. P., & Lindholm, D. M. 1995, ApJ, 455, 269
- Langer et al. (2014) Langer, W. D., Pineda, J. L., & Velusamy, T. 2014, A&A, 564, A101
- Larsen (2009) Larsen, S. S. 2009, A&A, 494, 539
- Mac Low & McCray (1988) Mac Low, M.-M. & McCray, R. 1988, ApJ, 324, 776
- Martin et al. (2009) Martin, P., Knödlseder, J., Diehl, R., & Meynet, G. 2009, A&A, 506, 703
- Martínez-Barbosa et al. (2015) Martínez-Barbosa, C. A., Brown, A. G. A., & Portegies Zwart, S. 2015, MNRAS, 446, 823
- Meynet & Maeder (2005) Meynet, G. & Maeder, A. 2005, A&A, 429, 581
- Narayan & Jog (2002) Narayan, C. A. & Jog, C. J. 2002, A&A, 394, 89
- Niederhofer et al. (2015) Niederhofer, F., Hilker, M., Bastian, N., & Silva-Villa, E. 2015, ArXiv e-prints
- Niedzielski & Skorzynski (2002) Niedzielski, A. & Skorzynski, W. 2002, Acta Astron., 52, 81
- Oey & Clarke (1997) Oey, M. S. & Clarke, C. J. 1997, MNRAS, 289, 570
- Oey & García-Segura (2004) Oey, M. S. & García-Segura, G. 2004, ApJ, 613, 302
- Pöppel et al. (2010) Pöppel, W. G. L., Bajaja, E., Arnal, E. M., & Morras, R. 2010, A&A, 512, A83
- Prantzos & Diehl (1996) Prantzos, N. & Diehl, R. 1996, Phys. Rep, 267, 1
- Preibisch & Mamajek (2008) Preibisch, T. & Mamajek, E. 2008, The Nearest OB Association: Scorpius-Centaurus (Sco OB2), ed. B. Reipurth, 235
- Sasaki et al. (2011) Sasaki, M., Breitschwerdt, D., Baumgartner, V., & Haberl, F. 2011, A&A, 528, A136+
- Scarano & Lépine (2013) Scarano, S. & Lépine, J. R. D. 2013, MNRAS, 428, 625
- Simpson et al. (2012) Simpson, R. J., Povich, M. S., Kendrew, S., et al. 2012, MNRAS, 424, 2442
- Tamburro et al. (2008) Tamburro, D., Rix, H.-W., Walter, F., et al. 2008, AJ, 136, 2872
- Tenorio-Tagle et al. (1990) Tenorio-Tagle, G., Bodenheimer, P., Franco, J., & Rozyczka, M. 1990, MNRAS, 244, 563
- Vasileiadis et al. (2013) Vasileiadis, A., Nordlund, Å., & Bizzarro, M. 2013, ApJ, 769, L8
- Vedrenne et al. (2003) Vedrenne, G., Roques, J.-P., Schönfelder, V., et al. 2003, A&A, 411, L63
- Voss et al. (2009) Voss, R., Diehl, R., Hartmann, D. H., et al. 2009, A&A, 504, 531
- Walter et al. (2008) Walter, F., Brinks, E., de Blok, W. J. G., et al. 2008, AJ, 136, 2563
- Warth et al. (2014) Warth, G., Sasaki, M., Kavanagh, P. J., et al. 2014, A&A, 567, A136
- Williams (2014) Williams, P. M. 2014, MNRAS, 445, 1253
- Winkler et al. (2003) Winkler, C., Courvoisier, T. J.-L., Di Cocco, G., et al. 2003, A&A, 411, L1
- Zinnecker & Yorke (2007) Zinnecker, H. & Yorke, H. W. 2007, ARA&A, 45, 481