SUZAKU OBSERVATIONS OF SUBHALOS IN THE COMA CLUSTER
Abstract
We observed three massive subhalos in the Coma cluster with Suzaku. These subhalos, labeled “ID 1”, “ID 2”, and “ID 32”, were detected with a weak-lensing survey using the Subaru/Suprime-Cam (Okabe et al., 2014a), and are located at the projected distances of 1.4 , 1.2 , and 1.6 from the center of the Coma cluster, respectively. The subhalo “ID 1” has a compact X-ray excess emission close to the center of the weak-lensing mass contour, and the gas mass to weak-lensing mass ratio is about 0.001. The temperature of the emission is about 3 keV, which is slightly lower than that of the surrounding intracluster medium (ICM) and that expected for the temperature vs. mass relation of clusters of galaxies. The subhalo “ID 32” shows an excess emission whose peak is shifted toward the opposite direction from the center of the Coma cluster. The gas mass to weak-lensing mass ratio is also about 0.001, which is significantly smaller than regular galaxy groups. The temperature of the excess is about 0.5 keV and significantly lower than that of the surrounding ICM and far from the temperature vs. mass relation of clusters. However, there is no significant excess X-ray emission in the “ID 2” subhalo. Assuming an infall velocity of about 2000 , at the border of the excess X-ray emission, the ram pressures for “ID 1” and “ID 32” are comparable to the gravitational restoring force per area. We also studied the effect of the Kelvin-Helmholtz instability to strip the gas. Although we found X-ray clumps associated with the weak-lensing subhalos, their X-ray luminosities are much lower than the total ICM luminosity in the cluster outskirts.
1 INTRODUCTION
Galaxy clusters are the largest self-gravitating bound systems in the Universe and composed of thousands of galaxies, the intracluster medium (ICM), and the dark matter. The ICM covers the total mass range of roughly and is bound to the potential of the dark matter halo which covers that of . Therefore, the gravity of the dark matter halo plays the most important role in cluster evolution and structure formation. Numerical simulations with the Cold Dark Matter (CDM) model predict that the galaxy clusters form through merger or accretion of the smaller system like galaxy groups. Since the dynamical time scale of galaxy clusters is comparable to the Hubble time, outskirts of the galaxy clusters still maintain the evolution effects via the accretion of the substructures. The central region of these accreting objects is expected to be survived until recent days as subhalos in the cluster host halo.
The mass distribution of subhalos provides us with information on the mass assembly of galaxy cluster. Okabe et al. (2014a) surveyed and measured the mass of subhalos in the Coma cluster using weak-lensing observations with the Subaru/Suprime-Cam. Thanks to the large apparent size, they detected 32 cluster subhalos whose mass range is . They first confirmed that the subhalo mass function, , is well represented with a single powerlaw or a Schechter function. The best-fit indexes of each model are , which agree well with CDM model prediction on sub-scale of cluster. Stacked signals of subhalos were well represented with a sharply truncated Navarro-Frenk-White (NFW) mass model (Navarro et al., 1995) as expected from a tidal destruction model. For three most massive subhalos whose mass are higher than , they measured mass and truncation radius of each subhalo. One of them is a famous substructure of the Coma cluster around the NGC 4839 group.
If subhalos in the cluster outskirts still possess some amount of their hot gas and are not excluded in X-ray analysis, the derived ICM density would be overestimated. The recent observations reported that the entropy of the ICM, which is a useful parameter for the thermodynamical history, shows flatter profiles beyond than expectations from pure gravitational heating (George et al., 2009; Reiprich et al., 2009; Bautz et al., 2009; Hoshino et al., 2010; Kawaharada et al., 2010; Simionescu et al., 2011; Urban et al., 2011; Akamatsu et al., 2011; Walker et al., 2012a; Akamatsu et al., 2012; Walker et al., 2012b; Sato et al., 2012; Walker et al., 2013; Ichikawa et al., 2013; Simionescu et al., 2013; Urban et al., 2014; Sato et al., 2014; Okabe et al., 2014b). Since the gas fraction in the Perseus cluster assumed hydrostatic equilibrium exceeds the cosmic baryon fraction, Simionescu et al. (2011) claimed the effect of the gas clumpiness, although there is no significant excess X-ray sources in the outskirts with a Chandra observation (Urban et al., 2014).
Weak-lensing mass estimation of cluster main halos are complementary to X-ray observations. In the cluster outskirts, the hydrostatic mass with Suzaku is significantly lower than the weak-lensing mass with the Subaru telescope (Kawaharada et al., 2010; Ichikawa et al., 2013; Mochizuki et al., 2015; Okabe et al., 2014b). Okabe et al. (2014b) discussed that the bivariate scaling functions of the electron density and temperature indicate that entropy flattening of the outskirts of the galaxy clusters caused by the steepening of temperature profiles. Deviations from hydrostatic equilibrium have been discussed in Kawaharada et al. (2010); Ichikawa et al. (2013); Mochizuki et al. (2015); Okabe et al. (2014b). Hoshino et al. (2010) proposed an another idea that electron temperature is lower than the ion temperature in these regions, since heating the electrons takes a longer time than that of the ion after accretion shocks and mergers.
With weak-lensing mass measurements of subhalos, we can search X-ray clumps associated with these subhalos efficiently with X-ray observations. In this paper, we describe the X-ray properties of three massive subhalos, whose mass is greater than , detected Subaru weak-lensing observations of the Coma cluster (Okabe et al., 2014a). Excluding the NGC 4839 subgroup, we observed two of the most massive subhalos with . We also observed a smaller subhalo, whose total mass is . We summarize the observations and date preparation in section 2. Section 3.1 shows the X-ray images and surface profiles of each subhalo. In section 3.2, we summarize the spectral fitting and that results. We compare of the X-ray properties with those of other galaxy groups, and discuss the effect of ram pressure and gas clumpiness in section 4.
2 OBSERVATION AND DATA REDUCTION
| IDa | (R.A., decl.)e | Distanceg | ||||
|---|---|---|---|---|---|---|
| arcmin | J2000.0 | Arcmin/ | ||||
| 1 | 8.6 | 61.8/1.42 | ||||
| 2 | - | - | 8.7 | 51.6/1.18 | ||
| 32 | 9.5 | 71.2/1.63 |
| Field name | Sequence | Date-Obs.a | (R.A., decl.)b | Exposurec |
|---|---|---|---|---|
| Number | J2000.0 | ksec | ||
| ID 1 | 808022010 | 2013-06-10T14:12:00 | , | 18.4 |
| ID 2 | 808021010 | 2013-06-10T00:39:15 | , | 23.7 |
| ID 32 | 808018010 | 2013-06-08T09:04:42 | , | 26.4 |
| ID 32 BGD | 808019010 | 2013-06-09T01:38:51 | , | 20.2 |
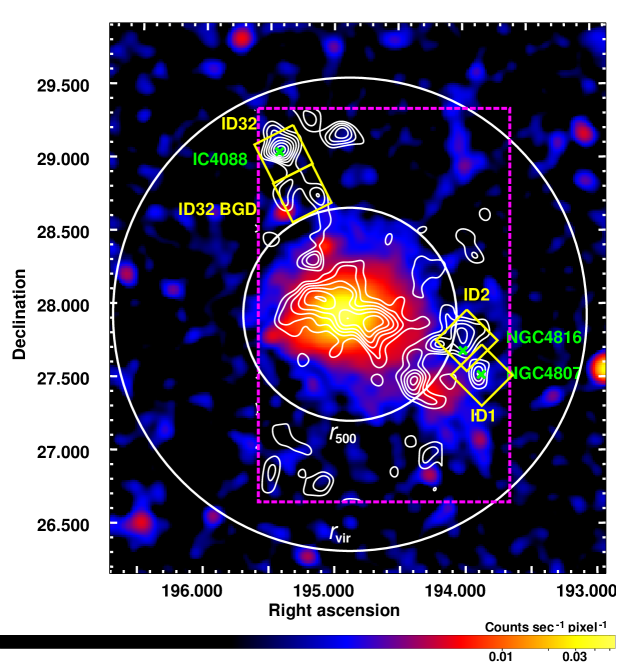
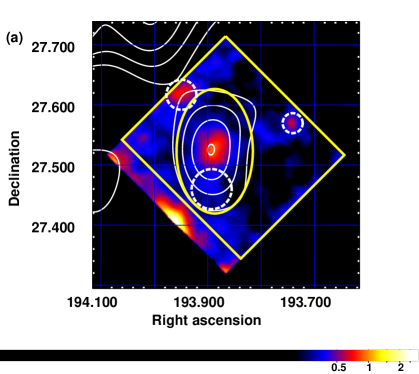
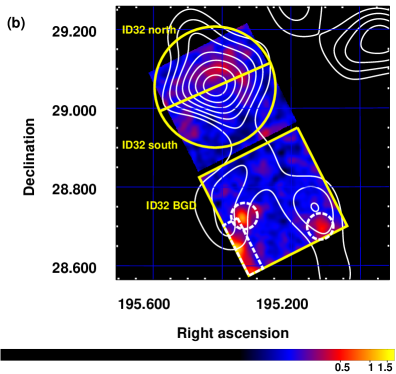
In the Coma cluster, Okabe et al. (2014a) detected three massive subhalos whose mass are higher than , and which are labeled as “ID 1”, “ID 9”, and “ID 32”. The weak-lensing signal of these three subhalos were well represented by a truncated NFW model. Since the “ID 9” is associated with a halo of the famous subgroup around NGC 4839, which has been already observed with and reported by Akamatsu et al. (2013), we observed “ID 1”, “ID 32”, and a southern offset region of “ID 32” as a background (hereafter “ID 32 BGD”) with Suzaku. We also observed “ID 2” subhalo ,which is associated with the NGC 4816 group and the total mass reach to 9, with Suzaku. The mass, truncation radius (hereafter ), and coordinates of each subhalo are summarized in table 1 and observational logs with Suzaku are shown in table 2. The three subhalos, ”ID 1”, ”ID 2”, and ”ID 32”, are located at the projected distances of 1.4 , 1.2 , and 1.6 from the X-ray peak of the Coma cluster, respectively. In figure 1, we overlaid the field of views (FOVs) of Suzaku pointings and the contours of mass map derived from weak-lensing (Okabe et al., 2014a) on the X-ray image with ROSAT. We also used four Suzaku pointings beyond of the Coma cluster to study the X-ray background emission. The details are described in Appendix A.
In this study, we used only XIS data. The XIS instrument consists of three sets of X-ray CCDs (XIS 0, 1, and 3). XIS 1 is a back-illuminated (BI) sensor, while XIS 0 and 3 are front-illuminated (FI). The instruments were operated the normal clocking mode (8 s exposure per frame). The data were reprocessed the standard screening criteria 111http://heasarc.nasa.gov/docs/Suzaku/processing/criteria_xis.html using HEAsoft 6.15. We also performed event screening with the cosmic-ray cut-off rigidity COR 6 GV, and the Earth rim ELEVATION 10°. We generated Ancillary Response Files (ARFs) by “xissimarfgen” Ftools task (Ishisaki et al., 2007), assumed a uniform sky of 20 radius. The effect of degrading energy resolution by radiation damage was included in the redistribution matrix files by “xisrmfgen” Ftools task. We employed the night Earth database generated by the “xisnxbgen” Ftools task for the same detector area to subtract the non-X-ray background (NXB).
3 ANALYSIS AND RESULTS
3.1 X-ray images and Surface brightness profiles
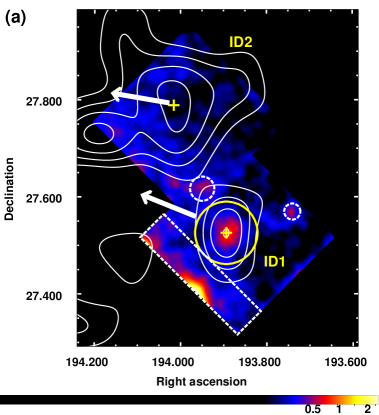
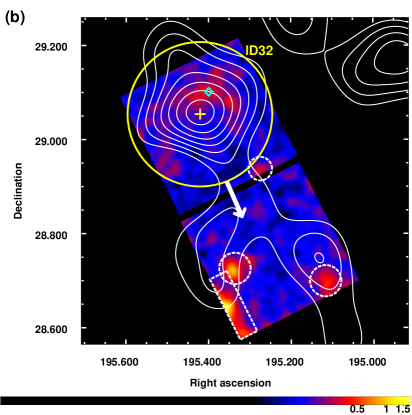
In figure 2, we present combined XIS images of subhalos in an 0.5–2.0 keV energy band. Here, the difference in the exposure times are corrected with exposure map generated by “xisexpmapgen” Ftools task. In addition, we also corrected the vignetting effect using a flat image at 1 keV222http://heasarc.gsfc.nasa.gov/docs/suzaku/analysis/expomap.html. We created surface brightness profiles from these images of individual subhalos along the direction to the center of the Coma cluster, (R.A., Decl.) = (). The resultant surface brightness profiles are shown in figure 3.
As shown in figure 2 (a) and figure 3 (a), an excess emission is seen around the center of the ”ID 1” mass contour. The surface brightness profile shows that most of the excess emission is confined within 2′() from the mass center. In contrast, the ”ID 2” subhalo does not show any excess emission: the brightness profile gradually increases toward the Coma cluster center as shown in figure 3 (b).
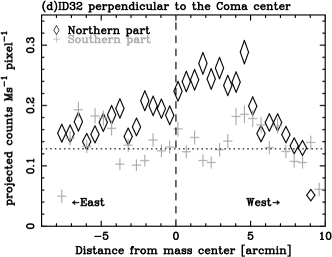
In figure 3 (c), the ”ID 32” subhalo shows an excess emission whose peak is not located on the center of the mass contour, but shifts about 3′ () away from the subhalo center toward the northern part or the opposite direction from the Coma cluster center. The excess emission is extended to at least 5′() from the mass center. Because of the asymmetrical profile for the “ID 32”, we also made projections of the surface brightness of the northern and southern parts from the mass center of the subhalo along the perpendicular direction against in figure 3 (c). The resultant projections of the surface brightness are shown in figure 3 (d). The excess emission at the northern direction extends out to 5–6′ () toward the east and west directions. The peak of the X-ray emission is located in the northern part and shifts about 3′ () away from the subhalo center toward west direction. In contrast, the brightness of most of the southern part is consistent with that of the background region, although there are two peaks at offsets of east and west directions. We extracted spectra around these two excess. Since their spectra are relatively hard and fitted with a power-law model, the southern peaks are possibly caused by background point sources.


3.2 Spectral fitting
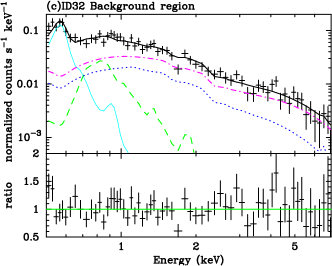
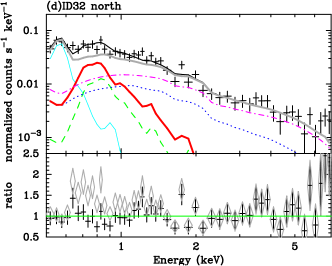
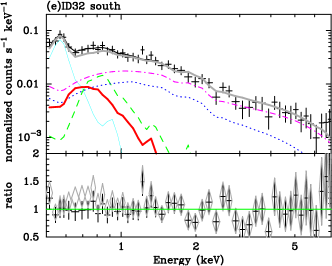
We extracted spectra over subhalo regions and background regions as shown in figure 4. The regions around point sources brighter than in 2.0-10.0 keV were excluded from the spectral analysis. Since the mass contours of the subhalo “ID 1” in linear scale are elongated, we extracted spectra over an elliptical region, whose semiminor and semimajor axes are 1.0 and 1.6 , respectively. Here, we excluded a circular region around a background galaxy group (Okabe et al., 2014a), plotted as a dashed circle in figure 4. To study background emissions including the ICM contribution, we extracted spectra over an square region (hereafter ”ID 1 BGD”), excluding the elliptical region. For the “ID 32” subhalo, we extracted spectra over two semicircular regions (hereafter ’south‘ or ’north‘ regions) of the subhalo out to the truncation radius. The background spectra for the “ID 32” were extracted from the FOV of the ”ID 32 BGD” observation.
The spectral fitting was carried out using XSPEC 12.8.1g and the extended C-statistic estimator. The spectra were binned to have at least one count per channel. We used the energy ranges of 0.5–7.0 keV and 0.7–7.0 keV for the BI and FI detectors, respectively. We excluded the energy band around the Si-K edge (1.82–1.84 keV) because its response was not modeled correctly.
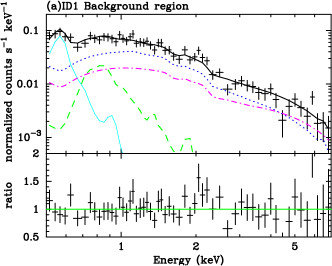
We assumed that the X-ray emissions from the ”ID 1 BGD” and ”ID 32 BGD” consist of the Galactic emissions from the Local Hot bubble (LHB) and the Milky Way Halo (MWH), the Cosmic X-ray background (CXB), and the ICM of the Coma cluster. The LHB and MWH were modeled with a thermal plasma model (apec model; Smith et al. 2001) without and with the Galactic absorption, and , respectively. Here, the indicates the Galactic absorption using phabs model in the XSPEC package, and the column density of each subhalo direction were summarized in table 1. The temperature of the was fixed at 0.1 keV, while its normalization was a free parameter. We also allowed the temperature and normalization of the to vary. For the LHB and MWH, the redshift and abundance were fixed to be 0 and 1 solar, respectively. The CXB emission was described an absorbed power-law model with a photon of index , . The normalization of were estimated beyond the virial radius of the Coma cluster as described in appendix A.
The ICM emission was modeled with a thermal plasma model with the Galactic absorption, . The temperature, normalization, and abundance were allowed to vary, except for the abundance for ”ID 32 BGD” which was fixed at 0.2 solar. The redshift of the ICM component was fixed at the value of the Coma cluster, . Thus, we used the following model formula for the spectra for the ”ID 1 BGD” and ”ID 32 BGD”; Here, the is a normalization parameter for the difference in relative normalizations among XIS detectors.
For the subhalo regions, we added an extra thermal plasma model, . We allowed the temperature and normalization of of the ”ID 1” and ”ID 32” to vary. The abundance for the ”ID 1“ was a free parameter but that for the ”ID 32” were fixed at 0.2 solar, since we can not constrain the abundance. Even if the abundance was fixed to be 0.1 or 0.3 solar, the results did not change. The redshift of the was also fixed at the value of the Coma cluster. Thus, we modeled the spectra extracted from subhalo regions as following formula; We finally fitted the spectra extracted for each subhalo region and corresponding background region simultaneously, assuming that the X-ray background components have the same surface brightness, temperature and abundances. Here, relative normalizations of three XIS detectors were allowed to vary.
The fitting results are summarized in table 3. Figure 5 shows the best fit spectra of the background regions. The ICM temperatures for the “ID 1” and “ID 32” regions, keV and keV, respectively, are consistent with previous results of southwest and northwest directions (Simionescu et al., 2013) at similar distance from the cluster center, respectively. Although the error range is fairly large, the ICM abundance of the “ID 1” was also consistent with that in Simionescu et al. (2013).
The temperatures and normalizations of the Galactic components are consistent between the “ID 1” and “ID 32”. The normalization of the LHB derived from the ”ID 1” and ”ID 32” spectral fits is consistent with that for the region at (Appendix). However, the temperature and normalization of MWH are significantly different from those derived for the region. When we use the temperature and normalizations of the the Galactic components obtained from region, and fitted the spectra of the subhalo regions, the temperature and normalization of the ”ID 1” and the ’north’ region of the ”ID 32” did not change within statistical errors, although the temperature of the ’south’ region of ”ID 32” decreased to about 0.1 keV. Considering the possible spatial variation of the Galactic components, we adopted the results of the simultaneous fits using ”ID 1 BGD” and ”ID 32 BGD”.
| Background components | ||||||
|---|---|---|---|---|---|---|
| Field name | ||||||
| keV | keV | Solar | ||||
| ID 1 BGD | 18.1 | 4.33 | 0.11 | 8.87 | ||
| ID 32 BGD | 18.1 | 0.2(fixed) | 2.68 | |||
| Subhalo components | ||||||
| redshift | Luminosityb | Fluxb | ||||
| keV | solar | 10 | 10 | |||
| “ID 1” | 0.0231 | |||||
| “ID 32” north | 0.0231 | 0.2(fixed) | ||||
| “ID 32” south | 0.0231 | 0.2(fixed) | ||||
| “ID 1” | 0.418 | |||||
| “ID 32” north | 0.189 | 0.2(fixed) | ||||
| “ID 32” south | 0.189 | 0.2(fixed) | ||||
3.3 Fitting results of the subhalo components
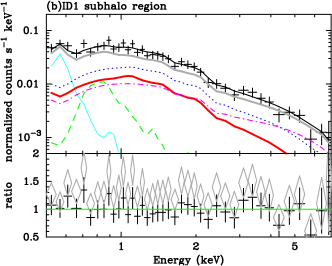
Figure 5 also shows the best fit spectra of the subhalo regions. The fitting results of the subhalo components are summarized in table 3. The spectra for the subhalo and background regions were well-represented with our model formula. Without the subhalo components, the data-to-model ratios show significant excess.
The temperatures of each subhalo component are lower than that of the surrounding ICM. For the “ID 1”, the temperature is keV and is cooler than the ICM component, keV. The temperatures of ‘north’ and ‘south’ of the “ID 32” are about keV and keV, respectively. These values are significantly lower than the surrounding ICM temperature, keV. The abundance of the subhalo “ID 1” component is consistent with that of the surrounding ICM. The luminosity of the “ID 1” component is about at 0.5–2.0 keV energy range and those of the ’north‘ and ’south‘ regions of “ID 32” are and at the same energy range, respectively.
3.4 The representative background structure fitting
Background galaxy groups are located within the “ID 1” and “ID 32” subhalo regions at (Wen et al., 2009) and (Hao et al., 2010), respectively (Okabe et al., 2014a). If the weak-lensing signals were mostly caused by the corresponding background galaxy groups, the virial mass, would be 1–3 for ”ID 1” and several times for ”ID 32” (Okabe et al., 2014a). For such massive clusters, we expect that the ICM temperatures and ICM luminosities exceed 10 keV and for ”ID 1”, respectively, and several keV and several times for ”ID 32”, respectively. Therefore, we refitted the spectra using redshifts of the background galaxy groups. As a result, the temperature increased to keV and 0.8 keV for ”ID 1” and the ’north’ region of ”ID 32”, respectively, and the X-ray luminosity became and 2 in the 0.5–2.0 keV range, respectively. These temperatures and X-ray luminosities are far below the expected values assuming that the weak-lensing signals come from the background galaxy groups. Thus, it is unlikely that the excess emissions and weak-lensing signals come from the background galaxy groups, and fairly are associated with the Coma cluster.
3.5 The gas mass estimation
To estimate the gas mass of each subhalo, we first approximated spherical symmetry and assumed constant density up to 2.5 arcmin and 6 arcmin for “ID 1” and “ID 32”, respectively , which correspond to for each subhalos, since beyond these radii, the excess emission was not detected. The best-fit normalization in the spectral fitting leads us to derived average electron density within the extracted region of each subhalo. The resultant average electron densities of “ID 1”, ’south‘ and ’north‘ regions of “ID 32” are cm-3, cm-3, and cm-3, respectively. Integrating the electron densities out to 0.6 , the derived gas mass are , , and for ”ID 1” and the ’north‘ and ’south‘ regions of “ID 32”, respectively.
We also estimated the electron density profiles by deprojecting radial profiles of the surface brightness centered on the center of the mass contour and the X-ray peak of ”ID 1” and ”ID 32” subhalos, respectively. We integrated the electron density profiles out to , within which the X-ray emissions of each subhalo are detected. Then, the derived gas mass of ”ID 1” and ”ID 32” are and , respectively. Comparing these values with those assuming constant electron density, the systematic uncertainties in the gas mass would be about a factor of 2–3.
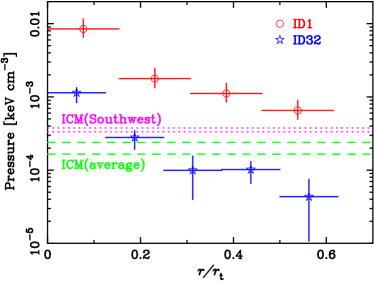
Using the radial profiles of the electron density profile and the temperatures of ”ID 1” and the ’north‘ region of ”ID 32” derived from the spectral fits, radial profiles of the thermal gas pressure, out to , were estimated and plotted in figure 6. Since the surface brightness and temperature of the ICM component surrounding ”ID 1” and ”ID 32” are close to those of the southwest direction and the azimuthal averages excluding the southwest direction derived by Simionescu et al. (2013), we compared our pressure profiles with those derived by Simionescu et al. (2013). The thermal pressure at of ”ID 1” is slightly higher than that of the southwest direction. That in 0.3–0.5 of ”ID 32” is slightly below the ICM pressure.
We also estimated the gas mass assuming that excess emission come from background galaxy groups located within the “ID 1” and “ID 32” subhalo regions. The calculation methods are the same as mentioned in the previous paragraphs. Assuming a flat density profiles, the total gas mass for “ID 1” and “ID 32” are and , respectively. By deprojecting the surface profiles, we estimated the gas mass by integrating the calculated density profiles. The resultant gas masses are and for “ID 1” and “ID 32”, respectively.
4 DISCUSSION
We observed three massive subhalos detected by the weak-lening survey with Subaru, “ID 1”, “ID 2” and “ID 32”, which are located on the projected distances of 1.4 , 1.2 , and 1.6 from the center of the Coma cluster, respectively, with Suzaku. The excess X-ray emission have been detected from “ID 1” and “ID 32”, while “ID 2” has no significant excess emission. Temperatures of these subhalos were lower than that of the surrounding ICM. In section 4.1, we compare the - and - relations between subhalos and regular galaxy groups. We estimate the ram pressure and mass loss rate caused by the Kelvin-Helmholtz instability in section 4.2. As discussed in Simionescu et al. (2011), the clumping in the galaxy clusters lead us to overestimate the electron density. In section 4.3, we study the effect of the subahlos on the density and temperature measurements.
4.1 Comparison of the gas mass fraction and temperature with other clusters
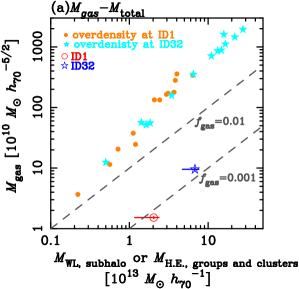
The gas mass and weak-lensing mass of ”ID 1” and ”ID 32” are plotted in figure 7 (a). The gas mass fraction, or the gas mass to weak-lensing mass ratio, of these two subhalos are about 0.001. Here, we used the gas mass derived from integrating the radial profiles of electron density. We compared these gas mass fraction of the subhalos with the gas mass to hydrostatic mass ratios of clusters and groups of galaxies. Since the mean density within the truncation radius of subhalo “ID 1” and “ID 32” are about 6600 times and 27000 times higher than the critical density of the Universe, respectively, we calculated gas mass and hydrostatic mass at a radius within which each average density is the same as each subhalo’s overdensity, using Chandra results by Vikhlinin et al. (2006). The gas mass fractions of these clusters correlate well with the hydrostatic mass, and are about 0.02–0.1, which are about 1–2 orders of magnitudes higher than those of subhalos. If these subhalos had been regular groups before infalling onto the Coma cluster, they should have lost most of their gas.
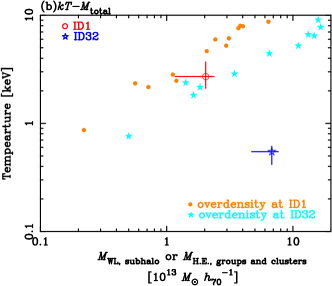
In figure 7 (b), we also compared the relation of the temperature and total mass (– relation) of the subhalos and clusters. Here, we also calculated the temperature and hydrostatic mass of the Chandra clusters in Vikhlinin et al. (2006) at the radius of the same over densities, or for ”ID 1” and for ”ID 32”. The temperature of ”ID 1” is slightly lower than expected by the relation of clusters. For “ID 32”, the temperature of the subhalo is several times lower than those of the relation of clusters.
4.2 The effect of ram pressure stripping
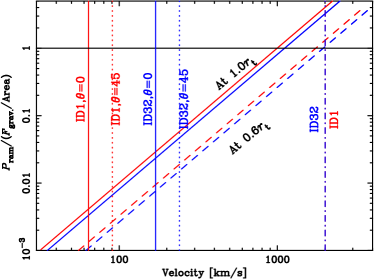
The observed very low gas mass fraction and morphologies of the excess emission indicate that the gas in the infalling subhalos has been stripped via ram pressure of the surrounding ICM. The subhalo would be unable to hold the interstellar materials when the ram pressure exceeds the gravitational restoring force per area. At the truncation radius, the fraction of the ram pressure to the gravitational restoring force per area (Takizawa, 2006),
| (1) |
is the useful parameter to investigate the present stripping effect. Here, the , , , , and are the electron density of the ICM, velocity of the subhalo, truncation radius, mass of subhalo, and gas mass of subhalo, respectively. By adopting those parameters of the subhalos and ICM, we calculated the ram pressure to the gravitational force per area ratio as a function of the subhalo moving velocity and plotted in figure 8. We also estimated the ratio at the , which corresponds to the border of the excess X-ray emission. The ram pressure should have been lower than the present value when infalling the outer regions, since the ICM density decreases with the distance from the cluster center.
Since NGC 4807 and IC 4088 are located near the center of the mass contours of “ID 1” and “ID 32” (see figure 1), respectively, these galaxies are likely representative galaxies of these subhalos. The recession velocities of NGC 4087 and IC 4088 are and (NASA/IPAC Extragalactic Database333http://ned.ipac.caltech.edu/), respectively. Considering that of the Coma cluster, , the velocities in line of the sight of these galaxies are and , respectively. As shown in figure 8, if these subhalos are moving toward the line of sight, the ratio of the ram pressure to the gravitational force in a unit area are orders of magnitudes lower than the unity. Even if these subhalos are moving with a inclination angle of 45 degree, the ram pressure is not still effective to remove the gas of the subhalos.
On the other hand, the infall velocities for ”ID 1” and ”ID 32” are about , which is estimated using the best-fit NFW profile derived from the weak-lensing for the main halo (Okabe et al., 2010). This value is comparable with the infall velocity of the subcluster, NGC 4839 group, whose infall velocity is km s-1 (Colless & Dunn, 1996). Adopting the infall velocity, at , the ram pressure is higher than the gravitational force per area and enough to remove the gas, and at , or at the border of the excess X-ray emission, the ram pressure is comparable to the gravitational force per area. These subhalos are located beyond on the sky, and if they are moving perpendicular to the line of sight with the infall velocity, their gas beyond can be stripped via ram pressure stripping.
We also estimated the mass loss rate caused by Kelvin-Helmholtz instabilities since the gas in the center of ”ID 32” seems to be removed. Nulsen (1982) estimated the mass loss rate caused by viscous stripping via Kelvin-Helmholtz instabilities, . Here, and are the disk radius and gas density of the ICM, respectively. The mass loss rate can convert
| (2) |
We assumed that is same as the truncation radius. Using the velocity of line of sight of each subhalo, the results of the mass loss rate were the yr-1 for “ID 1” and yr-1 for “ID 32”. In contrast, adopting the infall velocity, the mass-loss rates of “ID 1” and “ID 32” are 180 and 680 , respectively. Considering the time scales for the mass-loss of 520 Myr and 390 Myr for ”ID 1” and ”ID 32”, respectively, infalling from the virial radius of the Coma cluster, the total mass loss from adopting the infall velocity the subhalo are about and for “ID 1” and “ID 32”, respectively. These values of mass are more massive than current gas mass of the both subhalos. Therefore, destroying of gas by Kelvin-Helmholtz instability explains the very low gas fraction of ”ID 1” and ”ID 32” subhalos. However, the mass-loss rate would be smaller with magnetic fields which suppress the destruction by Kelvin-Helmholtz instability.
4.3 The contribution of the X-ray emission of subhalos to the ICM
enables us to measure the entropy profiles of the galaxy clusters out to the virial radius (George et al., 2009; Reiprich et al., 2009; Bautz et al., 2009; Hoshino et al., 2010; Kawaharada et al., 2010; Simionescu et al., 2011; Urban et al., 2011; Akamatsu et al., 2011; Humphrey et al., 2012; Walker et al., 2012a; Akamatsu et al., 2012; Walker et al., 2012b; Sato et al., 2012; Walker et al., 2013; Simionescu et al., 2013; Ichikawa et al., 2013; Urban et al., 2014; Sato et al., 2014; Okabe et al., 2014b; Mochizuki et al., 2015). Contrary to the prediction of the accretion shock heating model prediction, the entropy of galaxy clusters show flat profiles beyond . Simionescu et al. (2011) interpreted that gas density in the outskirts are overestimated due to gas clumping and the entropy are underestimated. However, observing the Perseus cluster outskirts with Chandra, the number of detected sources is consistent with the background sources (Urban et al., 2014). With X-ray and weak-lensing joint analysis, Okabe et al. (2014b) discussed that entropy flattening of the outskirts of the galaxy clusters caused by the steepening of the temperature profiles, rather than the flattening of the gas density.
We studied the effect of subhalo luminosities on the estimation of electron densities when these subhalos are not excluded from spectral analysis. The observed X-ray flux of the excess emissions of ”ID 1” and ”ID 32” are (1–2) in the 0.5–2.0 keV energy band. Considering that the threshold of detection of point sources with a 10 ks exposure is about in the 2.0-10.0 keV range, if similar subhalos are located in other clusters, most of them would be below the detection threshold flux of Suzaku. We note that regions around subhalos like ”ID 9”, or the southwest subcluster around NGC 4839, can be easily excluded from spectral analysis of clusters observed with Suzaku, because of their very high X-ray luminosities.
Within projected distance 1.2–1.6 where the two subhalos are located, the ICM gas mass would be several times 10, which is estimated using the weighted average of the radial profiles of electron density observed with Suzaku by Simionescu et al. (2011) excluding the southwest direction, where the X-ray luminous subhalo, ”ID 9” is located. Thus, the ICM gas mass is two orders of magnitude higher than the gas mass of excess emission of the ”ID 1” and ”ID 32”. The 0.5–2.0 keV luminosities of these two subhalos are a few times and are negligible when comparing with the X-ray luminosity of the Coma cluster within 1.2–1.6 , , which is also estimated using the average of ICM temperature and normalization observed with Suzaku (Simionescu et al., 2013) excluding the southwest direction. Although Okabe et al. (2014a) detected 32 subhalos with weak-lensing observations, most of them are less massive and located within . As a result, we can conclude that X-ray emission of subhalos does not affect the overestimating the gas mass of the Coma cluster.
In order to evaluate the bias in the ICM temperature measurements, we extracted spectra again from FOVs observed around each subhalo, and fitted the spectra with ICM and background model. The temperature of the ICM did not change within statistic error range, since the total flux of subhalos is 1-2 orders of magnitude lower than that of the ICM. If number of subhalos are much higher, they may affect on the temperature and density measurements. Therefore, we created the mock spectra assuming two thermal components for clumps and surrounding ICM emission, by changing the flux ratio of two components. When we simulated a sum of mock spectra of 2 and 1 keV emissions for the ICM and subhalo whose flux is half of that of ICM, respectively, the derived temperature with a single temperature model became 1.2 keV, which is 40% lower than the original ICM temperature, and the electron density was also overestimated by 30%. This indicates the entropy to be low biased by 50%. Thus, if there are many clumps enough to increase the normalization of the ICM for changing the entropy profiles, the temperature bias is more significant.
Simionescu et al. (2013) derived the entropy of the Coma cluster beyond () derived from Planck Collaboration et al. (2013), and the entropy profile is consistent with the accretion shock heating model (Pratt et al., 2010). Here, the derived from weak-lening analysis (Okabe et al., 2010) is well consistent with that from Planck Collaboration et al. (2013). Since there is no evidence for the entropy flattening like other clusters and pressure excess, they suggested the gas clump are easily destroyed in a dynamical active cluster. Therefore, their discussion is consistent with our study that gas clump does not affect to the gas density estimation of the Coma cluster.
5 SUMMARY AND CONCLUSIONS
We observed the three massive subhalos, “ID 1”, “ID 2”, and “ID 32”, which are detected from Subaru weak-lening analysis (Okabe et al., 2014a) with Suzaku. The weak-lensing survey of subhalos in the outskirts of the galaxy cluster enable us to efficiently carry out follow-up X-ray observations gas subhalo candidates associated with weak-lensing detected subhalos.
While the excess emission is seen around the center of “ID 1” mass contour, the “ID 32” subhalo shows that the emission peak is shifted in the northern part or outer side from the Coma cluster center. In contrast to above two subhalos, the ”ID 2” subhalo does not show any excess emission. The spectral analysis indicated that the temperature of the subhalo gas is significantly lower than the surrounding ICM. By deprojecting the surface brightness profiles, we derived the gas mass of each subhalo. The total gas mass of “ID 1” and “ID 32” are and , respectively. Comparing with the and relation of regular galaxy groups, gas fractions of the subhalos are much lower than regular galaxy groups. Adopting the infall velocity estimated from the best-fit NFW profile derived by weak-lensing analysis of the Coma cluster (Okabe et al., 2010), beyond 0.6 times the truncation radius of the subhalos, or at the border of the excess X-ray emission, the ram pressure is effective to remove the gas. With the infall velocity, total amount of the removed gas mass from the subhalos via Kelvin-Helmholtz instabilities are about and for “ID 1” and “ID 32”, respectively. The luminosities of subhalos are about two orders of magnitude lower than that of the Coma cluster outskirts and do not affect on the gas mass estimate of the ICM.
Acknowledgements
We thank the anonymous referee for careful reading the manuscript and providing valuable comments. We also thank all members of the Suzaku operation team and the XIS calibration team. We acknowledge the support of a Grant-in-Aid for Scientific Research from the MEXT, No. 25400235(K. M.), 25800112 (K. S.), and 26800097(N. O.). This work was supported by “World Premier International Research Center Initiative (WPI Initiative)” and the Funds for the Development of Human Resources in Science and Technology under MEXT, Japan.
Appendix A The CXB estimation
For estimations of the Cosmic X-ray Background (CXB) level, we extracted the spectra beyond offset observations, which is corresponding to (Okabe et al., 2010), excluding south region from the Coma cluster, whose observation logs are shown in table 2. We searched for point-like sources with “wavdetect” tool in CIAO444http://cxc.harvard.edu/ciao/ in 0.5–2.0 and 2.0–5.0 keV images. We also excluded the area around the hot pixels 555http://www.astro.isas.ac.jp/suzaku/doc/suzakumemo/suzakumemo-2010-01.pdf. The flux level of the faintest source was about 1 erg s-1 cm-2 in 2.0–10.0 keV with a power-law model of a fixed photon index, 1.7. We assumed that the background emission were composed to two thermal Galactic emissions, the Local Hot Bubble (LHB) and the Milky Way Halo (MWH), and the Cosmic X-ray background. The LHB and MWH were modeled non-absorbed and absorbed thermal plasma model (; Smith et al. 2001). The CXB was modeled an absorbed power-law model. We also convolved the Galactic absorption with photoelectric absorption model, phabs. The column density was fixed to be (Kalberla et al., 2005). Therefore, we modeled the spectra by the follow formula, Although the temperature of the LHB was fixed at 0.1 keV, the normalization was allowed to vary. The temperature and normalization of the MWH were free parameters. The photon index of the CXB was fixed at 1.4, and the normalization was allowed to vary. The fitting results of are summarized in table 5. The derived CXB normalization was consistent with Kushino et al. (2002). The parameters of LHB and MWH are comparable with previous results (Simionescu et al., 2013).
| Field name | Sequence No. | Obs. datea | (R.A., decl.)b | Exposurec |
|---|---|---|---|---|
| J2000.0 | ksec | |||
| East 110′ | 806037010 | 2011-06-19T14:09:55 | , | 11.1 |
| East 120′ | 806038010 | 2011-06-20T01:23:51 | , | 13.8 |
| NW 110′ | 806045010 | 2011-06-22T17:48:52 | , | 14.1 |
| NW 120′ | 806046010 | 2011-06-23T06:03:44 | , | 11.9 |
| keV | |||
|---|---|---|---|
References
- Akamatsu et al. (2011) Akamatsu, H., Hoshino, A., Ishisaki, Y., et al. 2011, PASJ, 63, 1019
- Akamatsu et al. (2012) Akamatsu, H., de Plaa, J., Kaastra, J., et al. 2012, PASJ, 64, 49
- Akamatsu et al. (2013) Akamatsu, H., Inoue, S., Sato, T., et al. 2013, PASJ, 65, 89
- Bautz et al. (2009) Bautz, M. W., Miller, E. D., Sanders, J. S., et al. 2009, PASJ, 61, 1117
- Colless & Dunn (1996) Colless, M., & Dunn, A. M. 1996, ApJ, 458, 435
- George et al. (2009) George, M. R., Fabian, A. C., Sanders, J. S., Young, A. J., & Russell, H. R. 2009, MNRAS, 395, 657
- Hao et al. (2010) Hao, J., McKay, T. A., Koester, B. P., et al. 2010, ApJS, 191, 254
- Hoshino et al. (2010) Hoshino, A., Henry, J. P., Sato, K., et al. 2010, PASJ, 62, 371
- Humphrey et al. (2012) Humphrey, P. J., Buote, D. A., Brighenti, F., et al. 2012, ApJ, 748, 11
- Ichikawa et al. (2013) Ichikawa, K., Matsushita, K., Okabe, N., et al. 2013, ApJ, 766, 90
- Ishisaki et al. (2007) Ishisaki, Y., Maeda, Y., Fujimoto, R., et al. 2007, PASJ, 59, 113
- Kalberla et al. (2005) Kalberla, P. M. W., Burton, W. B., Hartmann, D., Arnal, E. M., Bajaja, E., Morras, R., Pöppel, W. G. L. 2005, A&A, 440, 775
- Kawaharada et al. (2010) Kawaharada, M., Okabe, N., Umetsu, K., et al. 2010, ApJ, 714, 423
- Kushino et al. (2002) Kushino, A., Ishisaki, Y., Morita, U., et al. 2002, PASJ, 54, 327
- Lodders (2003) Lodders, K. 2003, ApJ, 591, 1220
- Mochizuki et al. (2015) Mochizuki et al., submitted to ApJ, ,
- Navarro et al. (1995) Navarro, J. F., Frenk, C. S., & White, S. D. M. 1995, MNRAS, 275, 720
- Nulsen (1982) Nulsen, P. E. J. 1982, MNRAS, 198, 1007
- Okabe et al. (2010) Okabe, N., Okura, Y., & Futamase, T. 2010, ApJ, 713, 291
- Okabe et al. (2014a) Okabe, N., Futamase, T., Kajisawa, M., & Kuroshima, R. 2014, ApJ, 784, 90
- Okabe et al. (2014b) Okabe, N., Umetsu, K., Tamura, T., et al. 2014, PASJ, 66, 99
- Planck Collaboration et al. (2013) Planck Collaboration, Ade, P. A. R., Aghanim, N., et al. 2013, A&A, 554, AA140
- Pratt et al. (2010) Pratt, G. W., Arnaud, M., Piffaretti, R., et al. 2010, A&A, 511, AA85
- Reiprich et al. (2009) Reiprich, T. H., Hudson, D. S., Zhang, Y.-Y., et al. 2009, A&A, 501, 899
- Sato et al. (2012) Sato, T., Sasaki, T., Matsushita, K., et al. 2012, PASJ, 64, 95
- Sato et al. (2014) Sato, K., Matsushita, K., Yamasaki, N. Y., Sasaki, S., & Ohashi, T. 2014, PASJ, 66, 85
- Simionescu et al. (2011) Simionescu, A., Allen, S. W., Mantz, A., et al. 2011, Science, 331, 1576
- Simionescu et al. (2013) Simionescu, A., Werner, N., Urban, O., et al. 2013, ApJ, 775, 4
- Smith et al. (2001) Smith, R. K., Brickhouse, N. S., Liedahl, D. A., & Raymond, J. C. 2001, ApJ, 556, L91
- Struble & Rood (1999) Struble, M. F., & Rood, H. J. 1999, ApJS, 125, 35
- Takizawa (2006) Takizawa, M. 2006, PASJ, 58, 925
- Urban et al. (2011) Urban, O., Werner, N., Simionescu, A., Allen, S. W., Böhringer, H. 2011, MNRAS, 414, 2101
- Urban et al. (2014) Urban, O., Simionescu, A., Werner, N., et al. 2014, MNRAS, 437, 3939
- Vikhlinin et al. (2006) Vikhlinin, A., Kravtsov, A., Forman, W., et al. 2006, ApJ, 640, 691
- Walker et al. (2012a) Walker, S. A., Fabian, A. C., Sanders, J. S., George, M. R., & Tawara, Y. 2012, MNRAS, 422, 3503
- Walker et al. (2012b) Walker, S. A., Fabian, A. C., Sanders, J. S., & George, M. R. 2012, MNRAS, 424, 1826
- Walker et al. (2013) Walker, S. A., Fabian, A. C., Sanders, J. S., Simionescu, A., & Tawara, Y. 2013, MNRAS, 432, 554
- Wen et al. (2009) Wen, Z. L., Han, J. L., & Liu, F. S. 2009, ApJS, 183, 197